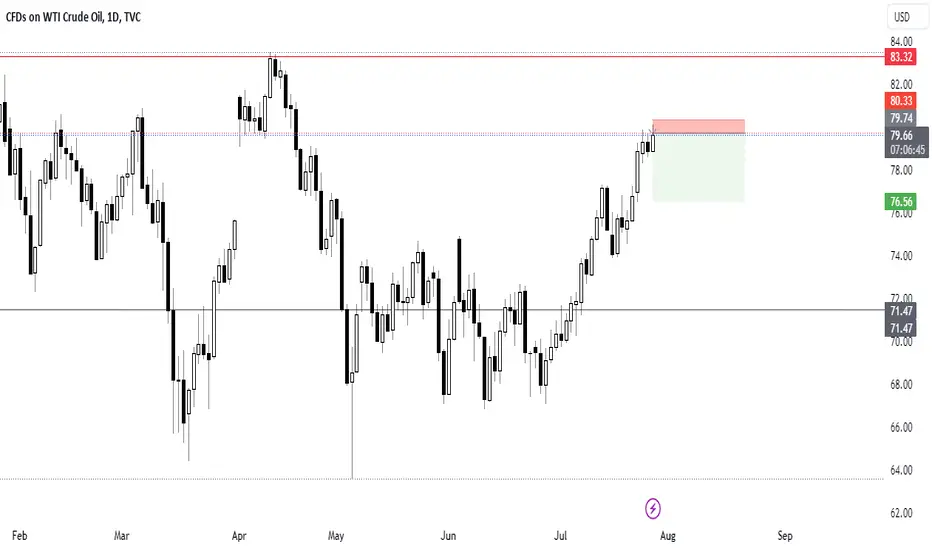
Crude oil: bulls are strong, step back to 80 and go long directl
Crude oil has been in a unilateral upward trend, and there is no need to say more about the bullish trend. If you don’t make a move, you will miss it. Now it falls back to 80.3 and goes long directly. There is still more than 200 points of space from the pressure of the high point of 83.5. Although The space is not very large, but the odds of winning are very high. If you fall back and go long, it is almost a market to bend down to pick up money!
But the overall trend remains unchanged, and the decline is just to give us a better point to go long. As can be seen from the trend in the figure, the nearest support level is 80.8, which is the moving average support of MA60. The lowest trend line support can be traced back to 80.3. You can do more, and the goal is to look at the high point of 82.1!
Usoilanalysis

India's Oil Imports From Russia Decline Further - Monitor ImpacOver the past few months, India, one of the largest importers of Russian crude oil, has been scaling back its purchases from Russia. This decline, which predates the recent geopolitical tensions, is expected to intensify due to the Indian government's decision to impose certain restrictions on imports from Russia. Such a move will likely disrupt the global oil market dynamics, potentially leading to a surge in oil prices shortly.
As traders, we must stay well-informed and agile in our decision-making process. The impact of reduced oil imports from Russia by India cannot be underestimated, as it not only affects the supply-demand balance but also has the potential to create a ripple effect across various sectors. Therefore, I strongly encourage you to closely monitor the developments surrounding India's oil imports and their subsequent impact on oil prices.
To help you stay ahead of the curve, I recommend keeping a close eye on crucial industry news sources, monitoring the official statements from the Indian government, and analyzing market trends. By doing so, we can better assess the potential consequences on oil prices and position ourselves advantageously to capitalize on any market fluctuations.
In conclusion, the decline in India's oil imports from Russia is a significant development that demands our immediate attention. Let us remain vigilant and proactive in our approach, ensuring that we are well-prepared to navigate any potential challenges that may arise from this situation.


Crude oil: we continue to pay attention to 80
The short-term goal of crude oil price is to stand above the 80 mark, and the price reached the target as scheduled last week. But even if it reaches 80, at present, the crude oil price does not show a short-selling signal
Seen from the daily line, the market continued to open, and the price maintained a fluctuating upward trend along the upward channel. Although there was a process of callback and rest in the middle, the overall callback range was not very large. Basically, they stepped out of new highs and stepped back to confirm the rise again, so it was big The direction is still dominated by callbacks. In 4 hours, the price encountered resistance near the upper rail and retreated. The price basically moved between the upper rail and the middle rail. The lower middle rail 80 area is supported.
Pay more attention to above 80
Share this point of view with my friends, I hope you can make more money and realize your dreams. Friends in need can keep up

Crude oil close to resistance to short
Crude oil continued to maintain an upward trend during this period. The current upward trend is coming to an end. You can see that near the resistance area shown in the chart you can short crude oil.

US Oil / WTI Analysis 30July2023Following last week's analysis, still in accordance with the price movement for next week. US Oil still looks very bullish with a tilt trend close to 45 degrees and at the closure of the week with full bullish candle shows the support of the buyer is still very strong. The closest target is currently in the price range of 83-84 which at that price is in contact with 2 areas of Fibo Extensions (Fibo Cluster)

The Impact of a Deluge of US Crude on the World's Key Oil Price
Over the past few years, the United States has experienced an unprecedented surge in crude oil production. This surge has turned the country into a significant player in the global oil market, creating a deluge of US crude that has profoundly impacted the world's key oil prices.
Traditionally, the world's key oil price was heavily influenced by the production decisions of OPEC and Russia, as they held significant control over global supply. However, the surge in US crude production has disrupted this status quo, introducing a new player with substantial production capabilities.
The influx of US crude has created a more competitive market, increasing supply and driving down the world's key oil price. This development has been welcomed by consumers globally, as it has translated into lower fuel costs and reduced inflationary pressures. However, it has also presented challenges for oil-producing nations heavily reliant on oil revenues to sustain their economies.
While this deluge of US crude has brought about positive outcomes regarding affordability and accessibility, it is crucial to consider the long-term effects on oil price stability. As traders, we are responsible for assessing the situation and engaging in proactive discussions to ensure a balanced and sustainable market.
Therefore, I invite you to join me in contemplating the following question: Could the ascent of oil prices slow down to a more stable pace? By encouraging thoughtful dialogue and sharing insights, we can collectively work toward a solution that benefits all stakeholders in the oil market.
I urge you to share your thoughts, ideas, and concerns regarding the current state of the global oil market. Let us foster an environment of open exchange where we can explore potential strategies to mitigate excessive volatility and promote a more balanced oil price trajectory.
Together, we can make a difference in shaping the oil market's future and ensure its stability for years to come. Please feel free to comment with your valuable insights.

USOIL TRADE IDEAAfter a strong bull run, I waited for a correction before continuing higher.
Let me know what you think In the comments!
My trading strategy is not intended to be a signal. It's a process of learning about market structure and sharpening my trading skills.
USOIL:Earnings summary
Today, oil has been rising, but at 77.6 I think there will not be a constant rise
The market is like that, and it doesn't make everyone easy to make money.
You must have a stable mindset to face the volatility of the market, which will deceive you and affect your judgment.
If you don't know how to trade yet and don't know how to face market volatility, contact me

Exciting Oil Price Breakthrough and a Lucrative OpportunityBrace yourself because we have witnessed a remarkable event - the oil price has broken through the MA 200 threshold for the first time this year. Isn't that incredible?
This significant breakthrough is a promising sign for all oil enthusiasts and traders like yourself. It indicates a potential upward trend and opens up a world of profitable opportunities. However, as we celebrate this achievement, it's crucial to consider the potential impact of the impending Fed rate hike on this market.
While the current market conditions seem favorable, we must remain vigilant and adapt accordingly. The Federal Reserve's decision to increase interest rates can introduce some volatility in the market, which might influence oil prices. Experienced traders understand that careful analysis and strategic planning are essential to navigate such situations successfully.
Here's the exciting part: I encourage you to seize this moment and log into oil trading! With the oil price breaking through the MA 200, there is a golden opportunity to capitalize on this upward momentum. You can reap substantial profits by leveraging your expertise and our robust trading platform.
Don't let this chance slip away! Our team of experts is here to support you every step of the way. We provide real-time market insights, comprehensive analysis, and cutting-edge tools to help you make informed decisions and maximize your trading potential.
So, what are you waiting for? Let's dive into the oil market together and make the most of this breakthrough. Log into your trading account now and explore the exciting possibilities that lie ahead. Remember, taking action's always better than regretting missed opportunities.

WTI OIL / US OIL AnalysisUs oil is quite interesting. The movement is now in accordance with the analysis that I gave a few weeks ago.
There are things that are repeated here, namely the price of forming a curve bullish again. The possibility is the price of bullish is quite high, if we pull the fibo extension, then the possibility of the price of pursuing fibo extensions 1. Fibo Extension 1 is more or less parallel to Fibo Extensions 1,618 from Wave 1. Could be, Wave 3 will move to the area. Take the opportunity to Long when the price is corrected.

Analysis of crude oil trading strategies
Crude oil is currently affected by the data, rebounding back down, but from the trend point of view, crude oil upward trend unchanged, the impact of data is only short-term, and crude oil has not tested a new high before, we are still in the trading operation to buy low, focus on the two positions below, 75.3 and 74.7, both of which have effective downward resistance, so we can choose to start buying at these two positions, looking forward to crude oil testing new highs upward
Crude Oil Personal Trading Strategy:
USOIL buy@74.7-75.2 tp:76-76.5
Join me for more free accurate trading signals

Potential Slowdown in Oil Price Ascent: Act Now to Stay AheadAs you may have noticed, oil prices have been consolidating from $74 to $77 per barrel. While this may initially seem optimistic, it is essential to consider the broader picture.
Upon analyzing the market indicators, it has come to my attention that the slow stochastics are showing a decline in oil prices. This could potentially indicate a slowdown in the current oil price ascent. As seasoned traders, we must avoid such market shifts and make informed decisions to protect our investments.
Considering the current situation, I strongly encourage you to take action and reassess your trading strategies to adapt to the changing market conditions. Here are a few steps you can consider:
1. Review your portfolio: Take a closer look at your current oil holdings and evaluate their performance in light of the recent consolidation and declining slow stochastics. Identify any potential vulnerabilities or areas for improvement.
2. Stay informed: Keep a close eye on the latest market news, trends, and expert opinions. Stay updated with relevant economic indicators, geopolitical developments, and other factors that could impact oil prices.
3. Diversify your approach: Consider diversifying your trading approach by exploring other energy commodities or related sectors. This can help mitigate risks and provide alternative profit opportunities.
4. Seek expert advice: Consult with experienced professionals or analysts in oil trading. They can provide valuable insights and help you navigate through the uncertainties of the market.
By taking proactive measures and staying ahead of the curve, we can position ourselves to make well-informed decisions and maximize our potential gains. Remember that the oil market is dynamic, and adapting to changing circumstances is essential for long-term success.
I encourage you to act promptly and thoughtfully. Assess the situation, gather information, and make informed decisions that align with your trading objectives and risk appetite.

USOILSPOT Weekly Analysis: New Perspective and Follow-Up DetailsIn recent weeks, we have witnessed a remarkable surge in oil prices, and the current market still exhibits the potential to add to growth over the coming sessions. This upward trajectory in price is a positive development for the OPEC+ in their attempt to break beyond the coveted threshold of $80 a barrel.
The remarkable upswing in oil prices can be attributed to a multitude of supporting factors. Notably, the decisive OPEC+ decisions on production cuts, coupled with receding inflation data from the US economy, have fostered the belief that the Federal Reserve will adopt a less aggressive stance towards interest rates in the future. This, in turn, has pushed the dollar to its lowest levels in 15 months, rendering dollar-denominated oil increasingly appealing to buyers utilizing alternative currencies.
USOILSPOT Technical Analysis:
In this video, we focus specifically on key supply and demand zones within the 4H and 1H timeframes, and following a thorough examination of these pivotal indicators, our primary objective is to provide ourselves with invaluable insights into the potential direction of price action for USOILSPOT in the upcoming week."
"Don't miss out on this invaluable opportunity to enhance your understanding of the future trajectory of USOILSPOT. Stay one step ahead of the curve and gain a distinct competitive edge by immersing yourself in this price-action-based technical analysis. Watch the video now and ensure you remain at the forefront of the ever-evolving oil market
Disclaimer Notice:
Please be aware that margin trading in the foreign exchange market, including commodity trading, CFDs, stocks, and other instruments, carries a high level of risk and may not be suitable for all investors. The content of this speculative material, including all data, is provided by me for educational purposes only and to assist in making independent investment decisions. All information presented here is for reference purposes only, and I do not assume any responsibility for its accuracy.
It is important that you carefully evaluate your investment experience, financial situation, investment objectives, and risk tolerance level. Before making any investment, it is advisable to consult with your independent financial advisor to assess the suitability of your circumstances.
Please note that I cannot guarantee the accuracy of the information provided, and I am not liable for any loss or damage that may directly or indirectly result from the content or the receipt of any instructions or notifications associated with it.
Remember that past performance is not necessarily indicative of future results. Keep this in mind while considering any investment opportunities.

Latest crude oil signal analysis
Crude oil medium-term pullback sorting, after the decline began to fluctuate up, the current crude oil to around 74.8, it is expected that crude oil will return to the trading intensive area around 75.5-76.1, the lower 73.8 support is still valid, the upper focus on resistance around 76.1, trading options between 74.3-77, guaranteed to get a good profit
Crude Oil Personal Trading Strategy:
USOIL sell@74.1-74.5 tp:75.5-75.9
Join me for more free accurate trading signals

USOIL - IMPORTANT BREAKOUT📈Hello Traders👋🏻
On The Daily Time Frame The USOIL Price Reached a Strong Resistance Level (74.92 - 73.91).
Currently, This Key Level is Broken (Resistance Level Becomes new Support Level)🔥
So, I Expect a Bullish Move📈
i'm waiting for a retest...
-----------
TARGET: 76.50🎯
___________
if you agreed with this IDEA, please leave a LIKE, SUBSCRIBE or COMMENT!

USOIL: EIA data, bears
Last week's API data showed a very large gap between the expected value and the announced value, but the market reaction was not so large. It should be due to doubts about the data. In addition, the crude oil volume announced today is bullish for the market.
So although today's API crude oil inventory data is bearish for the market,but the market rallied.
Now we come to the resistance level near 76. If you judge from the perspective of data trading, you cannot rule out the possibility of tempting bulls, because usually the probability of EIA and API moving in the same direction is very high, so for EIA, short selling should be safer.

Hedge funds are again piling into oil, driven by weak dataHedge funds are again piling into oil, driven by the recent weak economic data from Europe and China. This is a golden opportunity for us to consider investing in oil and reap the rewards of this bullish trend!
The recent economic reports have painted a picture of uncertainty and volatility in the global market. Europe's economic growth has faltered, while China's growth rate has slowed. Such news has sent shockwaves through the investment world, creating an environment ripe with profit potential. As astute traders, we know that in times of uncertainty, there lies an opportunity for those who dare to seize it!
Hedge funds, renowned for their ability to spot lucrative investment opportunities, have recognized the immense potential in oil. They are flocking to this commodity, anticipating a surge in demand as the global economy recovers from its recent setbacks. And why shouldn't we join them in this exhilarating race toward profit?
With favorable oil prices, it's the perfect time to consider investing in this energy giant. The recent economic data has temporarily decreased oil prices, allowing us to enter the market at a lower cost. As the world economy rebounds and demand for oil surges, we can expect to witness a remarkable price rise, leading to substantial gains for those who act swiftly.
I urge you to consider the potential of investing in oil once again. The time is now! Don't let this thrilling opportunity pass you by. Capitalizing on the current market conditions allows us to position ourselves for substantial profits and enjoy the fruits of our wise decisions.

USOIL - Long active ✅Hello traders!
‼️ This is my perspective on USOIL.
Technical analysis: Here we are in a bullish market structure from 4H timeframe perspective, so I am looking for longs. I expect bullish price action from here as we can see that price filled the imbalance and rejected from bullish order block.
Like, comment and subscribe to be in touch with my content!

Oil Slides Amidst Weaker China Economic Data China plays a significant role in the global economy, and any fluctuations in its economic performance can have far-reaching consequences. The recent release of weaker-than-expected economic indicators from China has raised serious concerns about the country's economic health. These indicators include a slowdown in industrial production, declining retail sales, and decreased fixed-asset investments.
Given China's status as the world's largest importer of oil, any economic downturn in the country is likely to directly impact oil demand and prices. We have already witnessed a significant oil price slide due to this unsettling news. The market sentiment has become increasingly bearish, and we must approach our oil investments cautiously during these uncertain times.
Therefore, I strongly encourage you to hold off on any immediate oil investments until we gain further clarity on the situation. It is essential to closely monitor the developments in China's economic landscape, as well as the subsequent impact on global oil demand. By exercising patience and prudence, we can avoid potential losses and make more informed decisions when the time is right.
In the coming weeks, I will closely monitor the market and keep a keen eye on China's economic indicators. I will keep you updated with any significant developments that may impact our investment strategies. Additionally, I urge you to stay informed through reliable sources and expert analysis to ensure you are well equipped to navigate these challenging market conditions.
Please remember that our primary goal is to protect our investments and maximize returns. We can safeguard our portfolios from unnecessary risks by adopting a cautious approach and refraining from impulsive oil investments.


Potential Decline in Brent Crude Oil MomAs you may be aware, technical indicators such as the Moving Average Convergence Divergence (MACD) and Stochastics have been widely used by traders to gauge market sentiment and identify potential trend reversals. In the case of Brent Crude Oil, these indicators indicate a possible decline in momentum.
The MACD, a trend-following momentum indicator, shows a bearish crossover, suggesting that the short-term moving average is crossing below the long-term moving average. This occurrence is often seen as a signal for a potential downward trend. Similarly, the Stochastics oscillator, which measures overbought and oversold conditions, indicates that Brent Crude Oil is approaching overbought levels, implying a possible price correction.
While it is important to note that technical indicators are not infallible and should always be used with other fundamental and technical analysis tools, converging these signals warrants careful consideration. Monitoring the market closely and exercising caution in trading might be prudent.
It is worth mentioning that various factors can influence the oil market, including geopolitical events, supply and demand dynamics, and global economic conditions. Therefore, it is crucial to maintain a comprehensive approach to trading and consider multiple perspectives before making any significant decisions.
Please note that this idea is intended to serve as an observation and should not be considered financial advice. As a seasoned oil trader, I trust your expertise and judgment to evaluate the situation and make informed decisions accordingly.
If you have any questions or want to discuss this matter further, please do not hesitate to reach out in the comments.

USOILSPOT Weekly Analysis: New Perspective and Follow-Up DetailsOil prices soared to their highest level in nine weeks, setting the stage for a potential breakout to the upside and igniting hopes of an uptrend continuation. This surge comes against the backdrop of a weaker dollar, which hit a two-week low following robust U.S. jobs report that reinforced expectations for further Federal Reserve rate hikes.
The rally in prices was fueled by a combination of supply concerns and technical buying, which offset worries that additional rate hikes might impede economic growth and dampen the demand outlook for oil.
In a significant development, top oil exporters Saudi Arabia and Russia announced fresh output cuts last week. These cuts, in conjunction with reductions by OPEC+ (the Organization of the Petroleum Exporting Countries and its allies), now total approximately 5 million barrels per day (bpd), accounting for around 5% of global oil demand.
It's important to note that a weaker dollar makes crude oil more affordable for holders of other currencies, potentially boosting oil demand.
In this video, I present a comprehensive technical analysis of USOILSPOT, with a specific focus on key supply and demand zones within the Daily and 4-hour timeframes. By closely examining these critical indicators, our aim is to provide valuable insights into the potential direction of price action for USOILSPOT in the upcoming week.
Don't miss out on this invaluable technical analysis, which will enhance your understanding of the future trajectory of USOILSPOT. Stay ahead of the curve and gain a competitive edge by watching the video now!
Disclaimer Notice:
Please be aware that margin trading in the foreign exchange market, including commodity trading, CFDs, stocks, and other instruments, carries a high level of risk and may not be suitable for all investors. The content of this speculative material, including all data, is provided by me for educational purposes only and to assist in making independent investment decisions. All information presented here is for reference purposes only, and I do not assume any responsibility for its accuracy.
It is important that you carefully evaluate your investment experience, financial situation, investment objectives, and risk tolerance level. Before making any investment, it is advisable to consult with your independent financial advisor to assess the suitability of your circumstances.
Please note that I cannot guarantee the accuracy of the information provided, and I am not liable for any loss or damage that may directly or indirectly result from the content or the receipt of any instructions or notifications associated with it.
Remember that past performance is not necessarily indicative of future results. Keep this in mind while considering any investment opportunities.
