What adjustments will be made to oil prices?If traders don’t know how to trade, they can refer to the strategy of the Swing Trading Center. Earlier, it was announced to sell at 57.24. The lowest price reached around 56.3, and now the oil price has returned to 57.24. How to trade? If you are also confused, you can refer to the views of the Swing Trading Center.
At present, the supply of oil prices exceeds the demand, and some oil-producing countries will continue to increase the production of oil prices. The market has never recognized that oil will become a slow-selling product. Oil prices can be allowed to fall. But oil is not allowed to have no production capacity. I like this sentence.
Oil prices are expected to be mainly adjusted in the short term. The clear trading instructions have been announced in the Swing Trading Center. Stay tuned. Prevent missing good trading opportunities.
Usoilanalysis

After a period of fluctuation, it will continue to decline.WTI crude oil has recouped part of the decline from the sharp drop at the start of this week. It was quoted at $57.55 per barrel during intraday trading. OPEC+ has unexpectedly increased production again, and WTI crude oil has continued the bearish trend that has gradually taken shape since March. With the increase in global supply and the rise in macro risks, the downward price range has emerged once again. If the tensions in the Middle East escalate further, it may trigger market volatility. The eight core member states of the organization, led by Saudi Arabia, have agreed to increase daily production by 411,000 barrels in June, which is the same as the unexpected production increase in May. The cumulative production increase now exceeds 800,000 barrels per day, marking an important step towards canceling the target of the voluntary production cut of 2.2 million barrels per day that has been promised since 2022. Crude oil showed a trend of rising first and then falling today. After breaking through a new low, the upward movement continued. It faced resistance after reaching
you are currently struggling with losses, or are unsure which of the numerous trading strategies to follow, at this moment, you can choose to observe the operations within our channel.

Analysis and Layout of Crude Oil at the Opening of the MarketThe international crude oil market has experienced intense fluctuations. Both Brent crude oil and West Texas Intermediate (WTI) crude oil have recorded significant declines, dropping by 8.31% and 7.58% respectively. The expectations of OPEC+ production increase, the trade concerns triggered by Trump, and the market's risk aversion sentiment due to the global economic slowdown have become the key factors dominating the trend of oil prices.
The crude oil has corrected and broken below the support line, and there is a high probability that the bearish trend will enter a further acceleration stage. After the initial rise followed by a fall, the demarcation line between the bulls and the bears is around 59.4. If it comes under pressure again, it will indicate the continuation of the future trend. The moving average system is in a bearish arrangement, and it is suppressed by the 30-day moving average. Objectively, the short-term trend direction remains downward. Next week, consider taking short positions around 59.4 and expect further decline.

Analysis of the Market Trend for Next WeekThe price of crude oil futures declined on Friday, falling by approximately 1% during the session, giving back the gains brought about by a brief technical rebound. Bearish demand signals continued to dominate traders' sentiment. The price of crude oil is likely to drop by more than 7% this week, which reflects the growing concerns in the market about the weakening of global demand. Traders remain cautious ahead of the crucial OPEC+ meeting scheduled for May 5th. It is expected that some member states will push for an acceleration of production increases before June. There are reports that Saudi Arabia has hinted that it has no intention of supporting oil prices through a new round of production cuts, which has further intensified the downward pressure on oil prices.
In terms of demand, the market remains skeptical about potential trade negotiations. The Ministry of Commerce of China stated that it is evaluating the proposal put forward by the United States to resume tariff negotiations. Analysts said that the trade environment remains unstable and fraught with uncertainties.
Crude oil showed a trend of rising first and then falling today. At the same time, the oil price correction broke below the support line, and the bearish trend of oil prices is expected to enter a further acceleration stage. After the rise first and then the fall, the demarcation line between the bulls and bears of oil prices is around $59.3. If it is under pressure again, it will indicate the continuation of the future trend.

Summary of the Crude Oil Market This WeekThis week, the crude oil market witnessed a significant decline. Brent crude oil dropped by a cumulative 8.3%, and WTI crude oil fell by 7.5%. Both recorded their largest single-week declines since the end of March.👉👉👉
OPEC+ convened a production meeting ahead of schedule and planned to discuss the production increase plan for June. The market bets that the probability of a production increase is as high as 70%. Previously, OPEC+ unexpectedly announced in April that it would increase daily production by 411,000 barrels starting from May, which is three times the original planned increase. This move aimed to punish member states that had overproduced oil. If production is further increased in June, it will further intensify the supply pressure on the market.
Although the geopolitical tensions in the Middle East region have intensified, such as the postponement of the fourth round of nuclear negotiations between the United States and Iran, which has, to a certain extent, provided support for oil prices, judging from the overall market situation this week, this supporting effect has failed to offset the impact of increased supply and decreased demand.
Overall, this week, under the intertwined influence of factors such as increased supply, uncertain demand prospects, and changes in the geopolitical situation, the crude oil market showed a significant downward trend. The market's expectations for crude oil prices are rather pessimistic, and it is expected that crude oil prices will still face certain downward pressure in the coming period. However, if OPEC+ changes its production increase plan, or if there is an unexpected improvement in the global economy, crude oil prices may rebound.

The decisive day of major data (USOIL)
Yesterday, it was pointed out in the analysis circle: The support of 58 needs to be tested. Sure enough, buying at low levels continued to expand profits. The current price is 59.6. From the pressure analysis, the market is still affected by data that oversupply, and institutions will not reduce production in a short time. Therefore, oil prices will fall further,
The oil price broke through 59. Due to supply reasons, the market still has a downward range. 60-61 is a good choice to sell in succession.
tp58-57

USOIL trading alerts. Pressure and support.Oil also fell according to instructions. I just forgot to remind you. Sorry, but the profit is quite good. Sell short from 58.7. Then the lowest reached 56.34
But today in the New York market, USOIL rose again above 58. From a fundamental perspective. The market will continue to fall under pressure. But from the trend, we need to pay attention to the support of 58. If it does not fall today, it is likely to continue to fall based on Friday's trend. The pressure level near 59 needs to be paid attention to. In terms of operation, it is still mainly selling at high levels.
Always remind trading risks. So don't ignore this. If you don't know how to trade. Remember to wait and see. Don't trade blindly or gamble.
Many investor friends know that I have led some investors to create good profits for several consecutive days. If you don't know how to trade, remember to leave me a message and try it. Maybe your profit will double.

Can oil prices continue to be shorted? Of courseSaudi Arabia made a major strategic shift, willing to accept low oil prices and unwilling to cut supply.
Oil prices fell sharply as a result.
It is expected that oil prices will hit 55-56 in the short term, so the operation is still mainly shorting oil prices. Overcapacity.

Crude Oil | Support Level 62.700-61.700Crude Oil reached support level.
Take Profit : 71.750
Stop Loss : 60.680

Short on Oil/Back to 57$ SOONI believe we can continue the retest of previous major support level at 65-66$ and fibonacci 0.618. This major support will be flipped to resistance in my opinion. We can see a significant sell-off back towards the 57$ area and below from this location.
I will be looking to enter a short trade from the 0.618 region/66$ if there is a rejection.
My mid-term/end-of-year prediction for US OIL is between 45-50$ and possibly lower.
If you believe in the fundamentals and idea of this setup, feel free to follow and use it.
Not financial advice.


#USOIL 4HUSOIL (4H Timeframe) Analysis
Market Structure:
The chart is forming a classic Head and Shoulders pattern, which often signals a potential reversal from an uptrend to a downtrend. The left shoulder, head, and right shoulder are clearly visible, and the neckline is an important support zone to monitor.
Forecast:
A sell opportunity may be considered if the price breaks and closes below the neckline with confirmation. This breakdown could indicate the start of a bearish trend continuation.
Key Levels to Watch:
- Entry Zone: Look for a sell setup once the neckline is broken and retested as resistance.
- Risk Management:
- Stop Loss: Positioned above the right shoulder to minimize risk.
- Take Profit: Target nearby support zones or use a measured move technique based on the pattern's height.
Market Sentiment:
As long as the neckline holds and the breakdown is confirmed, bearish momentum is likely. A failure to break below the neckline would delay or invalidate the selling setup.

USOIL Opening Trends and Trading Strategies Next WeekTrend Analysis
As shown in the chart, in the 1 - hour time frame, USOIL is moving within an upward - trending channel 📈. This channel is defined by two trendlines, and the price is fluctuating upwards within it. Although there have been pullback trends during this period, the overall trend remains upward. This indicates that in the short term, the bullish forces are relatively dominant, driving the price to gradually climb 📈. However, the frequent price fluctuations also reflect a certain degree of game - playing between the bulls and bears in the market 🤺.
⚡⚡⚡ USOIL ⚡⚡⚡
🚀 Buy@61.5 - 62.0
🚀 TP 63.5 - 65.0
Accurate signals are updated every day 📈 If you encounter any problems during trading, these signals can serve as your reliable guide 🧭 Feel free to refer to them! I sincerely hope they'll be of great help to you 🌟

USOIL ANALYSISHello friends
Everything is clear on the chart for you, our probability is price growth to the specified areas.
Be sure to observe risk and capital management.
*Trade safely with us*

Daily Analysis of USOILChanges in Crude Oil Supply and Demand:
Demand Side: China imposes tariffs on U.S. crude oil, raising the import cost and reducing the import volume. The United States imposes tariffs on energy imports from Canada and Mexico, affecting the crude oil exports of these two countries to the U.S., reducing the demand for crude oil in the United States and putting pressure on the price of USOIL 😟.
Supply Side: After China reduces its imports of U.S. crude oil, it increases imports from other exporting countries, changing the global crude oil supply pattern and possibly strengthening the expectation of a supply surplus. The decrease in U.S. crude oil exports may lead to an increase in domestic inventory, exerting downward pressure on the price of USOIL 😣.
💰💰💰 USOIL💰💰💰
🎯 Sell@61.0 - 61.2
🎯 TP 59.5 - 59.5
Traders, if you're fond of this perspective or have your own insights regarding it, feel free to share in the comments. I'm really looking forward to reading your thoughts! 🤗
The accuracy rate of our daily signals has remained above 98% within a month! 📈 We sincerely welcome you to join our channel and share in the success with us! 🌟

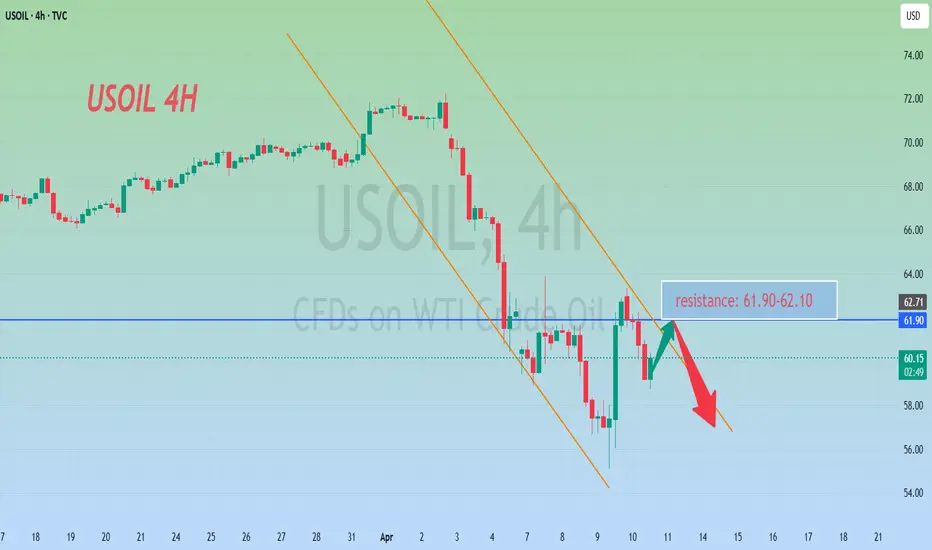
Choose to go short at high levels for crude oilThe price of crude oil is still fluctuating within a range and lacks clear directional momentum. The outlook remains bearish until it breaks through the $63.70 mark or there are clear factors stimulating demand. In the short term, the trend of oil prices is likely to remain confined to the current range. In terms of trading suggestions, it is advisable to mainly go short and go long as a supplement.
Oil trading strategy:
sell @ 61.90-62.10
sl 62.80
tp 61.20-61.00
If you approve of my analysis, you can give it a thumbs-up as support. If you have different opinions, you can leave your thoughts in the comments.

USOIL(UPDATE)Hello friends
Given the recent price growth, you can see that the price has weakened and has caused lower ceilings and floors to form. Now the range to which we expect the price to fall has been determined, which is also an FVG gap.
*Trade safely with us*

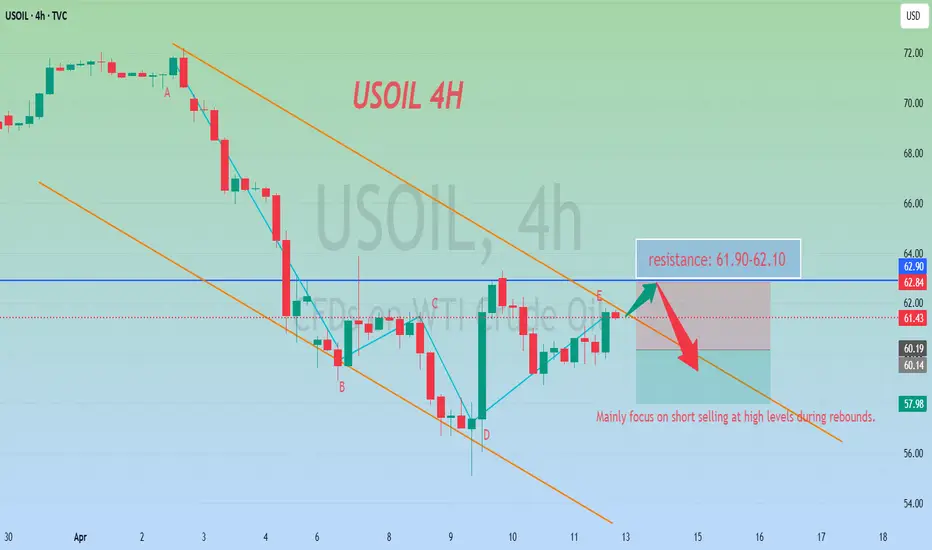
Strategic Analysis of Crude Oil for Next WeekBehind the current fluctuations in international oil prices lies the market's deep anxiety over the extreme uncertainty of global trade policies. Trump's "suspension + escalation" approach has, in the short term, stabilized relations with non - Chinese economies, but it has also dealt a blow to the global supply chain and energy consumption confidence.
In terms of the trading ideas for crude oil next week, it is recommended to mainly go short at high levels during rebounds and go long at low levels during pullbacks as a supplement. In the short term, pay attention to the resistance level in the range of 62.8 - 63.2. In the short term, focus on the support level in the range of 60.5 - 59.5.
Oil trading strategy:
sell @ 61.90-62.10
sl 62.80
tp 61.70-61.40
If you approve of my analysis, you can give it a thumbs-up as support. If you have different opinions, you can leave your thoughts in the comments.Thank you!
WTI Crude Oil Bearish Reversal Setup – Short from Resistance ZonEntry Point: 62.66 USD
Stop Loss: 65.26 USD
Target Point (Take Profit): 55.09 USD
Indicators:
EMA 200 (blue): 60.92 USD — long-term trend indicator
EMA 30 (red): 60.75 USD — short-term trend indicator
Analysis:
1. Bearish Setup:
The price is approaching a key resistance zone marked by the purple shaded area near 62.66.
The strategy is to short from this level, anticipating a drop to the 55.09 target area.
2. Risk/Reward:
Risk (SL - Entry): 65.26 - 62.66 = 2.60 USD
Reward (Entry - TP): 62.66 - 55.09 = 7.57 USD
Risk-to-reward ratio: ~1:2.9, which is favorable.
3. Support/Resistance Confirmation:
Multiple touches at the resistance zone (or

USOILUSOIL short term downside and then we will see some reaction below 60.
Disclosure: We are part of Trade Nation's Influencer program and receive a monthly fee for using their TradingView charts in our analysis.

"WTI / U.S Crude Oil" Energy Market Heist Plan (Scalping/Day)🌟Hi! Hola! Ola! Bonjour! Hallo! Marhaba!🌟
Dear Money Makers & Robbers, 🤑 💰💸✈️
Based on 🔥Thief Trading style technical and fundamental analysis🔥, here is our master plan to heist the "WTI / U.S Crude Oil" Energy Market. Please adhere to the strategy I've outlined in the chart, which emphasizes long entry. Our aim is to escape near the high-risk MA Zone. Risky level, overbought market, consolidation, trend reversal, trap at the level where traders and bearish robbers are stronger. 🏆💸"Take profit and treat yourself, traders. You deserve it!💪🏆🎉
Entry 📈 : "The vault is wide open! Swipe the Bullish loot at any price - the heist is on!
however I advise to Place buy limit orders within a 15 or 30 minute timeframe nearest or swing low or high level for pullback entries.
Stop Loss 🛑:
Thief SL placed at the Nearest / Swing low level Using the 30mins timeframe (58.000) Day trade basis.
SL is based on your risk of the trade, lot size and how many multiple orders you have to take.
🏴☠️Target 🎯: 66.000 (or) Escape Before the Target
🧲Scalpers, take note 👀 : only scalp on the Long side. If you have a lot of money, you can go straight away; if not, you can join swing traders and carry out the robbery plan. Use trailing SL to safeguard your money 💰.
💰💵💸🛢"WTI / U.S Crude Oil" Energy Market Heist Plan (Scalping/Day) is currently experiencing a bullishness,., driven by several key factors. 👇👇👇
📰🗞️Get & Read the Fundamental, Macro Economics, COT Report, Inventory and Storage Analysis, Seasonal Factors, Sentimental Outlook, Intermarket Analysis, Future trend targets & Overall Score... go ahead to check 👉👉👉🔗🔗
⚠️Trading Alert : News Releases and Position Management 📰 🗞️ 🚫🚏
As a reminder, news releases can have a significant impact on market prices and volatility. To minimize potential losses and protect your running positions,
we recommend the following:
Avoid taking new trades during news releases
Use trailing stop-loss orders to protect your running positions and lock in profits
💖Supporting our robbery plan 💥Hit the Boost Button💥 will enable us to effortlessly make and steal money 💰💵. Boost the strength of our robbery team. Every day in this market make money with ease by using the Thief Trading Style.🏆💪🤝❤️🎉🚀
I'll see you soon with another heist plan, so stay tuned 🤑🐱👤🤗🤩

USOIL Short Trade Idea – Targeting $55.05 from $61.00Entry Point: ~61.00 USD
Stop Loss (SL): 64.77 USD
Target (TP): 55.05 USD
Risk/Reward Ratio: Favorable
Risk: ~3.77 USD
Reward: ~5.95 USD
Approximate R/R ratio: 1:1.58
🧠 Strategy Insight
Trend Context:
Prior to the entry zone, price shows a strong downtrend.
The price retraced upward into a resistance zone (highlighted in purple).
The setup suggests a short position anticipating rejection from this zone.
Indicators:
Moving Averages (red & blue):
Likely 50 EMA and 200 EMA showing bearish alignment (price mostly under both).
Resistance Zone:
The purple shaded region represents a supply zone, where price previously reversed.
Entry Zone Analysis:
Entry just below a recent rejection candle.
It's a conservative spot to catch a move back in the direction of the dominant trend.
Target Zone (55.05):
Likely based on a recent support level or demand zone from earlier price action.
Matches previous lows.
🔁 Possible Scenarios
✅ Bearish Scenario (Ideal Outcome):
Price gets rejected from the resistance zone and continues the downtrend toward the target at 55.05.
❌ Bullish Scenario (Risk):
Price breaks above 61.00 and continues toward 64.77, invalidating the short setup.

Analysis of Crude Oil StrategiesCrude oil bottomed out and rebounded sharply on Wednesday. This was also due to the impact of the tariff war, which is currently dominating the trend of the financial market. However, on Thursday, it didn't continue to rise. Instead, it fell successively and retraced. Pay attention to going long at the support level of 58.20 below, and consider going short at the resistance level of 61.90 above.
Oil trading strategy:
sell @ 61.90-62.10
sl 62.80
tp 60.95-61.10
If you approve of my analysis, you can give it a thumbs-up as support. If you have different opinions, you can leave your thoughts in the comments.Thank you!