USOIL:It's time to go shortRecently, the WTI crude oil has been on a continuous upward trend with fluctuations. The current intraday price has reached a three - week high. At present, the long - position sentiment in the market is greatly influenced by the fundamental news, mainly due to the intensified U.S. sanctions on Iranian energy and the ineffective implementation of the 30 - day cease - fire agreement between Russia and Ukraine.
Today's trading strategy: Focus on shorting at high levels. Currently, the price has a firm support at $69. Observe whether it can reach the resistance range of $69.5 again. If it breaks through the upper level, look at the important psychological resistance level of $70. Select to short again within the range.
USOIL Trading Strategy:
Sell@69.5-70
TP:68-67
Get daily trading signals that ensure continuous profits! With an astonishing 90% accuracy rate, I'm the record - holder of an 800% monthly return. Click the link below the article to obtain accurate signals now!
Usoilanalysis

USOil:When to short at high levels?During the evening session yesterday, the price of crude oil surged again, reaching the resistance level of 69.5 per barrel in the session. However, after encountering resistance, part of the bullish momentum took profits and fled the market, causing the price to decline slightly to the support level of 69 per barrel without further drops.
After today's opening, the bullish momentum is obviously insufficient, and the price has not risen further, showing a downward extension trend.
Today's trading strategy: Focus on taking short positions at relatively high levels. Currently, the support at 69 per barrel is relatively solid. Observe whether the price can reach the resistance range of 69.5 per barrel again. If it breaks through upwards, look at the important psychological resistance level of 70 per barrel. Choose to take short positions again within the range of 69.5 - 70 per barrel, with the target price at $68 per barrel. Participate with a small position.
USOIL Trading Strategy:
Sell@68.5-69
TP:68-67
Get daily trading signals that ensure continuous profits! With an astonishing 90% accuracy rate, I'm the record - holder of an 800% monthly return. Click the link below the article to obtain accurate signals now!

USOIL:Bide one's timeThis week, we've analyzed the reasons behind the short - term strong performance of crude oil. We specifically remind you to pay attention to the price movements within the range of $68.5 - $69.5.
Once again, we advise you to observe more and trade less.
We share various trading signals every day with over 90% accuracy
Fans who follow us can get high rewards every day
If you want stable income,You can follow the link below this article
USOIL: Rally, Resistance, and Technical ReversalThe recent trend of USOIL has been continuously rising in a volatile manner, and the current intraday price has reached a three - week high.
Currently, the bullish sentiment in the market is greatly influenced by fundamental news, mainly due to the combined effects of the United States increasing sanctions on Iran's energy and the ineffective and substantive implementation of the 30 - day cease - fire agreement between Russia and Ukraine.
Analyzing the short - term trend from the one - hour chart of USOIL, during the US trading session last night, the crude oil price surged again, hitting the resistance of $69.5 in the market. However, after encountering resistance, part of the bullish momentum took profits and fled, and the price slightly retreated to the support of $69 without further decline.
After today's opening, the bullish momentum was obviously insufficient, and the price did not rise further. The upper track of the Bollinger Bands extended downward, exerting pressure. The moving average of the Macd indicator formed a cross at a high level and has a downward extension trend, and the momentum column began to release downward.
USOIL Trading strategy
Sell@69.5-69
tp:68-67.5
I will share trading signals every day. All the signals have been accurate for a whole month in a row. If you also need them, please click on the link below the article to obtain them.

OIL Today's strategyYesterday, prices were affected by tightening expectations on the supply side, geopolitics and other factors, and the trend was strong, breaking through $69.
Today, it is fluctuating above $69, and another wave of gains is expected. At the same time, we need to pay close attention to the situation in the $68.5-69.5 area and adjust it at any time
usoil buy@68.3-68.7
tp:69.5-70
We share various trading signals every day with over 90% accuracy
Fans who follow us can get high rewards every day
If you want stable income, you can contact me

Technical Analysis for WTI Crude Oil (Daily Chart)Current Price Action
WTI crude oil is trading at $70.51, showing a recovery from the Liquidity Pool zone near the $66.00–$67.00 range. The price has approached a key resistance level around $71.00, which aligns with a previous area of rejection in February 2025. The chart suggests a potential pullback from this resistance level, as indicated by the projected downward arrow.
Support Levels:
$66.00–$67.00: This zone represents a significant liquidity pool where buyers have consistently stepped in, leading to a reversal in price.
$65.00: A psychological support level and the lower boundary of the liquidity pool.
Resistance Levels:
$71.00: A critical resistance level that has acted as a ceiling for price action in recent months.
$73.00: The next major resistance level if the price breaks above $71.00.
Volume Profile Analysis
The Volume Profile on the right side of the chart shows significant trading activity between $70.00 and $71.00, indicating strong resistance in this area. Above $71.00, the volume thins out, suggesting that a breakout could lead to a rapid move toward $73.00.
Indicators and Momentum
Trend: The price is recovering from a bearish trend but remains below the highs of $80.00 seen earlier in the chart. The current move appears to be a retracement within a broader downtrend.
Potential Pullback: The projected arrow on the chart suggests a possible rejection at $71.00, with a pullback toward the $68.00–$69.00 range.
Market Sentiment
The chart reflects cautious optimism, with buyers stepping in at lower levels but facing strong resistance at $71.00. A breakout above this level could signal a shift in sentiment, while a rejection would confirm the continuation of the bearish trend.
Conclusion
WTI crude oil is at a critical juncture, testing the $71.00 resistance level. Traders should watch for a breakout above $71.00, which could target $73.00 and higher. Conversely, a rejection at this level may lead to a pullback toward the $68.00–$67.00 support zone. The liquidity pool near $66.00 remains a key area for buyers to defend in the event of further downside.

USOil:Wait for rebound to shortThe market movement on Friday was not significant. The intraday high was reached at the opening in the morning, hitting a peak of $68.65, while the low was at $67.65. The maximum intraday fluctuation was just $1, and the price trend showed a shallow V - shape. Considering that Trump is bound to end the Russia - Ukraine conflict over the weekend, crude oil will likely remain bearish in the short term. Therefore, today's market is generally expected to rise first and then decline under pressure again.
USOIL Trading Strategy:
Sell@68.5-69
TP:67-66
Get daily trading signals that ensure continuous profits! With an astonishing 90% accuracy rate, I'm the record - holder of an 800% monthly return. Click the link below the article to obtain accurate signals now!

USOIL Trading Strategy: Secrets to Consistent ProfitsThe situation in the crude oil market has been complex recently.
On the supply side, it is affected by the uncertainty of the OPEC+ production increase plan, the recovery of U.S. shale oil production, and the potential supply risks in Iran.
On the demand side, due to the weak momentum of global economic recovery and trade disputes, demand has been suppressed. However, the rising market expectations of the Federal Reserve's interest rate cut may boost crude oil demand if the loose monetary policy is implemented.
In terms of inventory, although U.S. crude oil inventories have decreased slightly recently, there is still pressure for inventory accumulation, and the decline in the geopolitical risk premium has weakened the support for oil prices.
In the short - term, the crude oil price was blocked and retraced at the upper edge of the trading range. Eventually, it rebounded and recovered, yet failed to break through to a new high. The bullish and bearish forces are locked in a stalemate. Objectively, the short - term trend direction remains unclear, while subjectively, it is biased upward. It is expected that crude oil will break through the resistance at the upper edge of the range and continue to rise today, though with limited upside potential.
USOIL Trading Strategy
sell@68.5-69
tp:67-66.5
I will share trading signals every day. All the signals have been accurate for a whole month in a row. If you also need them, please click on the link below the article to obtain them.

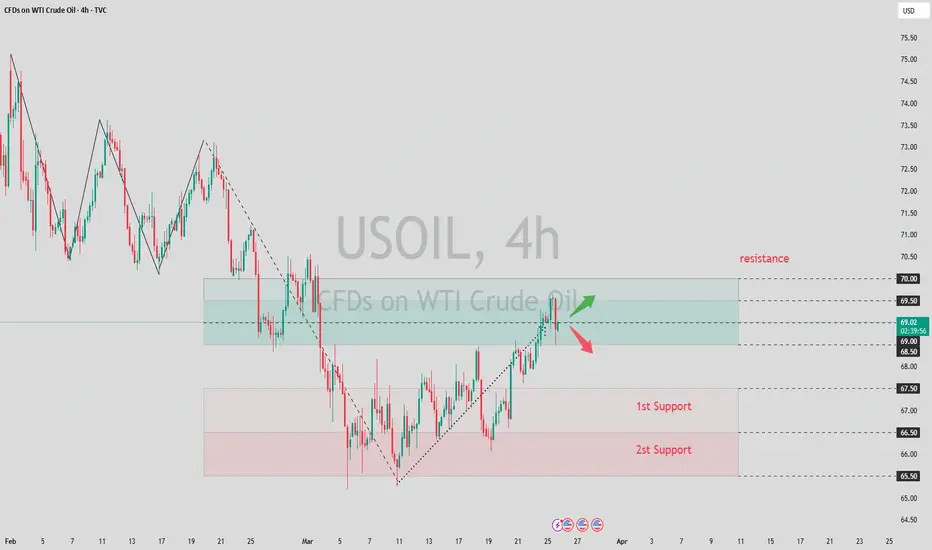
USOIL Today's analysisUSOIL is at 68.335. Technically, I'm bearish short - term.
The strong resistance at 69.000 has repeatedly blocked upward moves. Heavy selling occurs near this level, making it a firm price cap.
There are two key supports. 67.000 has halted drops before. If breached, 66.30, a crucial level from past down - trends, comes into play.
With the price below 69.000, facing downward pressure and bearish sentiment, USOIL may decline soon. There's no strong bullish factor to push it higher. The downward - sloping momentum and proximity to supports suggest a downward path. Traders should be cautious and might consider short - term short positions, with risk control, as the price may test 67.000 first, then 66.300 if the bearish trend persists.
💎💎💎 USOIL 💎💎💎
🎁 Sell@68.500 - 69.000
🎁 TP 67.000 - 66.300
The market has been extremely volatile lately. If you can't figure out the market's direction, you'll only be a cash dispenser for others. If you also want to succeed,Follow the link below to get my daily strategy updates

WTI Price Analysis: Key Insights for Next Week Trading DecisionOil prices are showing signs of recovery after a strong bearish move, with $68.00 as a key level that will play a significant role in guiding our trading decisions for the new week.
📌 Key Technical Outlook:
🔹 Oil is currently trading within an ascending channel on the 4H timeframe.
🔹 I’ll be watching for a breakout/retest of the channel resistance and $68.50 for buying opportunities.
🔹 If selling pressure remains below the resistance line of the channel and the $68.00 key level, I will be considering selling opportunities.
📌 Major Market Drivers:
🔹 US Sanctions on Iran: The US Treasury imposed new sanctions targeting entities involved in supplying Iranian crude oil to China. Analysts expect a 1 million bpd drop in Iranian exports, which could support prices.
🔹 OPEC+ Production Cuts: A new plan will see seven member nations cut production by 189,000–435,000 bpd per month until June 2026.
🔹 Geopolitical Risks: Ongoing tensions in the Middle East & the Russia-Ukraine war continue to add a risk premium to oil prices.
📅 Key Economic Events on Our Radar Next Week:
🛢 Tuesday: API Crude Oil Stock Report – Offers insight into US oil inventory levels.
🛢 Wednesday: EIA Crude Oil Inventories Report – A key supply indicator affecting price movements.
🗓 Tuesday: US S&P Global PMI – Important for economic sentiment and demand expectations.
🗓 Thursday: US GDP (Q4 Final) – Provides clues on economic growth and potential impact on oil demand.
🗓 Friday: US Core PCE Index – The Fed’s preferred inflation measure, critical for policy direction.
Oil remains bullish in the short term, but I’ll be monitoring price action closely at $68.00 and $68.50 for trade setups. We’ll break it all down in Forex Morning Mastery tomorrow—stay tuned! 🔥📈

USOil The Final dealBased on current market conditions, we predict an upward movement for USOil.
The first resistance level is set at 69.000. This level has proven to be a significant hurdle in previous price actions, with selling pressure often emerging as the price approaches it.
However, given the current positive momentum, there's a strong likelihood of breaking through this resistance.
On the downside, the primary support level stands at 67.000. This level has been tested multiple times and has held firm, acting as a floor for the price.
Below this, we have a second support at 66.500. This secondary support is crucial as it provides an additional buffer against significant price drops. If the price manages to stay above the 67.000 support, the upward trend is likely to continue towards the 69.000 resistance and potentially beyond.
💎💎💎USOil 💎💎💎
🎁 Buy@67.500 - 67.700
🎁 TP 68.800 - 69.000
The market has been extremely volatile lately. If you can't figure out the market's direction, you'll only be a cash dispenser for others. If you also want to succeed,Follow the link below to get my daily strategy updates

USOIL Market Analysis and Tactical InsightsCurrently, USOIL is trading around $67 per barrel.
On the supply side, while OPEC+ plans to increase production, ongoing geopolitical tensions in the Middle East are adding supply uncertainties.
On the demand side, U.S. fuel demand remains resilient, but the subdued global economic outlook may limit crude oil demand growth.
Technically, the daily chart shows moving averages in a bearish alignment, though the short - term RSI suggests relative market strength.
If the price rebounds and faces resistance near $67.9, consider a light short with a target of $66.
If the price stabilizes around $66, a long could be considered, with a target of $67.
USOIL Trading Strategy
sell@67.5-68
tp:66
buy@66
tp:67
I will share trading signals daily. All signals have been consistently accurate for an entire month. If you need them, you can check my profile for more information.

OIL Today's strategyCurrently, crude oil prices are fluctuating near the resistance level. Recently, the increase in US crude oil inventories has affected the supply dynamics and exerted certain pressure on oil prices. However, overall, the geopolitical tensions and supply risks have a relatively significant supporting effect on oil prices at present.
OIL Today's strategy
sell@68.5-68.8
buy:67.2-67.6
There are risks in trading. If you are not sure about the timing, it is best to leave me a message. This will better confirm the timing of the transaction, It can also better expand profits and reduce losses

US-OIL Long Buy due to lower SupportHello Traders
In This Chart XTIUSD HOURLY Forex Forecast By FOREX PLANET
today XTIUSD analysis 👆
🟢This Chart includes_ (XTIUSD market update)
🟢What is The Next Opportunity on XTIUSD Market
🟢how to Enter to the Valid Entry With Assurance Profit
This CHART is For Trader's that Want to Improve Their Technical Analysis Skills and Their Trading By Understanding How To Analyze The Market Using Multiple Timeframes and Understanding The Bigger Picture on the Charts

USOIL.. Near resistance? hold or not??#USOIL.. market just near to his current resistance area that is around 67.52-55
keep close that area and if market hold it in that case we can expect a drop from here.
keep close and stay sharp..
good luck
trade wisely

USOIL Strategy AnalysisInternational crude oil prices have been trending sideways-to-downward recently. As of March 19, WTI crude oil was priced at $66.58/barrel, marking a cumulative decline of over 7% since the beginning of the year. The current core market contradiction focuses on the dual pressures of loose supply expectations and divergent demand prospects.
Oil trading strategy:
sell @ 68.2
buy @ 66
If you are currently unsatisfied with your crude oil trading performance and need daily accurate trading signals, you can visit my profile for free strategy updates every day.

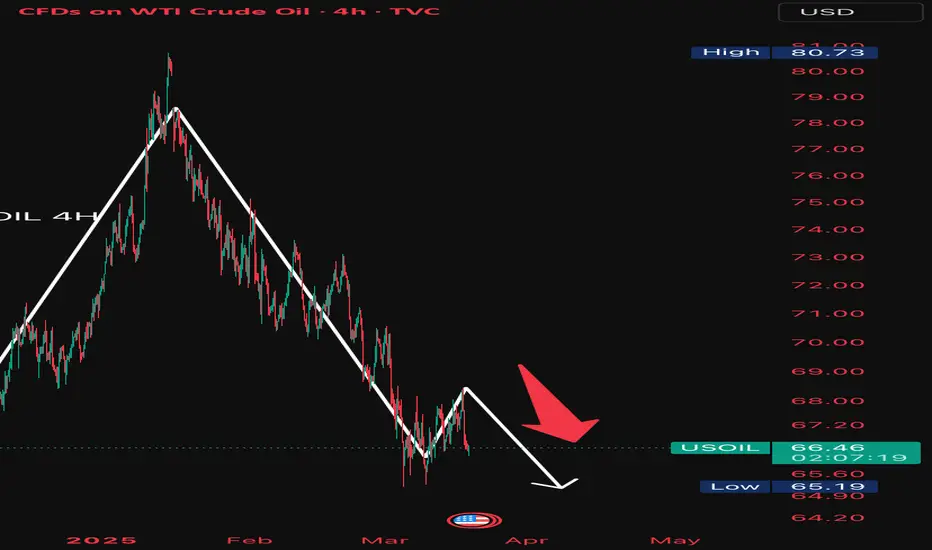
USOil: The trading strategy is to continue shortingYesterday, crude oil prices peaked and then witnessed a sharp decline, directly plunging through the upward gap that opened at the beginning of the week.
The current market situation is at the initial stage of a downtrend. It is projected that after rebounding to the range of 67.00 - 67.80, the downward movement will resume. Moreover, the strength of today's rebound indicates relatively feeble upward momentum, and market sentiment leans towards caution.
Consequently, today's trading strategy will mainly focus on shorting on rebounds. Traders should wait for the market to rebound to key resistance levels before entering the market.
USOIL Trading Strategy:
Sell@67.7-68.3
TP:66-65
I always firmly believe that profit is the sole criterion for measuring strength. I will share accurate trading signals every day. Follow my lead and wealth will surely come rolling in. Click on my profile for your guide.
USOILHello friends
Due to the price falling in the identified support area, buyers were able to support the price, but given the weakness of the trend we are witnessing, it seems that sellers have more power...
Now, for the price to rise, the identified resistance must be broken, and for the price to fall, if the support is broken, the price will continue to fall.
*Trade safely with us*

Next Week's Trading Blueprint for USOILThis week, U.S. crude oil closed at $67.18, with a weekly increase of 0.2%. Next week, there is sufficient upward momentum. The United States has tightened sanctions on Iran, and there is a risk of supply contraction. Moreover, the decline in U.S. gasoline inventories far exceeds expectations, indicating strong demand. Technically, if the key resistance level of $69.00 is breached, an upward space will be opened, and the bullish forces are expected to push up the price of U.S. crude oil.
USOIL Trading Strategy for Next Week:
buy@ 65-66.5
tp:69-70
I firmly believe realized profit and a high win - rate are the best measures of trading skill. Daily, I share highly precise trading signals. These include clear entry points, stop - loss levels for risk control, and profit - taking targets from in - depth analysis. Follow me for big financial market returns. Click my profile for a trading guide on trends, strategies, and risk management.

Weekly Market Forecast WTI CRUDE OIL: Bearish! Wait For SellsThis forecast is for the week of March 17 - 21st.
WTI Crude Oil is in consolidation, but forming a wedge pattern. As the market condenses, we no watch out for a breakout that could go in either direction. But if we take note of the Weekly bearish FVG that formed last week, we simply wait for price to sting into it and use it to move lower. The market is weak, and has been trending down for over two months now. Using the trend and the -FVG, the higher probability is for price to continue lower, as long as the -FVG holds.
Check the comments section below for updates regarding this analysis throughout the week.
Enjoy!
May profits be upon you.
Leave any questions or comments in the comment section.
I appreciate any feedback from my viewers!
Like and/or subscribe if you want more accurate analysis.
Thank you so much!
Disclaimer:
I do not provide personal investment advice and I am not a qualified licensed investment advisor.
All information found here, including any ideas, opinions, views, predictions, forecasts, commentaries, suggestions, expressed or implied herein, are for informational, entertainment or educational purposes only and should not be construed as personal investment advice. While the information provided is believed to be accurate, it may include errors or inaccuracies.
I will not and cannot be held liable for any actions you take as a result of anything you read here.
Conduct your own due diligence, or consult a licensed financial advisor or broker before making any and all investment decisions. Any investments, trades, speculations, or decisions made on the basis of any information found on this channel, expressed or implied herein, are committed at your own risk, financial or otherwise.

USOIL Analysis of TodayThe global economic situation has a significant impact on the demand for crude oil.
During periods of economic prosperity, industrial production and transportation activities are frequent, leading to an increase in the demand for crude oil, which in turn drives up the price of USOIL.
For example, during the period of rapid development of emerging economies, the demand for energy was robust. When there is an economic recession, the demand decreases, and the price may drop. Just like after the global financial crisis in 2008, the demand for crude oil plummeted sharply, and the price also crashed accordingly. In terms of supply, the changes in production output of major oil-producing countries are of vital importance.
The adjustment of production capacity and production disruptions in major oil-producing countries such as the United States, Saudi Arabia, and Russia will all affect the global crude oil supply. For instance, the development of the shale oil industry in the United States has significantly increased the country's crude oil production, having a major impact on the global crude oil market supply pattern.
🎁 Buy@66.90 - 67.00
🎁 SL 66.80
🎁 TP 67.15 - 67.20
Traders, if you liked this idea or if you have your own opinion about it, write in the comments. I will be glad
If you also aspire to achieve financial freedom,Follow the link below to get my daily strategy updates

USOIL:The latest trading strategyThe price of WTI crude oil futures has risen slightly, and the market is currently in the process of bottom - building.
The price briefly broke through last week's high of $67.94, reaching an intraday high of $68.37 before pulling back. The market remains in a "sell - on - rally" mode.
After the higher opening, there is a probability that the crude oil price will stabilize at a lower level. For the subsequent trading strategy, short - selling is worth considering.
USOIL Trading Strategy:
Sell@67.7-68.3
TP:66-65

#USOIL/WTI 1 DAYUSOIL/WTI (1D Timeframe) Analysis
Market Structure:
The price is currently trading near a key support level, which has previously acted as a strong demand zone. Buyers may step in at this level, leading to a potential reversal or bounce.
Forecast:
A buy opportunity is expected if the price holds above the support level and shows signs of bullish momentum. Confirmation through price action, such as bullish candlestick patterns or increased volume, can strengthen the trade setup.
Key Levels to Watch:
- Entry Zone: Consider buying near the support level if the price confirms a bounce.
- Risk Management:
- Stop Loss: Placed below the support level to manage downside risk.
- Take Profit: Target resistance levels or previous swing highs for potential gains.
Market Sentiment:
If the support level holds, the market sentiment may shift towards the upside, leading to a potential bullish move. However, a breakdown below support could indicate further weakness, requiring reassessment.
