WTI CRUDE OIL TRADE SETUP : BREAKOUT OR BREAKDOWN ?📊 Key Observations:
🔹 Trend:
🚀 Strong bullish move followed by a correction 📉
🔻 Price is testing a support zone
🔹 Pattern Formation:
📏 Descending channel or flag-like structure
📍 Price is near a breakout point
🔹 Trade Setup:
✅ Entry Zone: Around 70.77
🛑 Stop Loss: 70.44 - 70.49 (Risk limit ❌)
🎯 Target Point: 71.80 (Profit zone ✅)
🔹 Indicators & Confirmation:
📊 DEMA (9) at 70.92 → Price is slightly below short-term momentum
🔥 A breakout above resistance could confirm a bullish move 🚀
📌 Conclusion:
✅ If price breaks the trendline upwards → Buy 📈 aiming for 71.80 🎯
❌ If support at 70.44-70.49 fails → More downside possible ⚠️
🚀 Watch for volume & candlestick confirmation before entering!
Usoilforecast

Crude oil meets resistance at high levels, it is time to go shorAlthough we have used the daily line to re-count the waves, and explained that the current rising market is in the 2nd wave rebound of the daily line, which is the sub-wave c of wave 2, the market is still in a bearish trend in the daily line. After the market has completed this wave of 2nd wave rebound and adjustment, it will continue to fall by 3 waves. In the 4-hour market, the current market has not risen above 72.90 US dollars. We can still regard it as a rebound of 3-2 waves, or a rebound of the main wave 4. The main decline wave 1 of 4 hours fell from 76.57 US dollars to 69.80 US dollars, a drop of 6.77 US dollars, and the current 4-hour main decline wave 3 fell from 72.90 US dollars to 64. .85 dollars fell to 8.05 dollars. Why can it be either 3-2 waves or 4 waves? Because the current 8.05 dollars is larger than the decline of the main decline wave 1, it can be regarded as 3 waves, and the current rebound is very strong, so it can be regarded as 4 waves, but I think from the perspective of the main decline wave 3 in 4 hours, the decline should be more than that, it should be greater than 10 US dollars, so it can also be regarded as a rebound of 3-2 waves. The key is whether this wave of rise will break 72.90 US dollars. If it breaks, it will be a sub-wave of the main decline wave 1 in 4 hours. Therefore, our trading ideas today do not have a main direction. The market will make orders when the strategy reaches that first.
Today's crude oil recommendations: 1. Short at 72.65 US dollars, stop loss 30 points, and take profit 70.60 US dollars.

USOIL BUY!!!Hello friends
Given that the price has reached good support, we now see that the price has made a good comeback...
We can enter the trade with capital and risk management and move towards the specified goals.
*Trade safely with us*

USOil Key Resistance Hit: Is WTI Crude Due for a Correction?WTI crude oil appears overextended after a strong bullish rally, trading into a key resistance level amid heightened geopolitical tensions and market volatility. The current price action suggests a potential retracement, with equilibrium around the 50% Fibonacci level being a likely target for correction 📉. Given the reactionary nature of the market, traders should remain cautious as political developments could drive further instability ⚠️. While the technical setup supports a pullback, external factors may disrupt this scenario, so risk management is essential. 📊
Disclaimer: This analysis is for informational purposes only and does not constitute financial advice. Always conduct your own research before making trading decisions.

What to do if crude oil rises? The latest layout strategyCrude oil futures showed volatility during the day on Monday. Prices rose sharply in early European trading, breaking through the 70.00 integer mark and then falling back, but still fluctuating at a relatively high level. Oil prices rose slightly after countries importing Russian oil imposed tariffs of 25% to 50%. Brent crude oil futures climbed and WTI also rose. However, gains were limited as traders questioned the seriousness of the proposal. ING Group pointed out that the market was "fatigued" by Washington's tariff rhetoric, indicating that the crude oil market was unlikely to react strongly without concrete actions.
Crude oil plan: Crude oil is recommended to retreat to 70.0-69.5, with a target of 71.0-72.0 and a stop loss of 0.5 US dollars.
If oil prices break below $69.0/barrel, this will stop the expected bullish trend and push oil prices to regain the main trend of volatility.
It is expected that today's oil prices will trade between the support level of $69.0/barrel and the resistance level of $72.0/barrel.

USOIL: Next Week's Blueprint for Profit Amid VolatilityDuring the US trading session on Friday, March 28th, international oil prices fluctuated slightly and declined. However, both Brent crude oil and WTI crude oil remained firmly near their one - month highs and were projected to register "three consecutive weekly gains" on the weekly chart. The ongoing tug - of - war between the supply tightness instigated by geopolitical unrest and the latent concerns regarding an economic downturn has placed oil prices in a volatile state of being "caught between a rock and a hard place".
From the perspective of the USOIL daily chart, following the medium - term trend's breach of the lower edge of the range, it has predominantly fluctuated around lower levels. The oil price has experienced consecutive short - term increases, breaking through the suppression of the moving average system, and the medium - term objective trend has entered a transition phase. Nevertheless, in terms of kinetic energy, neither the bulls nor the bears have demonstrated a clear - cut inclination to overpower the other. It is anticipated that the medium - term trend will persist in its volatile rhythm for a while, awaiting the establishment of a distinct trend direction.
The short - term (1H) trend of USOIL has not continuously set new highs and has exhibited a pattern of high - level consolidation. The short - term objective trend remains upward. In the early trading session, the oil price underwent a narrow adjustment at a high level, presenting an overall secondary rhythm with a sound internal rhythm. The fundamental objective trend during the week has been upward in sync, and it is highly likely that the short - term trend of USOIL will continue its upward trajectory next week.
USOIL
buy@68-68.5
tp:69.5-70
I will share trading signals every day. All the signals have been accurate for a whole month in a row. If you also need them, please click on the link below the article to obtain them.

Tariffs can have a significant impact on USOILThe expiration of the extended US import tariffs on Canada and Mexico next Wednesday may impact USOIL:
Supply : Tariffs could disrupt US-Canada crude oil trade, cutting US supply and raising prices. Trade pattern changes may also affect global supply and USOIL prices.
Demand : Tariffs may slow economic growth, reducing crude oil demand and exerting downward price pressure. Uncertainty dampens consumer and business confidence, further suppressing demand.
Market Sentiment & Finance : Policy changes heighten uncertainty, making investors cautious and increasing USOIL price volatility. Capital may flow out, pressuring prices, but portfolio adjustments for hedging could support them.
Also, OPEC and non-OPEC plans to end production cuts in April may boost global supply and lower USOIL prices.

USOIL Strategy DiscussionThis week, we've analyzed the reasons behind the short - term strong performance of crude oil. We specifically remind you to pay attention to the price movements within the range of $68.5 - $69.5.
Once again, we advise you to observe more and trade less.
We share various trading signals every day with over 90% accuracy
Fans who follow us can get high rewards every day
If you want stable income,You can follow the link below this article

USOIL:Bide one's timeThis week, we've analyzed the reasons behind the short - term strong performance of crude oil. We specifically remind you to pay attention to the price movements within the range of $68.5 - $69.5.
Once again, we advise you to observe more and trade less.
We share various trading signals every day with over 90% accuracy
Fans who follow us can get high rewards every day
If you want stable income,You can follow the link below this article
OIL Today's strategyYesterday, prices were affected by tightening expectations on the supply side, geopolitics and other factors, and the trend was strong, breaking through $69.
Today, it is fluctuating above $69, and another wave of gains is expected. At the same time, we need to pay close attention to the situation in the $68.5-69.5 area and adjust it at any time
usoil buy@68.3-68.7
tp:69.5-70
We share various trading signals every day with over 90% accuracy
Fans who follow us can get high rewards every day
If you want stable income, you can contact me

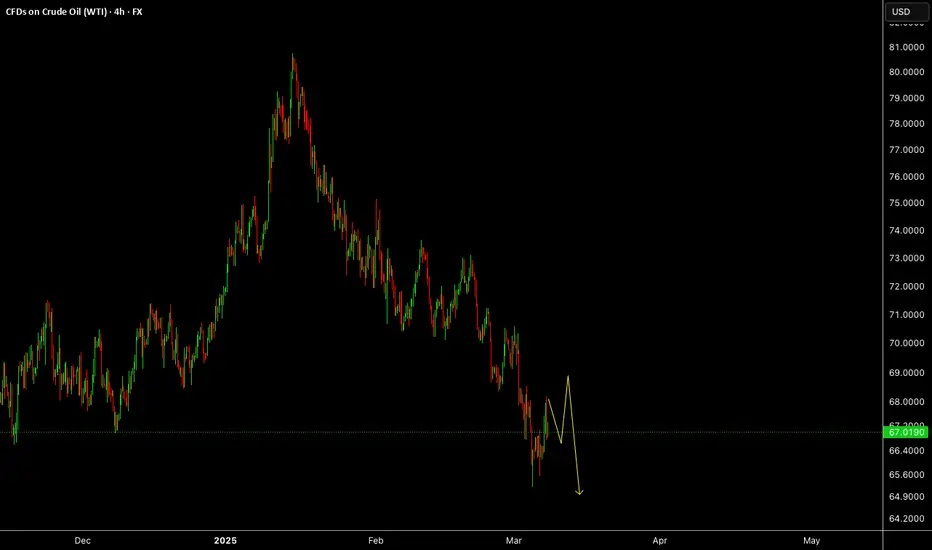
Technical Analysis for WTI Crude Oil (Daily Chart)Current Price Action
WTI crude oil is trading at $70.51, showing a recovery from the Liquidity Pool zone near the $66.00–$67.00 range. The price has approached a key resistance level around $71.00, which aligns with a previous area of rejection in February 2025. The chart suggests a potential pullback from this resistance level, as indicated by the projected downward arrow.
Support Levels:
$66.00–$67.00: This zone represents a significant liquidity pool where buyers have consistently stepped in, leading to a reversal in price.
$65.00: A psychological support level and the lower boundary of the liquidity pool.
Resistance Levels:
$71.00: A critical resistance level that has acted as a ceiling for price action in recent months.
$73.00: The next major resistance level if the price breaks above $71.00.
Volume Profile Analysis
The Volume Profile on the right side of the chart shows significant trading activity between $70.00 and $71.00, indicating strong resistance in this area. Above $71.00, the volume thins out, suggesting that a breakout could lead to a rapid move toward $73.00.
Indicators and Momentum
Trend: The price is recovering from a bearish trend but remains below the highs of $80.00 seen earlier in the chart. The current move appears to be a retracement within a broader downtrend.
Potential Pullback: The projected arrow on the chart suggests a possible rejection at $71.00, with a pullback toward the $68.00–$69.00 range.
Market Sentiment
The chart reflects cautious optimism, with buyers stepping in at lower levels but facing strong resistance at $71.00. A breakout above this level could signal a shift in sentiment, while a rejection would confirm the continuation of the bearish trend.
Conclusion
WTI crude oil is at a critical juncture, testing the $71.00 resistance level. Traders should watch for a breakout above $71.00, which could target $73.00 and higher. Conversely, a rejection at this level may lead to a pullback toward the $68.00–$67.00 support zone. The liquidity pool near $66.00 remains a key area for buyers to defend in the event of further downside.

WTI Price Analysis: Key Insights for Next Week Trading DecisionOil prices are showing signs of recovery after a strong bearish move, with $68.00 as a key level that will play a significant role in guiding our trading decisions for the new week.
📌 Key Technical Outlook:
🔹 Oil is currently trading within an ascending channel on the 4H timeframe.
🔹 I’ll be watching for a breakout/retest of the channel resistance and $68.50 for buying opportunities.
🔹 If selling pressure remains below the resistance line of the channel and the $68.00 key level, I will be considering selling opportunities.
📌 Major Market Drivers:
🔹 US Sanctions on Iran: The US Treasury imposed new sanctions targeting entities involved in supplying Iranian crude oil to China. Analysts expect a 1 million bpd drop in Iranian exports, which could support prices.
🔹 OPEC+ Production Cuts: A new plan will see seven member nations cut production by 189,000–435,000 bpd per month until June 2026.
🔹 Geopolitical Risks: Ongoing tensions in the Middle East & the Russia-Ukraine war continue to add a risk premium to oil prices.
📅 Key Economic Events on Our Radar Next Week:
🛢 Tuesday: API Crude Oil Stock Report – Offers insight into US oil inventory levels.
🛢 Wednesday: EIA Crude Oil Inventories Report – A key supply indicator affecting price movements.
🗓 Tuesday: US S&P Global PMI – Important for economic sentiment and demand expectations.
🗓 Thursday: US GDP (Q4 Final) – Provides clues on economic growth and potential impact on oil demand.
🗓 Friday: US Core PCE Index – The Fed’s preferred inflation measure, critical for policy direction.
Oil remains bullish in the short term, but I’ll be monitoring price action closely at $68.00 and $68.50 for trade setups. We’ll break it all down in Forex Morning Mastery tomorrow—stay tuned! 🔥📈

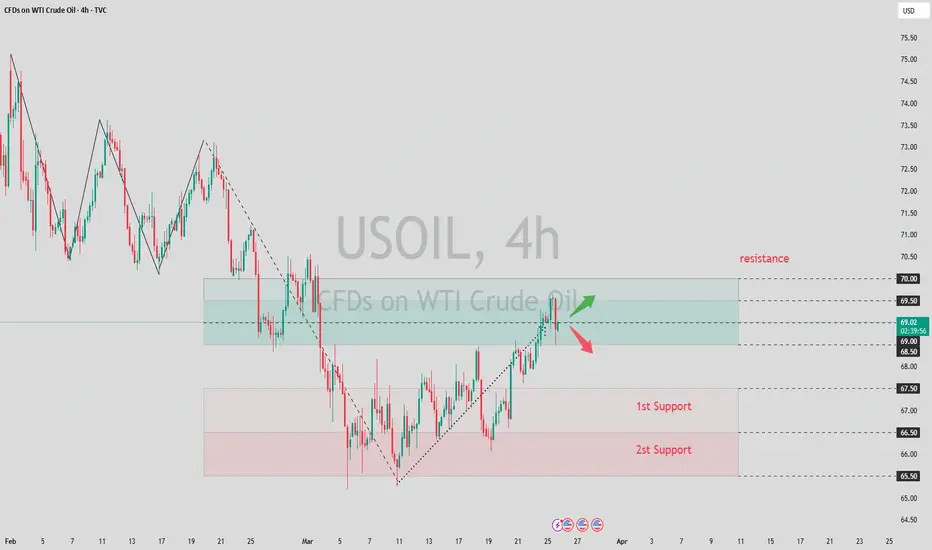
OIL Today's strategyCurrently, crude oil prices are fluctuating near the resistance level. Recently, the increase in US crude oil inventories has affected the supply dynamics and exerted certain pressure on oil prices. However, overall, the geopolitical tensions and supply risks have a relatively significant supporting effect on oil prices at present.
OIL Today's strategy
sell@68.5-68.8
buy:67.2-67.6
There are risks in trading. If you are not sure about the timing, it is best to leave me a message. This will better confirm the timing of the transaction, It can also better expand profits and reduce losses

USOILHello friends
Due to the price falling in the identified support area, buyers were able to support the price, but given the weakness of the trend we are witnessing, it seems that sellers have more power...
Now, for the price to rise, the identified resistance must be broken, and for the price to fall, if the support is broken, the price will continue to fall.
*Trade safely with us*

USOIL Analysis of TodayThe global economic situation has a significant impact on the demand for crude oil.
During periods of economic prosperity, industrial production and transportation activities are frequent, leading to an increase in the demand for crude oil, which in turn drives up the price of USOIL.
For example, during the period of rapid development of emerging economies, the demand for energy was robust. When there is an economic recession, the demand decreases, and the price may drop. Just like after the global financial crisis in 2008, the demand for crude oil plummeted sharply, and the price also crashed accordingly. In terms of supply, the changes in production output of major oil-producing countries are of vital importance.
The adjustment of production capacity and production disruptions in major oil-producing countries such as the United States, Saudi Arabia, and Russia will all affect the global crude oil supply. For instance, the development of the shale oil industry in the United States has significantly increased the country's crude oil production, having a major impact on the global crude oil market supply pattern.
🎁 Buy@66.90 - 67.00
🎁 SL 66.80
🎁 TP 67.15 - 67.20
Traders, if you liked this idea or if you have your own opinion about it, write in the comments. I will be glad
If you also aspire to achieve financial freedom,Follow the link below to get my daily strategy updates

#USOIL/WTI 1 DAYUSOIL/WTI (1D Timeframe) Analysis
Market Structure:
The price is currently trading near a key support level, which has previously acted as a strong demand zone. Buyers may step in at this level, leading to a potential reversal or bounce.
Forecast:
A buy opportunity is expected if the price holds above the support level and shows signs of bullish momentum. Confirmation through price action, such as bullish candlestick patterns or increased volume, can strengthen the trade setup.
Key Levels to Watch:
- Entry Zone: Consider buying near the support level if the price confirms a bounce.
- Risk Management:
- Stop Loss: Placed below the support level to manage downside risk.
- Take Profit: Target resistance levels or previous swing highs for potential gains.
Market Sentiment:
If the support level holds, the market sentiment may shift towards the upside, leading to a potential bullish move. However, a breakdown below support could indicate further weakness, requiring reassessment.

USOILUSOIL is in still in down trend, any pullback is just a chance to get in the sells again.
Disclosure: We are part of Trade Nation's Influencer program and receive a monthly fee for using their TradingView charts in our analysis.

"US oil Spot / WTI" Energy Market Bullish Heist Plan🌟Hi! Hola! Ola! Bonjour! Hallo! Marhaba!🌟
Dear Money Makers & Thieves, 🤑 💰🐱👤🐱🏍
Based on 🔥Thief Trading style technical and fundamental analysis🔥, here is our master plan to heist the "US oil Spot / WTI" Energy market. Please adhere to the strategy I've outlined in the chart, which emphasizes long entry. Our aim is the high-risk Red Zone. Risky level, overbought market, consolidation, trend reversal, trap at the level where traders and bearish robbers are stronger. 🏆💸Book Profits wealthy and safe trade.💪🏆🎉
Entry 📈 : "The heist is on! Wait for the MA breakout (73.300) then make your move - Bullish profits await!"
however I advise to Place Buy stop orders above the Moving average (or) Place buy limit orders within a 15 or 30 minute timeframe most recent or swing, low or high level.
Stop Loss 🛑:
Thief SL placed at the recent / nearest low level Using the 2H timeframe (71.600) swing trade basis.
SL is based on your risk of the trade, lot size and how many multiple orders you have to take.
Target 🎯:
1st Target - 75.500 (or) Escape Before the Target
Final Target - 79.000 (or) Escape Before the Target
🧲Scalpers, take note 👀 : only scalp on the Long side. If you have a lot of money, you can go straight away; if not, you can join swing traders and carry out the robbery plan. Use trailing SL to safeguard your money 💰.
📰🗞️Fundamental, Macro, COT, Sentimental Outlook:
🛢️"US oil Spot / WTI" Energy Market is currently experiencing a bullish trend,., driven by several key factors.
🔥Fundamental Analysis
- Supply and Demand: The current price is influenced by the balance between oil supply and demand. OPEC's production cuts and increasing demand from Asia are driving prices up ¹.
- Inventory Levels: US oil inventory levels are currently below the five-year average, contributing to the price surge.
🔥Macro Economics
- Inflation: Rising oil prices can contribute to inflation, which may lead to interest rate hikes and impact oil demand.
- Global Economic Trends: Economic growth, particularly in Asia, is driving up oil demand and prices.
🔥COT Data
- Non-Commercial Traders: Currently holding a net long position, indicating a bullish sentiment.
- Commercial Traders: Holding a net short position, possibly hedging against potential price drops.
🔥Seasonal Analysis
- Historical Price Patterns: Oil prices tend to be higher during the summer months due to increased demand.
🔥Market Sentimental Analysis
- Investor Sentiment: Currently leaning towards a bullish outlook, driven by escalating crude oil prices and increasing demand.
- Market Positioning: Investors are optimistic about oil's potential, with some expecting a breakout above $75.
🔥Next Trend Move
- Potential for an Upward Movement: With increasing demand and supply constraints, oil prices may continue to rise.
🔥Overall Summary Outlook
Considering the current price of 72.500, USOILSPOT is expected to maintain its upward momentum, driven by increasing demand and supply constraints. However, investors should be cautious of potential price volatility and geopolitical events that may impact oil prices.
⚠️Trading Alert : News Releases and Position Management 📰 🗞️ 🚫🚏
As a reminder, news releases can have a significant impact on market prices and volatility. To minimize potential losses and protect your running positions,
we recommend the following:
Avoid taking new trades during news releases
Use trailing stop-loss orders to protect your running positions and lock in profits
💖Supporting our robbery plan will enable us to effortlessly make and steal money 💰💵 Tell your friends, Colleagues and family to follow, like, and share. Boost the strength of our robbery team. Every day in this market make money with ease by using the Thief Trading Style.🏆💪🤝❤️🎉🚀
I'll see you soon with another heist plan, so stay tuned 🤑🐱👤🤗🤩

USOIL latest analysis of profitable trading signalsDuring the US trading session on Thursday, US crude oil fell in a narrow range and is currently trading around $67.13 per barrel, holding most of the gains in the previous two trading days. Previously, oil prices had rebounded for two consecutive trading days. The latest monthly report released by the Organization of Petroleum Exporting Countries (OPEC) on Wednesday showed that the organization maintained its forecast for global oil demand growth in 2025 and 2026, which is expected to increase by 1.45 million barrels per day and 1.43 million barrels per day respectively. The current crude oil market is supported by factors such as the decline in US inflation and the recovery of market sentiment in the short term, and prices have rebounded.
Analysis: From the daily chart level, the medium-term trend of crude oil remains in a wide upward channel, and oil prices gradually fall back to the lower edge of the channel. There have been many cases where one trading day swallowed up all the gains in the previous week, and the short-selling forces are more dominant. The medium-term trend of crude oil maintains a range of oscillations and downward, and the lower edge of the channel has been broken. It is expected that the medium-term decline of crude oil will start soon. The short-term trend of crude oil (1H) continues to consolidate at a low level, and the oil price gradually tests from the bottom of the range to the upper edge of the range, with the range range between 68.80-65.20. The short-term objective trend direction is oscillating rhythm. It is expected that the trend of crude oil will be resisted at the upper edge of the range during the day, and the probability of falling back downward is high. On the whole, He Bosheng recommends that the operation strategy of crude oil today is mainly to rebound high and to step on lows as a supplement. The short-term focus on the upper resistance of 68.3-68.8 and the short-term focus on the lower support of 66.0-65.5. FX:USOIL FOREXCOM:USOIL TVC:USOIL

USOIL's latest 20% profit tips
Trading signal analysis gives 65 support, and traders who rebound and go long, TP reaches the target 15%.
If you don’t know when to buy or sell, please pay close attention to the real-time signal release of the trading center or leave me a message, so that you can quickly realize the joy of profit. FOREXCOM:USOIL FX:USOIL TVC:USOIL

Latest USOIL Trading Signal PlanToday's crude oil opened at $66.34, slightly higher than yesterday's low, indicating that the market has some support around $65. After Wednesday's low of $65.22, the 4-hour chart closed with a positive line with a long lower shadow, showing that bulls have strong defense around $65.
According to the current trend analysis, the price fell from $73.14 to $68.36, a drop of $4.78; it rebounded from $68.36 to $70.60, a rebound of $2.24, and a correction of about 50%. The drop from $70.60 to $65.22, a drop of $5.38, may theoretically have ended, but considering the support of the $65 mark, it may further fall below $65.
The current trend stage may be nearing its end, but the $65 mark has not been effectively broken, and the possibility of further decline needs to be paid attention to. The target below may be in the $64.00-63.00 range.
If the price stabilizes around $65, it may start to rebound, with the target in the $67.00-68.00 range. Short selling is the main method of rebounding during the day. Pay attention to the support effect of the $65 mark. If the price effectively falls below $65, short selling can be pursued, with the target at $63.00-64.00.
Trading is risky and positions should be controlled reasonably. When the opportunity comes, if you don’t know when to buy or sell, pay close attention to my real-time signal announcement or leave me a message so that you can realize the joy of quick profits. FOREXCOM:USOIL FX:USOIL TVC:USOIL

WTI Price Analysis: Key Insights for Next Week Trading DecisionMarket Overview:
📉 WTI at $66.00: Trading defensively near a three-year low amid tariff concerns and OPEC+ output hikes.
📊 Inventory Build: A larger-than-expected US crude inventory build (up by 3.614M barrels vs. a forecasted decline) is adding pressure on prices.
⚖️ Tariff Uncertainty: Despite Trump's recent executive order exempting goods from Canada and Mexico under USMCA, overall tariff uncertainty remains a key concern.
🔺 OPEC+ Output Increase: For the first time since 2022, OPEC+ has ramped up production, weighing further on WTI.
Technical Insights:
📉 Descending Channel: The 4H chart shows a clear descending channel. Watch for the potential break of the channel's resistance line to the upside.
🎯 Key Level: Next week, the critical level to monitor is $66.50 – consider a buy if prices break above, and sell if they remain below.
Upcoming Catalysts:
⏰ US Employment Data: Keep an eye on the Consumer Price Index, Producer Price Index, Michigan Consumer Sentiment Index, EIA and API report. A weaker-than-expected report could lift the USD and boost oil prices.
Stay Tuned:
I'll provide a detailed update at the beginning of next week. Follow along for more insights and actionable trading strategies!
#WTI #CrudeOil #OilTrading #OilMarket #CommodityTrading #EnergyMarket #OilPrice #MarketAnalysis #TradingInsights #OPEC
Happy trading!
Disclaimer:
Forex and other market trading involve high risk and may not be for everyone. This content is educational only—not financial advice. Always assess your situation and consult a professional before investing. Past performance doesn’t guarantee future results.