USO: Rubber BallLike a rubber ball, USO has bounced off the green zone between $77.92 and $79.69 twice and finished wave 5 in green. We now expect it to jump a bit higher still to finish wave ii in orange before dropping down until the support line at $67.68. There, it should rebound to complete wave iv in orange and resume the overarching downward movement afterwards, which should lead into the turquoise zone between $60.18 and $43.48. There is a 30% chance, though, that USO could jump above the resistance at $87.83, thus continuing the ascent instead.
Usoilprediction

USOILHello Traders, here is the full analysis for this pair, let me know in the comment section below if you have any questions, the entry will be taken only if all rules of the strategies will be satisfied. I suggest you keep this pair on your watchlist and see if the rules of your strategy are satisfied.
The way I told you, you have to trade like this and you will have more profit always and you will not be a loss.

USOIL seems BearishAs we know Russia is agree to stop the war with Ukrain and by this we saw much fall on USOIL. There is some chances that might be USOIL rise again to retest it's supply zone then fall from that level.

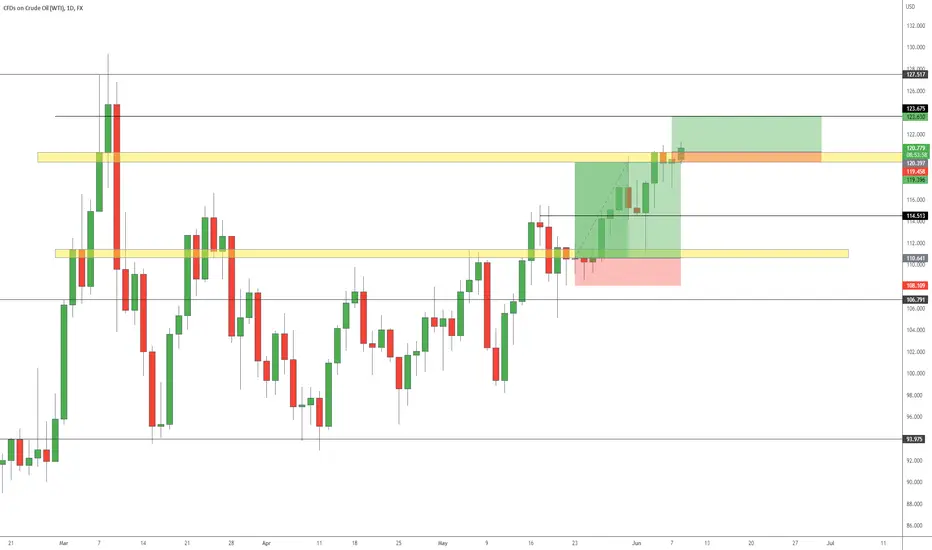
USOIL SHORT UPDATEOn our breakdown we said we'd be looking for shorts this week and that's exactly what we did with this gem.
Perfect entry and into instant profit, we told members we expect a pullback first so this move in the market didn't come as a surprise. We will be holding this trade to just above the major support region.
DON'T MISS OUT, FOLLOW THE LINK BELOW

USOIL MARKET BREAKDOWN USOIL- USOIL had a slow problematic trading week with low volume causing consolidation which was followed by quick spikes. This will be USOIL way of movement for awhile as at these levels it's vastly untested. Notice the blue box, USOIL is sat nicely in this region and it's floating around the resisting trend and mid trend. USOIL needs a move lower and 114.63 should provide a good support level as it MUST stay above this region to go higher. Should we break below that region then all the possibilities below open up to us as we have strayed very far away from the support trendline with some regions left untested. I am looking for shorts to start the week off and the longs once the support floor is confirmed. I will be looking for a swing from 114.60 or 104.60.

USOIL BULL RALLY CONTINUES What do you think guys, price is running bullish and we have one more target to smash, who will be joining me on this train. free ride to TP is about 200 pips.
USOIL_D1 Bearish Butterfly Pattern & H4 RSI Bearish DivergenceUSOIL_D1 Bearish Butterfly Pattern & H4 RSI Bearish Divergence Formation. if like my idea follow me and share your opinion in comments. Thank you.

The BIGGEST Inverse Head & Shoulders I have ever seen. USOILI just witnessed something truly amazing, USOIL just printed a MASSIVE bullish sign on the 1H chart.
But.....
Before we get all FOMO-ish and buy without a plan let's look at what we have on the table, before having a slice.
Price got to the strongest monthly resistance, which to no ones surprise also served as the giant chart pattern's neckline, with a triple job of a previous long term trendline.
After price squished all these resistances aside with a bullish reaction, a retest should set the stage for a lasting bull run, or so it seems....
Many people must have seen these bullish signs, which means manipulations might occur to push out as many as possible from the trade before the bull run.
Our safest point of entry will be to look for buy setups at the retest, and let probability do the rest.
If u found this remotely helpful to u , please drop me a like and a quick Sub, as this helps support my work and allows u get more content like this to come.
Thanks....please drop some constructive criticisms in the chat section, or u can leave some encouragement, I would be truly pleased.
Thanks my people....

USOIL MARKET OVERVIEW Good Morning and happy Sunday;
Long time no see for all our non-members but we hope this idea finds you well.
It's time we start looking at WTI on the larger time frame to put things in perspective and so you can really see the magnitude of what is happening and what is going to happen.
Over the past 5 weeks we have been limiting our USOIL trades and I want to draw attention to the first blue box, this is a huge monthly conidiation zone where price is volatile between a tight range which is why I have been standing back and just letting USOIL do it's thing (This hasn't stopped us bagging a 1000 pip trade from 99.80 and another 430 pip trade this week). WTI is climbing rapidly as we expected it would and there's no stopping it. If you have read our financial warfare post then you know all the reason why it's doing so.
The next monthly resistance zone to be tested it all time highs which we should reach soon as we blasted through the huge consolidation region marked by the first box (This shows huge buying pressure). The geopolitical sentiment in Europe and inflation are playing hand in hand with each other causing the high USOIL prices, PUTIN has come out to say that he blames COVID for the true inflation and not the war (He's correct and we have been saying this for months now).
Since COVID-19 started money became far too easily accessible with families obtaining and retaining money. It's caused an influx of new home buying, new car buying, loan obtaining and so on. Many people are now are stuck with over priced homes, huge mortgages and large loans whilst the economy gets worse. Next year the housing market will start to fall off and we'll begin to see the cycle of the recession BUT this will be a great and deep recession. This ties in with USOIL as when USOIL is at these levels a recession is undeniable now and we are starting to see glimpses on the news.
I have publicly called $175-$185 per barrel for USOIL and I still stand by this, everything we have predict has come through and the new ATH predictions are being scoped in. Once previous ATH is broken there will be a large rally to our predicted region.
OPEC are talking about kicking Russia out of the group whereby they would have to sell large amounts of their oil supply at a lower price (They're currently making $800million a day from oil). If you were Russia and knew you were in a war and potentially going to be kicked out of the OPEC group and have to sell off your oil supplies what would you do? WELL I would be creating FUD and a political event in an attempt to drive up oil prices as high as possible before I sold to get as much money as possible. Russia wont care about the implication's it will have on the world economy as the world has already crashed theirs. Again it comes back to strategic financial warfare where only public loose.
TECHNICALS:
USOIL will start bouncing between $114.20 and $126.00 on the interday timeframe until it's able to get that ATH rally but we will cover this in greater depth on Tuesday for members.
STAY SAFE AND JOIN THE LINK BELOW.

USOIL_D1 Bearish Butterfly Formation, Market will be DownUSOIL_D1 Bearish Butterfly Formation, Market will be Bearsih Revesal under 120 you can use sl 121.45, let see market condition, if you like my idea follow me and share your opinion... Thank You

USOIL seems BullishThe market of USOIL is standing on it's resistance zone. If breakout occurred then we will see more bullish momentum on USOIL. SO better to watch the resistance zone for better earning.

USO: Springy 👟👟USO seems to have put on its extra springy sneakers as it has jumped up into the green zone between $83.54 and $87.83 quite briskly after pressing against it for some time. Now, it should finish wave B in green in this region and subsequently turn around to move downwards. On its way, USO should then drop back below $82.48 and also fall below the support lines at $67.68 and $62.92 to reach the yellow zone between $60.18 and $43.48, where wave (2) in yellow should end.

USOIL Short Term Outlook |19-MayHolla,
Do you agree with my chart analysis? I expect a pullback until my sell line. My plan is to wait for candlestick structure as a confirming catalyst before opening a position.
Checklists;
1. Price must touch my entry zone
2. Price bar (4hr) must close below my zone after touching my entry zone.
3. i want to see candlestick pattern ( mostly pin bar or bearish engulfing candle) before looking for entry.
4. Chart pattern like rising wedge would me an added advantage
Will update intermittently...
Kings.

USOIL (SHORT) 🔥🔥🔥USOIL ENTRY OPPORTUNITY
Risk Disclaimer:
Please be advised that I am not telling anyone how to spend or invest their money. Take all of my analysis as my own opinion, as entertainment, and at your own risk. I assume no responsibility or liability for any errors or omissions in the content of this page, and they are for educational purposes only. Any action you take on the information in this analysis is strictly at your own risk. There is a very high degree of risk involved in trading. Past results are not indicative of future returns. Good luck

OIL trading above 100 MA, long or not ?This is not financial advice. This is for only my private trade plan. If you have follow at your own risk.

USO: StairwalkerUSO has planned a tough workout on the stairwalker. After finishing wave iii in turquoise in the upper turquoise zone between $76.92 and $75.60, it should move upwards to complete wave iv in turquoise. Then, USO should drop into the lower turquoise zone between $73.45 and $72.12 to end waves v in turquoise and 1 in green. Following another countermovement into the green zone between $77.71 and $81.57, where wave 2 in green should end, USO should fall below the support at $67.68 and the one at $62.92. There, it should enter the yellow zone between $60.18 and $43.48 to finish waves 3 in green, c in orange and (2) in yellow.

USOIL_H4 Bullish Antimax FormationUSOIL_H4 Bullish Antimax Formation, Let see market condition. Like and Follow me. Thank You

USOIL seems BullishUSOIL is increased last week as US increased it's interest rate. I believe that USOIL will continue grow to 116.20. Furthermore USOIL is obeying it's trend line and taking support on it.

US OIL MARKET BREAKDOWN USOIL moved volatile today with rallies to highs then a 400 pip pullback, Tensions in Russia are still raw and Ukraine have begun attacking petroleum sites on Russian soil which is a very brave move. The fall today was influenced by the DXY reversal albeit it isn't 100% influenced by it.
I mentioned weeks ago that $185 dollars a barrel is my target for USOIL and the way things are going it isn't out of reach. If you haven't read any of the financial warfare posts I recommend you do so to have a greater understanding of the current geopolitical situation.
Geopolitical situation in short:
Yesterday the FED raised interest rates but DXY had been climbing well before and price was factored in (we covered this in advanced) which is why we saw the drop instead of another climb higher. A V shape recovery has been made which is a VERY BULLISH sign and DXY should push higher. Since covid-19 the whole global economy has been printing money with no regard for the outcome but it fairness they needed to keep the economy floating. The FED state they have things under control but in reality they have no clue how to deal with this mess (30-45% of the US currency in circulation was printed in the last 2.5 years 'HUGE RED FLAG'. They are trying to tackle inflation by raising interest rates and this has a direct correlation with USOIL. When USOIL is this high it prints a global outlook and shows we are heading into recession.
Now as I sat down tonight to watch the news economist experts are predicting a global recession and it's down to Russia hmmmmmm... where have we heard that before? oh yeah in our financial warfare write ups. It's no coincidence, this was all called well in advanced and we knew Russia would be the scapegoat for this although there has been no coverage on the money printing.
DXY GOES UP, STOCK MARKET DROPS AND BUBBLE BURSTS! Recession is coming and USOIL at $185 a barrel will send it straight to us.
USOIL:
USOIL will bounce around a bit and the longer it takes to push higher the more chance there is of a dip. I will be looking for a swing trade in USOIL and I need it to dip to 104.70-50 before I entertain a swing long. 109.70 needs to break for a chance of pushing higher and 104.60 will act as the support. We have had a new high confirmed in this uptrend so there should be more bullishness to come. YOU MUST USE THE LINK BELOW TO KEEP FULL UP TO DATE WITH US!
We have two more predictions to come through.
BOYCOTT of Russian OIL and GAS
RECESSION

USOILpossible way for short position
.
.
.
This is Not Financial Advice
.
🧅JUST AN OPINION OF THE ONION.🧅

USOIL MARKET OVERVIEW USOIL - MARKET OVERVIEW
At the start of the week USOIL came look bearish but made a great recovery and pushed to the upside before a classic weekly closing sell off. It's important to focus on the higher time frames right now as we can see USOIL made a new higher low but failed to make a new higher high and was met by a strong resistance area and even had a fake out. USOIL is still fuelled by the conflict in Europe and it will continue to have a strong grip until tension can be settled (it can move any direction at any time).
Economies are struggling and feeling the burn so they will look to try and decrease prices to ease the effect it is having the global economy. I am Neutral and slightly bearish on USOIL, above the top blue zone we will see a quick move to the upside and below 98.70 there should be a sell off.
Make sure you use the link below to follow us more closely,
-------------------------------------------------------------------------
Pip count this week 💰🏆 / +1035 pips
WTI SHORT / 74 pips ✅
GBPUSD LONG / -26 pips ❌
WTI SHORT / 185 pips ✅
WTI SHORT / -10 pips ❌
GOLD BUY / 70 pips ✅
GOLD SELL / 170 pips ✅
WTI SHORT / 200 pips ✅
GOLD SELL / -30 pips ❌
GBPUSD SELL / 67 pips ✅
GOLD SELL / 30 pips ✅
WTI SHORT / 60 pips ✅
WTI SHORT / 130 pips ✅
GBPUSD SELL / -30 pips ❌
GBPUSD SELL / -15 pips ❌
WTI SELL / -70 pips ❌
WTI BUY / 100 pips ✅
GBPUSD SELL / 20 pips ✅
GOLD SELL / 110 pips ✅
18 trades taken
12 wins ✅
6 losses ❌
66% win rate


USOILtwo possible way
I. retest and then go up ,short term target is previous high
.
II. go up and gone
.
.
This is Not Financial Advice
.
🧅JUST AN OPINION OF THE ONION.🧅
