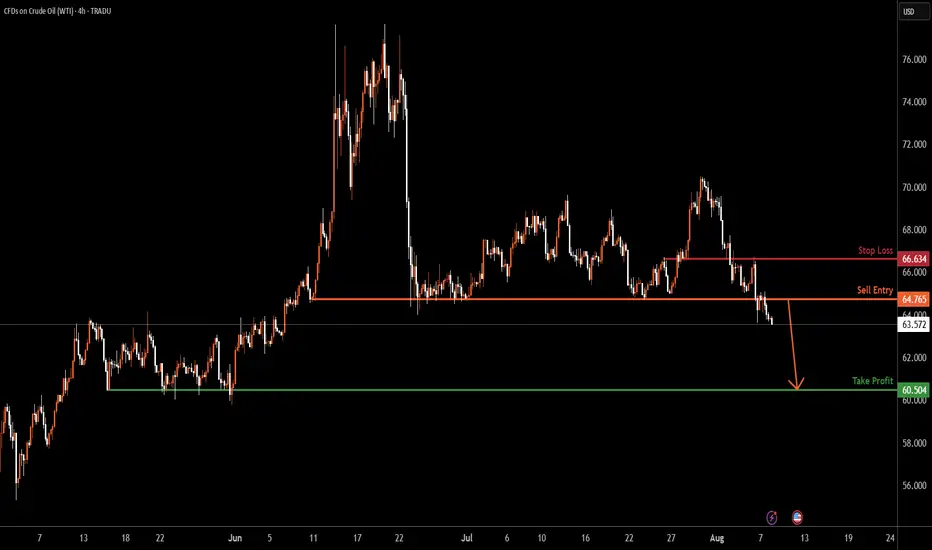
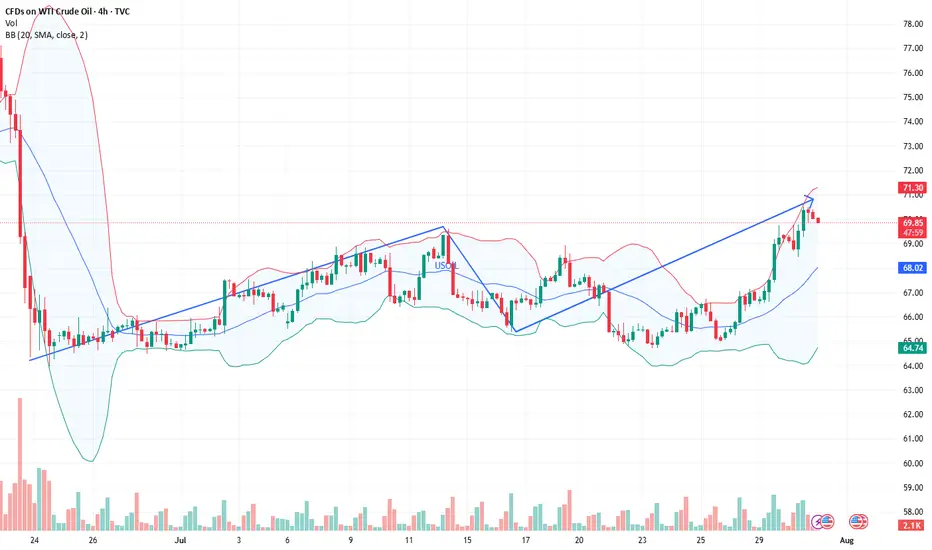
USOIL H4 | Potential bearish dropUSOIL has rejected the sell entry which has been identified as a pullback resistance and could drop from this level to the downside.
Sell entry is at 64.76, which is a pullback resistance.
Stop loss is at 66.63, which is an overlap resistance.
Take profit is at 60.50, which is a multi-swing low support.
High Risk Investment Warning
Trading Forex/CFDs on margin carries a high level of risk and may not be suitable for all investors. Leverage can work against you.
Stratos Markets Limited (tradu.com ):
CFDs are complex instruments and come with a high risk of losing money rapidly due to leverage. 65% of retail investor accounts lose money when trading CFDs with this provider. You should consider whether you understand how CFDs work and whether you can afford to take the high risk of losing your money.
Stratos Europe Ltd (tradu.com ):
CFDs are complex instruments and come with a high risk of losing money rapidly due to leverage. 66% of retail investor accounts lose money when trading CFDs with this provider. You should consider whether you understand how CFDs work and whether you can afford to take the high risk of losing your money.
Stratos Global LLC (tradu.com ):
Losses can exceed deposits.
Please be advised that the information presented on TradingView is provided to Tradu (‘Company’, ‘we’) by a third-party provider (‘TFA Global Pte Ltd’). Please be reminded that you are solely responsible for the trading decisions on your account. There is a very high degree of risk involved in trading. Any information and/or content is intended entirely for research, educational and informational purposes only and does not constitute investment or consultation advice or investment strategy. The information is not tailored to the investment needs of any specific person and therefore does not involve a consideration of any of the investment objectives, financial situation or needs of any viewer that may receive it. Kindly also note that past performance is not a reliable indicator of future results. Actual results may differ materially from those anticipated in forward-looking or past performance statements. We assume no liability as to the accuracy or completeness of any of the information and/or content provided herein and the Company cannot be held responsible for any omission, mistake nor for any loss or damage including without limitation to any loss of profit which may arise from reliance on any information supplied by TFA Global Pte Ltd.
The speaker(s) is neither an employee, agent nor representative of Tradu and is therefore acting independently. The opinions given are their own, constitute general market commentary, and do not constitute the opinion or advice of Tradu or any form of personal or investment advice. Tradu neither endorses nor guarantees offerings of third-party speakers, nor is Tradu responsible for the content, veracity or opinions of third-party speakers, presenters or participants.
Usoilshort
USOIL Bulls Seize a New OpportunityThe EIA crude oil inventory data is scheduled for release today and is expected to have a significant impact on USOIL prices. Based on the previously released API report, there’s a high probability that the EIA data will also be bullish.
From a technical perspective, USOIL is currently showing signs of a potential rebound. Therefore, for traders participating in USOIL today, it may be more favorable to adopt a bullish bias. If managed well around key support levels and timing, the setup could offer attractive profit opportunities.

Today's crude oil strategy sharingToday's Crude Oil Charlie Recommendation: 📥📥📥.
Short at $68.05, stop loss at $68.50, take profit at $66.10. (For aggressive shorting, try $67.85; for a more conservative approach, go short at $68.60).🔥🔥🔥
If the market falls to $66.50 before the New York market opens, go long at $67.70. Set the stop loss at $66.❤️🔥❤️🔥❤️🔥
⚠️⚠️⚠️The market is risky; participate rationally. FX:USOIL MARKETSCOM:USOIL FX:USOILSPOT FX:USOILSPOT MARKETSCOM:USOIL
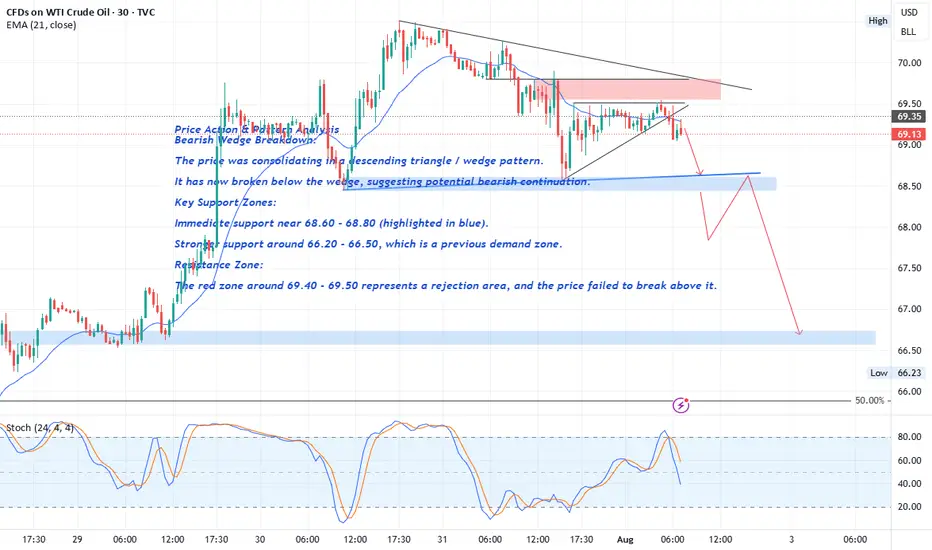
Crude Oil Price Action & Pattern Analysis
Bearish Wedge Breakdown:
The price was consolidating in a descending triangle / wedge pattern.
It has now broken below the wedge, suggesting potential bearish continuation.
Key Support Zones:
Immediate support near 68.60 - 68.80 (highlighted in blue).
FOREXCOM:USOIL
The break of the 68.60 level with a strong bearish candle would serve as confirmation of a Head and Shoulders (H&S) pattern , with solid bearish implications.
Stronger support around 66.20 - 66.50 , which is a previous demand zone.
Resistance Zone:
The red zone around 69.40 - 69.50 represents a rejection area , and the price failed to break above it.
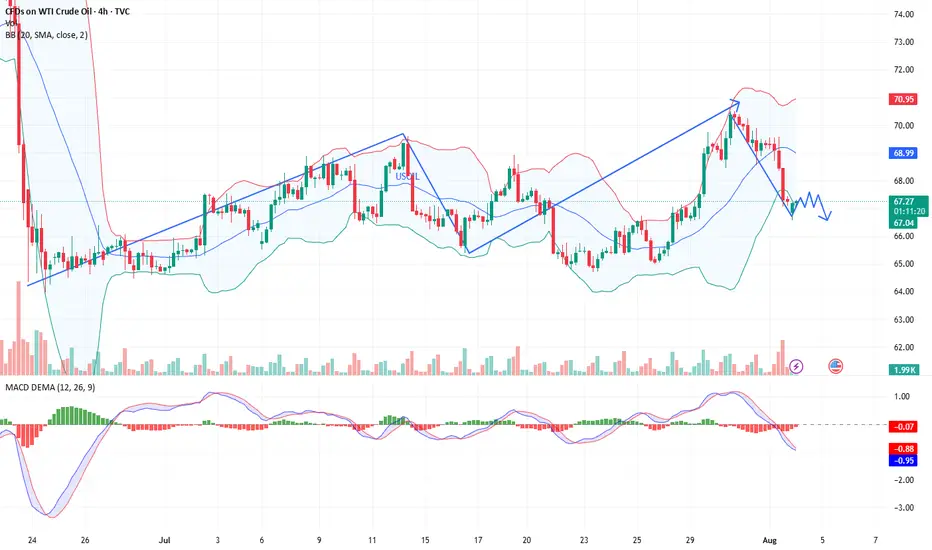
Is the surge in crude oil bulls here a comeback?The news-driven support for crude oil's recent rally is almost exhausted, so we'll continue to adopt a buy-low-sell-high strategy today, using a small stop-loss to maximize profits.
Short at $71.20, with a stop-loss at $71.70 and a take-profit at $69.20. (For aggressive shorting, try shorting at $70.95).
The above strategy is Charlie's personal opinion and is for reference only. If you follow suit, please be cautious and use a stop-loss to protect your position. TVC:USOIL FOREXCOM:USOIL TRADU:USOIL TRADU:USOIL
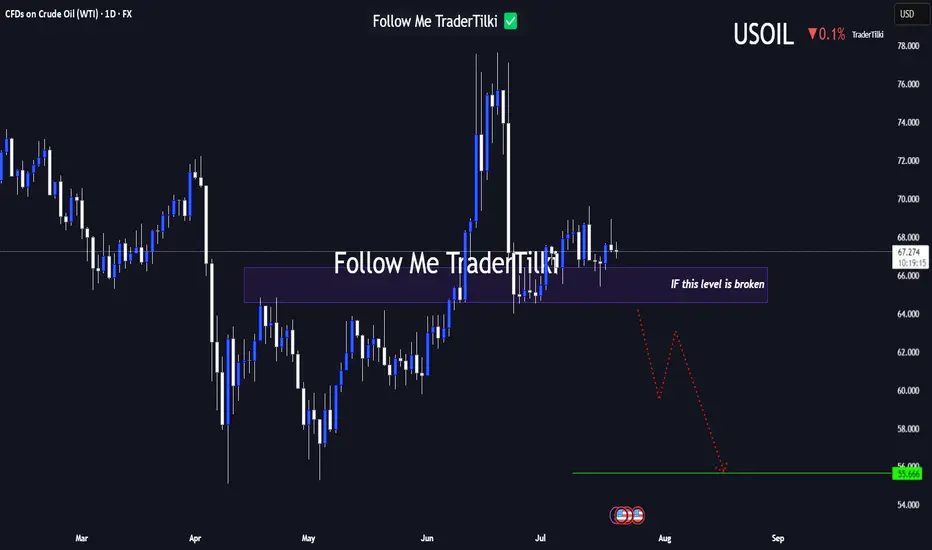
USOIL Under Technical Pressure: 1D Timeframe Breakdown Hey Guys,
The 66.584 level currently stands as the strongest support zone for USOIL. If this level breaks with a candle close, the next major target could drop to 55.666.
This setup is based on the 1-day timeframe. I highly recommend keeping a close watch on that key level.
Every like from you is my biggest motivation to keep sharing these insights. Thanks so much to everyone who’s showing support!
USOIL:Today's Trading Strategy
Oil prices have signs of upward breakthrough at present, yesterday's trend broke the short - term narrow range of shock range, on the idea of retracting to do more. The more appropriate long point is 66-66.3, if short, the more appropriate point is 67-67.4, but the short position is recommended not to be too heavy, not to do less than the point.
Trading Strategy:
SELL@67-67.4
TP: 66-66.3
BUY@66-66.3
TP: 67.5-68
More detailed strategies and trading will be notified here ↗↗↗
Keep updated, come to "get" ↗↗↗

USOIL : What will happen to the price of oil?Hello friends
As you can see, we had support in the past, which has now become a strong resistance for the price after it was broken.
Now we need to see if the price will manage to break it at this moment when it is close to its key and sensitive resistance.
*Trade safely with us*

USOIL:Narrow trading strategy
USOIL: There is no update in the past two days, because the oil price still continues to fluctuate in a narrow range, and the space for volatility is gradually reduced, which is not very different from our overall trading idea. The original long target of 65.9-66.4 can be adjusted to 65.8-66.2 with the reduction of the space for volatility. It is expected that the trend will come out this week, and we will adjust our thinking then.
Friends who do not trade at present can refer to the interval trading strategy within a day:
BUY@64.7-65
TP: 65.8 to 66.2
SELL@65.8-66.2
TP: 64.7-65
More detailed strategies and trading will be notified here ↗↗↗
Keep updated, come to "get" ↗↗↗

USOIL:Today's trading strategy
Oil prices have been sideways for the fourth trading day, volatility began to narrow, the market is brewing a new round of trend, short-term range 64-66.4. Today you can sell high and buy low around a narrow range.
Trading Strategy:
BUY@64.7-65.1
TP: 65.9-66.4
SELL: 66-66.4
TP: 65.1-64.5
More detailed strategies and trading will be notified here ↗↗↗
Keep updated, come to "get" ↗↗↗

Latest Long - Short Trading Recommendations for Crude OilDuring Monday's Asian trading session, international oil prices fell, primarily due to the combined impact of eased geopolitical tensions in the Middle East and expectations of OPEC+ production increases, which raised market supply outlooks. Although the two major benchmark oil prices recorded their largest weekly decline since March 2023 last week, they are still set to post consecutive monthly gains for June, with increases exceeding 5% each. The market had previously surged due to Middle East tensions. Since Israel struck Iranian nuclear facilities on June 13, the situation rapidly deteriorated, and the U.S. subsequently air-raided Iranian nuclear targets, pushing Brent prices to briefly surge above $80 per barrel. Current oil price movements are clearly constrained by a dual influence of geopolitics and supply expectations. While geopolitical conflicts have temporarily eased, the long-term stability of the Middle East situation remains uncertain. On the other hand, the game between OPEC+'s orderly production increase and insufficient U.S. shale oil production momentum will determine the direction of oil price fluctuations in the coming months. Against the backdrop of a moderate global economic recovery, oil prices maintaining a range of $60-70 per barrel may become a short-term norm.
you are currently struggling with losses,or are unsure which of the numerous trading strategies to follow,You have the option to join our VIP program. I will assist you and provide you with accurate trading signals, enabling you to navigate the financial markets with greater confidence and potentially achieve optimal trading results.
Trading Strategy:
sell@66.3-66.9
TP:63.1-63.3

USOIL:Sharing of the Latest Trading StrategyAll the trading signals last week have resulted in profits!!! Check it!!!👉👉👉
Fundamental Analysis:
The ceasefire agreement between Israel and Iran has eased tensions in the Middle East, the primary factor behind the recent decline in oil prices. Meanwhile, market rumors suggest the U.S. may ease sanctions on Iran, which—if realized—would raise expectations of increased crude supply and further pressure oil prices.
Additionally, OPEC+ plans to continue increasing production by 411,000 barrels per day in July, with supply growth expectations exerting long-term downward pressure on oil.
Technical Analysis (4-Hour Chart):
USOIL prices have pulled back from highs and currently hover near $65.20, approaching the S2 pivot point at around $64.69 and the 4-hour 200-period moving average. The prior appearance of a long candlestick may signal short-term support.
Notwithstanding, the current market remains in a bearish trend, so the strategy prioritizes buying on rebounds.
Trading Strategy:
Sell@67-66
TP:65-64

Analysis of Crude Oil's Opening Market Strategy on MondayWTI crude oil futures stabilized for the second consecutive day, maintaining fluctuations within the broad range of Tuesday and oscillating around the key level of $65.12. A sustained break below this level would confirm the resurgence of selling pressure, and a breach of $64.00 could trigger a decline toward $61.90. On the upside, if the price holds above $65.12, it may drive a short-term rebound to $67.44, and if momentum strengthens, it could further test $71.20.
Crude oil prices remain range-bound, but downward pressure is building. Robust U.S. demand provides support, yet macroeconomic caution and uncertainties over OPEC+ intentions are suppressing market sentiment. A decisive break below $65.12 would confirm the bearish trend, with bears targeting $61.90. Conversely, if this level holds, neutral-to-bullish logic remains valid, though upside potential remains constrained unless supply-demand signals converge overall.
you are currently struggling with losses,or are unsure which of the numerous trading strategies to follow,You have the option to join our VIP program. I will assist you and provide you with accurate trading signals, enabling you to navigate the financial markets with greater confidence and potentially achieve optimal trading results.
Trading Strategy:
buy@63.1-63.3
TP:66.3-69.9

Here is the latest analysis of the crude oil market trendOn Wednesday, international oil prices stabilized and rebounded after two consecutive days of correction, as the market reassessed the short-term easing of the Middle East situation and changes in crude oil supply. Brent crude oil futures rose by $0.75, or 1.1%, to $67.89 per barrel; WTI crude oil rose by $0.71 to $65.08. Previously, U.S. air strikes damaged key Iranian facilities. Although they did not completely destroy its capabilities, they triggered short-term market concerns about supply chain disruptions.
When geopolitical tensions temporarily eased, the market also turned its attention to inventory data. The latest data from the American Petroleum Institute (API) showed that for the week ending June 20, U.S. crude oil inventories fell by 4.23 million barrels, far exceeding the market expectation of a 2.5 million barrel decline, indicating that refinery demand remained strong. Under the dual effect of the mitigation of geopolitical risks and the bullish API inventory data, oil prices showed signs of stabilization, but the foundation for the rise was still fragile.
In the next few trading days, the safety of the Strait of Hormuz and the EIA official inventory report will become the key to whether the bulls can continue. In the current volatile pattern, it is necessary to remain cautious and pay close attention to changes in the technical support area and U.S. policy dynamics.
However, in terms of momentum, the MACD indicator has formed a bearish crossover below the zero axis, signaling a weakening of bullish momentum. This suggests that the medium-term trend of crude oil is likely to fall into a high-level consolidation pattern.
you are currently struggling with losses,or are unsure which of the numerous trading strategies to follow,You have the option to join our VIP program. I will assist you and provide you with accurate trading signals, enabling you to navigate the financial markets with greater confidence and potentially achieve optimal trading results.
Trading Strategy:
sell@67.0-68.0
TP:63.0-64.0

USoilLatest news. If the Strait of Hormuz is closed, the restrictions on the import and export of oil and natural gas will increase greatly. Because 20% of the world's oil and natural gas exports come from the Strait of Hormuz. So the trend of geopolitics will affect the closing and opening of this important checkpoint. If the increase in geopolitics really reaches this point, the price of oil may rise to 90$-100$. This is an excellent trading opportunity for investors who like to trade oil. But at present, this is an option for Iran to negotiate. Rather than a real closure, after all, the incident has not developed to this situation. If you like to trade oil. You can also follow me. Get brand new trading opportunities and make profits. Do not trade independently to avoid losses.

Will crude oil prices continue to decline?On Tuesday, oil prices fell by 6%, hitting a two-week low, as market expectations that a ceasefire between Israel and Iran would reduce the risk of supply disruptions in Middle Eastern oil. WTI crude oil fell below $64 per barrel intraday, eventually closing down 3.35% at $64.96 per barrel; Brent crude oil closed down 3.7% at $67.73 per barrel. With the easing of the Israel-Iran conflict, the trading logic of the crude oil market will return to fundamentals. For now, the consumption peak season has hedged the pressure from OPEC+ production increases. Although U.S. crude oil demand has not shown eye-catching performance, OPEC+ production increases have also fallen short of expectations. In the later stage, attention needs to be paid to the geopolitical situation and the landing of OPEC+ production increases. Looking ahead to the second half of the year, factors such as continued OPEC+ production increases, weak demand, and supply surplus will still dominate oil price movements. The daily chart of crude oil closed with a bearish hammer line, in a two-day bearish pattern. After breaking the high, crude oil fell rapidly, indicating signs of the end of the oil price rally. Today, the focus is on whether the oil price continues to break down.
you are currently struggling with losses,or are unsure which of the numerous trading strategies to follow,You have the option to join our VIP program. I will assist you and provide you with accurate trading signals, enabling you to navigate the financial markets with greater confidence and potentially achieve optimal trading results.
Trading Strategy:
sell@67.0-68.0
TP:63.0-64.0

USOIL Expected to Rebound to the 68–70 ZoneUSOIL has shown signs of short-term overselling, and a technical rebound is likely during today’s session. Traders participating in crude oil can consider buying on dips, focusing on short-term opportunities with proper position management. Quick entries and exits are recommended.

The latest layout for crude oil today.With geopolitical risks gradually easing, oil prices have deviated significantly from macroeconomic and fundamental guidance. While Iran's situation has shown signs of mitigation, the single-day decline in oil prices was excessive. We believe current oil prices have reached a reasonable range: short positions can still be held, but chasing further shorting is no longer advisable.
On the daily chart, crude oil formed a large bearish candlestick with both no upper and lower shadows, directly breaking below support and continuing to decline. After breaking above the previous high, the breakdown of support indicates that oil prices are falling back again to seek a new trading range. Today, the focus remains on the sustainability of the bearish momentum.
you are currently struggling with losses,or are unsure which of the numerous trading strategies to follow,You have the option to join our VIP program. I will assist you and provide you with accurate trading signals, enabling you to navigate the financial markets with greater confidence and potentially achieve optimal trading results.
Trading Strategy:
sell@68.5-69.0
TP:64.5-64.0

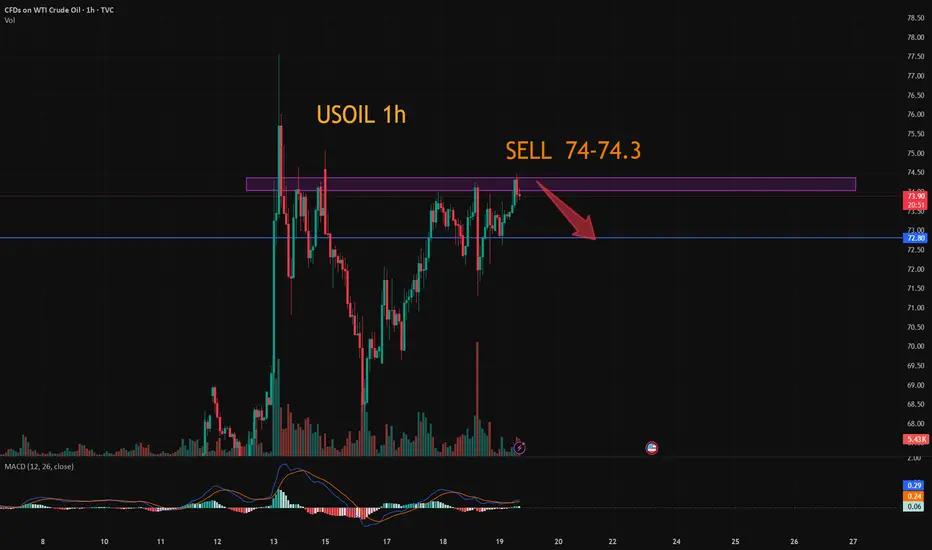
USOIL:The trading strategy of going short
USOIL: Consider shorting for now, as there are signs of a top above 74.5, but I think this is only a short-term high and will continue to surge higher. The trading idea is to sell short today and wait for the right position to be long.
Trading Strategy:
SELL@74-74.3
TP: 73.2-72.7
↓↓↓ More detailed strategies and trading will be notified here ↗↗↗
↓↓↓ Keep updated, come to "get" ↗↗↗
USOIL:Go short before you go long
The idea of crude oil is still to go long. Today, the more appropriate entry point is 72-72.3, there is still a little space at present, if you consider selling short first, then the more appropriate short point is 73-73.3 range. Give to the point to do, to wait to do more.
Trading Strategy:
SELL@73-73.3
TP: 72-72.3
BUY@72-72.3
TP: 73.7-74
↓↓↓ More detailed strategies and trading will be notified here ↗↗↗
↓↓↓ Keep updated, come to "get" ↗↗↗

USOIL 1 - Hour Chart AnalysisUSOIL 1 - Hour Chart Analysis
Key Levels
Support: ~69.50 (short - term), 67.70 (critical backup).
Resistance: 73.50 (major hurdle, tested before).
Trend, Pattern & Middle East Conflict
Price oscillates between support/resistance, with a potential “V - shaped reversal”. Middle East conflicts add high uncertainty:
Escalation: Fears of supply cuts could push price above 73.50 rapidly.
De - escalation: May pressure price down, but 67.70/69.50 still get support from lingering supply - risk worries.
Trading Strategies
Bullish: If 69.50 holds (e.g., long lower shadows/bullish candles), small - size long. Target 73.50; stop - loss ~69.20. Watch for sudden conflict news.
Bearish: If 69.50 breaks (consecutive closes below), short. Target 67.70; stop - loss ~69.80. Stay alert to conflict updates.
Note: Oil prices hinge on supply - demand, Middle East tensions, and the USD. Combine tech/fundamental analysis; manage risk strictly.
⚡️⚡️⚡️ USOil ⚡️⚡️⚡️
🚀 Buy@ 70.50 - 71.00
🚀 TP 73.00 - 74.00
Accurate signals are updated every day 📈 If you encounter any problems during trading, these signals can serve as your reliable guide 🧭 Feel free to refer to them! I sincerely hope they'll be of great help to you 🌟 👇

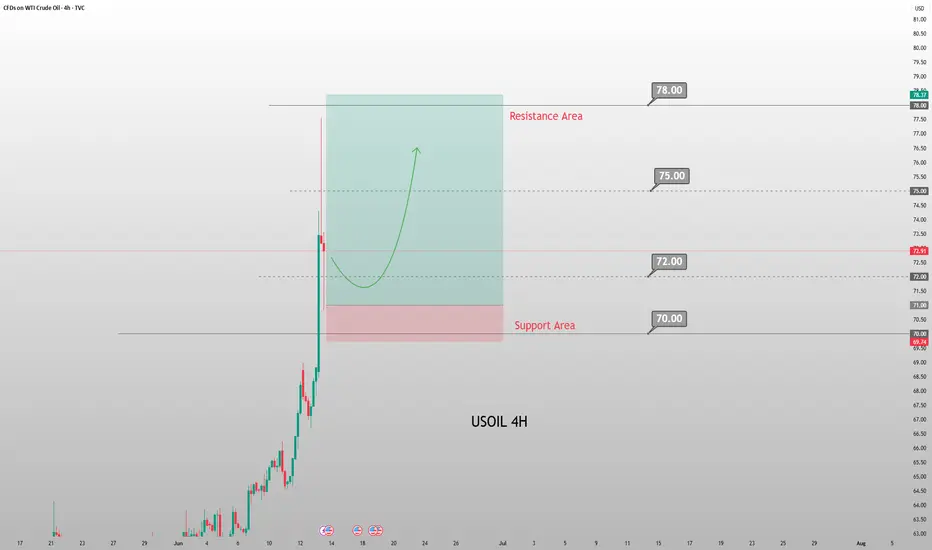
Today's Crude Oil Trend Analysis and Trading RecommendationsFrom a daily chart perspective, the violent rally in USOIL driven by external factors has completely disrupted prior technical expectations. The sharp surge has also significantly exhausted future upside potential, explaining today's gap-up and subsequent decline. With minimal likelihood of near-term de-escalation in the Iran situation, USOIL is likely to remain bullish. However, severe overbought conditions on technical charts have disrupted structural expectations, necessitating a price correction.
Technically, the $70-$75 range serves as a reasonable short-term consolidation zone, contingent on no severe escalation in Iran tensions. Given the high probability of worsening tensions, USOIL may retest $75 and even challenge $80 driven by geopolitical developments.
Thus, while the market remains focused on Iran-related risks, the short-term bias remains bullish. Avoid chasing the rally recklessly. Focus on the $70.5-$71.5 pullback zone early in the week—consider long entries only after price consolidation in this area.
USOIL
buy@70.50-71.50
tp:74-76-78
Investment itself is not the source of risk; it is only when investment behavior escapes rational control that risks lie in wait. In the trading process, always bear in mind that restraining impulsiveness is the primary criterion for success. I share trading signals daily, and all signals have been accurate without error for a full month. Regardless of your past profits or losses, with my assistance, you have the hope to achieve a breakthrough in your investment.

Next Week's Crude Oil Trend Analysis and Trading RecommendationsThe continued escalation of geopolitical tensions in the Middle East remains the core driver propelling oil prices higher. With U.S.-Iran relations at a critical juncture and the Ukrainian attack on the Crimean Bridge exacerbating the Russia-Ukraine conflict, markets are increasingly concerned about potential disruptions to Black Sea crude exports. As a key channel for 2% of global crude oil supplies, risks to Black Sea exports directly threaten supply chain security, triggering a surge in short-term market risk aversion and driving oil prices sustainably higher.
Since crude oil broke through the $64.8 resistance level with a solid candlestick last week, we have maintained a consistent bullish stance. After two weeks of consolidative oscillations, prices finally broke free from the trading range, fully demonstrating the dominance of bullish momentum. When oil prices pulled back to the $71.5–$72.0 range last Friday, we once again emphasized the short-term long strategy, which was subsequently followed by a sharp rally catalyzed by news developments. With the current trend clearly defined, we advise trading in line with the momentum: short-term long positions can be initiated above $71.0 at the start of the week.
USOIL
buy@71-72
tp:75-78
Investment itself is not the source of risk; it is only when investment behavior escapes rational control that risks lie in wait. In the trading process, always bear in mind that restraining impulsiveness is the primary criterion for success. I share trading signals daily, and all signals have been accurate without error for a full month. Regardless of your past profits or losses, with my assistance, you have the hope to achieve a breakthrough in your investment.