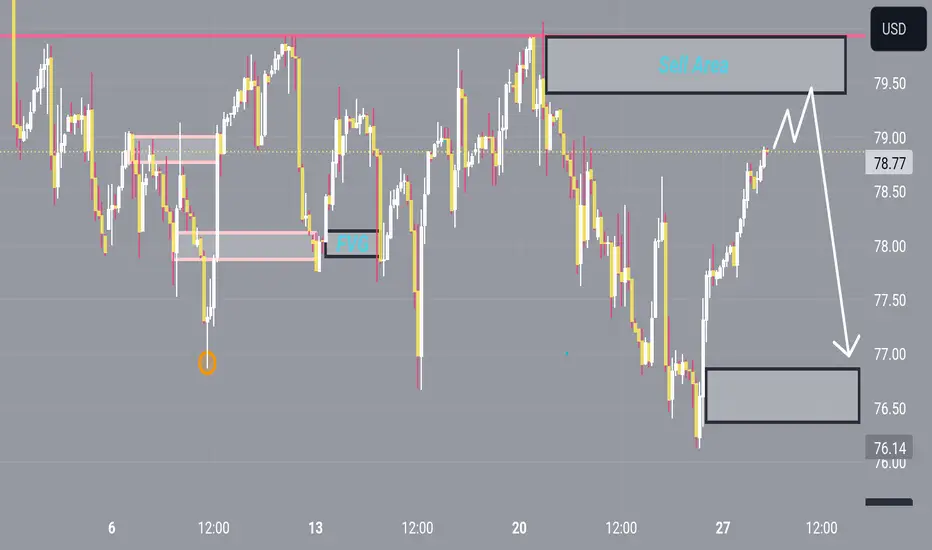
Usoilshort

USOIL sell side Hey there on 2hTF the USOIL has looking today sell scenario can be retest from 79.00
79.50 can there again slip downside continue will looks for next support 77.50
USOIL: Short-term oil prices are on the way to recovering to $80USOIL: Short-time period oil fees are at the manner to convalescing to BSE:EIGHTY because the marketplace is presently watching for the subsequent OPEC+ meeting. However, the chance of a lower is fantastically excessive due to the fact OPEC+ nations have nearly all showed the growth in production. This will probably reason oil fees to drop even lower. Consider ready to promote with USOIL around BSE:EIGHTY with the anticipated goal to go back to $75-76

USOil short term Bullish and long term Bearish**Monthly Chart**
USOil last monthly candle created a swing high with a Ring high formation which indicates a continuation of the bearish trend as it bounced from a key level at around 87.60. This month the price opened from the low of the previous candle and continues to move lower. The next level is around 70.00 and then 66.60.
**Weekly Chart**
The last weekly candle closed bearish which has created a different opinion on whether USOil price might continue moving lower after breaking the soft support level or bounce from it at around 75.90.
**Daily Chart**
I am seeing short-term bullish to break the equal highs above 80.00 level before continuing the move lower. Therefore, my long-term bias is still bearish for USOil.
The plan for this week. I will only react near the low and high of the levels that I marked. Plus I will look for a confirmation candle (some calls it insurance candle).

USOIL: Oil prices have turned downUSOIL: Oil fees have became down. In the fast time period, there are symptoms and symptoms of breaking the preceding growing channel. Besides, the fast-time period accumulation region around $77 -seventy nine is likewise displaying a main weak point withinside the context that OPEC+ has finished its discount goal and is making plans to boom production. In the fast-time period destiny scenario, it's far in all likelihood that OIL will drop to deeper charge levels. You can watch to promote with short-time period expectancies of around $75/1 barrel.

USOIL shortShorting the idea the fact that its a retracement move then making another leg lower. Also adding in the fundamentals that inflation is cooling and FOMC is round the corner.
watch this space :)

A must-read for trading oil
If you are a friend who likes to trade oil, you can do a rebound at 77.5-77.8. Combined with the trend channel, oil will rebound to a certain extent after falling. For ultra-short-term trading, you can also buy to earn the difference.
In the past, you always failed when trading alone.
But everything will change after you follow me.
Because we will be the ultimate winner!

Sell oil. A must read if trading oil.
In terms of oil, after the news of substantial persistence came to light. Oil prices have been trending downward. This is true in the medium term and also in the short term. Currently, the top of 79 serves as a pressure position and is a good selling point. The small-level target below is around the price of 77.5.
Operations are still focused on selling.
In the past, you always failed when trading alone.
But everything will change after you follow me.
Because we will be the ultimate winner!

OIL: Descending channel, sell on highsCrude Oil Technical Analysis
Daily resistance is 79.7-83.6, support below is 76.8-75
Four-hour resistance is 78.6-79.7, support below is 76.8
Crude oil operation suggestions:
Last Friday, the overall oil price fell under pressure from the 79.9 mark. The overall price appeared to be suppressed and encountered resistance at the 79.9 mark. There is still room for decline in the short term. Today, the upper resistance will focus on the hourly top-bottom transition level around 79-78.8. The intraday rebound will rely on this position to continue to be bearish. . The lower target level still focuses on new lows, and the short-term weak short-term dividing line focuses on the 79.7 mark. Before the daily level reaches this position, continue to maintain high price short selling.
SELL:78.8near SL:79.1
SELL:79.7near SL:80.0
Technical analysis only provides trading direction!

Oil price real-time trading details
Oil prices are currently back at low levels, supported by the June production cut agreement. In the short term, buying is still the main focus, taking the price of tradingview as an example. 78.2-78.5 is used as the buying range.
The target can be set at 79.6-80.5.

USOIL WILL FURTHER DOWNSIDE Hey there on 2hTF the USOIL will looks sell side from 79.50 can be again liquidity grab and will be go Downside

USOIL WILL SLIP DOWNSIDE Hey There on 1htF the USOIL has looking for short scenario till our next Target 76.75 so we can observe that can slipped again from 78 to 76-75 so that can be rebound in these area but we can first have to watch continue sell side area

Crude oil continues to be shorted at high pricesCrude Oil Technical Analysis
Daily resistance is 79.6-83.4, support below is 76.8
Four-hour resistance is 79.6-80, support below is 78-76.8
Crude oil operation suggestions: Shorts dominate the daily chart, and the trend of suppressing shorts and oscillating downwards has been formed for 6 consecutive trading days.
The short-term resistance above today continues to focus on the vicinity of 79.6. The rebound relies on this position to continue to be bearish and the target continues to be new lows. The short-term oil price long-short dividing line focuses on the 80.5 mark. Any counterattack before the daily level does not break through and stand at this position is Short opportunities and keep trading with the trend.
SELL:79.6 near SL:80.00
SELL:83.4 near SL:83.80
SELL:79.0 near SL:79.40
Technical analysis only provides trading direction!

USOil Trade IdeaUSOil (WTI) is under pressure, it has retraced into my optimal entry zone on the 4H. Looking to sell at the currrent level with a 2R target. SL above the previuos high. Not financial advice.

USOIL - Short from bearish order block ✅Hello traders!
‼️ This is my perspective on USOIL.
Technical analysis: Here we are in a bearish market structure from 4H timeframe perspective, so I look for a short. I wait price to continue the retracement to fulfill the imbalance higher and then to reject from bearish order block.
Like, comment and subscribe to be in touch with my content!

USOIL UPDATE M30
Hey team, Hope you are Enjoying our ideas and Analysis, Today we are Monitoring USOIL looking for Buy Update Around 78.79 One More Buy Limit Around 78.41, Once we will Receive any Bullish Conformation the Trade Will be Excuted
Good Luck Guys 🤞

Usoil-fall
I have always emphasized that oil will fall, and the target is 83.5-84.5. Yesterday, oil reached the lowest level near 84. Now oil has been oscillating back and forth in the 84-87 range. We can still wait for the upper edge of the range to sell.
Control your positions reasonably and wait for the right opportunity to trade
If you don’t know how to trade, join me, contact me and increase your chances of trading success

Usoil-analysis and ideas
As can be seen from the chart, two great resistance points formed near 87.6, which can mean that the short-term top of oil is slowly beginning to form. The previous idea was to call back to around 83.5, or even reach 80-82. The short-term decline was too fast, so I I think there will be a certain rebound, reaching 83-83.5, and then continuing to fall.
The current trend has verified my last idea. This is the latest idea for your reference. Join me and make money with me.

gold will continue push upsidehey there on 1HRTF the Gold has continue moving upside before the last friday on dropeed and than rise upside so we now assuming tommorrow will be open high range

Crude Oil retraces on Conflicts🛢️Hello traders.. WTI Crude Oil has been dropping since the beginning of the conflict this past weekend between Iran and Israel. We are trending bullish so far on the year and are up 14%. Price is pulling back this week and we recently touched into a Daily support level 81.25 where we observed a bounce. I dont believe sellers are completely out on this bearish retracement and am looking for a retest of the Daily level 81.25. We have a 4hr resistance zone at 82.30 that may aid in facilitating a move back down.

Usoil up Crude oil is one of the most in-demand commodities, with the two most popularly traded grades of oil being Brent Crude and West Texas Intermediate (WTI). Crude oil prices reflect the market's volatile and liquid nature, as well as oil being a benchmark for global economic activity. The oil price charts offer live data and comprehensive price action on WTI Crude and Brent Crude patterns. Get information on key pivot points, support and resistance and crude oil news today.
Confirm usoil signal

USOIL:Long first, then short
USOIL:
Small-level indicators are beneficial to bulls, with resistance around 85.8-86.5. Trading is long first and then short, and the short target is 84.8-84.
If the bulls are strong and break through 86.2-86.5, the top range of 86.9-87.5 will be considered.

USOIL: SELL @ 86.3-86.8
Yesterday, EIA was good for shorts. The market rebounded quickly after falling. It is now near the resistance level (86.3-86.8). The indicators show that shorts have the advantage, so the transaction can be sold in the resistance range first. The support is 85.6-85.2, which can be used as the TP level.
If it falls below the support, look at the 84.4-83.3 range below.
Pay attention to the rebound after falling below the support, and focus on the vicinity of 85.8.
If there is no breakthrough, you can sell a second time.
Then continue to pay attention to the support range. If the support is valid, close the short position and go long.
If the support falls below, 84.8-84.4 can be used as the TP target.
