USOIL:First go short, then go long
USOIL: There are still signs of a pullback on an hourly basis after oil prices climbed to near 63 after OPEC+ said there would be no immediate changes to current production policies.
So the trading strategy :SELL@62.5-62.8 TP@61.6-61.3
After stepping back to the point can not break a wave of rebound, the target can look at 63 again
↓↓↓ More detailed strategies and trading will be notified here →→→
↓↓↓ Keep updated, come to "get" →→→
Usoilshort

Forecast of the market trend at the opening on Monday”Oil prices remained under pressure this week, experiencing a notable decline due to multiple factors. As of Friday's Asian morning session, Brent crude futures fell 37 cents to $64.07 per barrel, while U.S. WTI crude futures dropped 39 cents to $60.81 per barrel. Brent crude fell 2% for the week, while WTI declined 2.7%.
Key Drivers of Oil Price Weakness
Stronger U.S. Dollar
The U.S. House of Representatives passed President Donald Trump’s tax-cut and fiscal spending bill, boosting the U.S. dollar index against a basket of currencies.
As oil is dollar-denominated, a stronger dollar typically reduces purchasing power for non-USD buyers, suppressing oil prices.
Supply-Demand Sensitivity and Market Sentiment
The combination of dollar strength and expectations of OPEC+ production increases has intensified bearish sentiment in the oil market.
While demand is gradually recovering, significant upward pressure on supply—including potential output hikes from OPEC+ and rising U.S. shale production—has created near-term volatility.
Technical Outlook and Trading Strategy
Short-Term Trend: Oil prices are likely to remain in a sideways-to-downward oscillation due to supply-demand imbalances.
Key Levels:
Resistance: $63.0–$63.5 per barrel (short-term overhead resistance).
Support: $60.5–$60.0 per barrel (critical near-term support zone).
Trading Approach:
Consider rebound shorting as the primary strategy, with retracement buying as a secondary approach.
Use rallies toward $63.0–$63.5 to initiate short positions, targeting support at $60.5–$60.0, with stop-losses above $64.0.
Note: Monitor OPEC+ policy updates and U.S. inventory data for potential shifts in market sentiment. Volatility may rise ahead of key economic indicators.

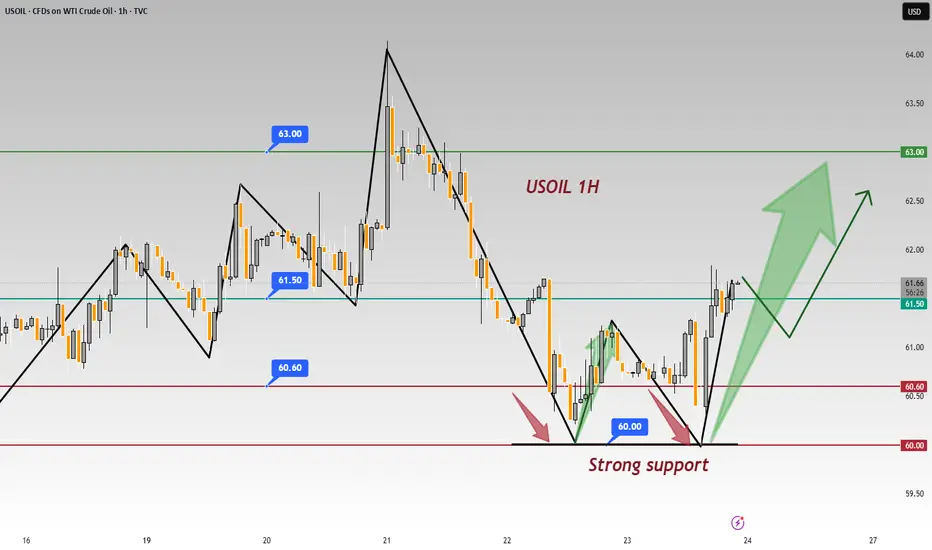
In - depth: USOIL 1 - hr Chart - Significance of 60.00 Support In the USOIL 1 - hour chart, 60.00 acts as a strong support 💪.
Support Validation
The price twice failed to break 60.00 and rebounded 📈. Psychologically, investors see 60.00 as a key level 🔑. Approaching it, buy orders pour in as they think crude oil is undervalued 📉. Technically, it's on a support line from prior lows, and repeated tests have fortified its support 🛡️.
⚡️⚡️⚡️ USOil ⚡️⚡️⚡️
🚀 Buy@ 60.00 - 60.60
🚀 TP 62.50 - 62.80
Accurate signals are updated every day 📈 If you encounter any problems during trading, these signals can serve as your reliable guide 🧭 Feel free to refer to them! I sincerely hope they'll be of great help to you 🌟 👇
Crude Oil (WTI/USD) Short SetupInternational oil prices have been supported by the temporary easing of trade tensions and buying sentiment attracted by a double bottom. However, the upside for oil prices remains limited, mainly due to the impact of Trump's uncertain tariff policies on the economy and the OPEC+ strategy of maintaining production increases. In the forward view, attention should be paid to the progress of the Iran Nuclear Agreement and Russia-Ukraine negotiations. If the agreements are reached, pressure on the oil supply side will continue to increase. During the summer oil consumption peak season, the incremental oil demand in major consuming countries may be affected by factors such as the bleak prospects of economic recovery and the substitution of new energy, keeping oil prices under pressure. On the daily chart, crude oil closed with a small bullish candle, with the high price breaking above the previous high and the low price not breaking below the previous low, forming an breakout pattern. Crude oil has shown upward momentum after consecutive oscillations, and key attention should be paid to whether the resistance level at 63.6 is broken.
Trading Strategy:
sell@62.5-63.0
TP:61.0-61.5
In the market, there are no absolutes, and neither upward nor downward trends are set in stone. Therefore, the ability to judge the balance between market gains and losses is your key to success. Let money become our loyal servant.

Crude oil: 63.00 resistance & 60.00 support keyPrices are currently testing the upper resistance at $63.00 📈. These levels are suppressing the price 🔻. A decisive breakthrough above this level may trigger a more intense upward rally 🔥. Meanwhile, recent selling pressure has pushed the price down to $60.60 📉. Watch the pivot support at $60.00, the real downward target 🎯
Crude oil surplus expanded in April, and imports increased, reaching multi - month highs from some countries 🌍. If global benchmark oil prices rise in the future, purchases may be reduced 📉.
Crude oil fell first and then rose today 📊. After a deep dive to $60.9, it stabilized and started to rise 🔼. After the previous price increase and adjustment, it remains to be seen if the upward momentum will continue and break through upwards 🔍.
Overall, on the delivery day, oil prices are volatile 🔼🔽. Watch the resistance at $63.0 on the upside and the support at $60.60 - $60.0 on the downside 👀.
⚡️⚡️⚡️ USOil ⚡️⚡️⚡️
🚀 Sell@ 62.50 - 62.30
🚀 TP 61.50 - 60.60
Accurate signals are updated every day 📈 If you encounter any problems during trading, these signals can serve as your reliable guide 🧭 Feel free to refer to them! I sincerely hope they'll be of great help to you 🌟 👇

USOIL Temporary Drop seems inevitableOn Thursday, WTI crude oil futures prices fell approximately 3.5% during the session, extending losses after failing to test technical resistance levels. The decline was jointly driven by heightened expectations of a U.S.-Iran nuclear agreement and unexpected increases in crude oil inventories, both of which exerted heavy pressure on supply outlooks. Nevertheless, market analysis suggests the downside for the U.S. dollar may be limited. Improved global trade sentiment has reduced recession fears, leading markets to scale back expectations for aggressive Federal Reserve rate cuts. Data shows the probability of a 25-basis-point rate cut by the Fed in September is now 74%, down from earlier predictions of a July cut.
Crude oil continued to decline today, breaking the previous upward pattern, with a high probability that prices will trade in a broad range going forward. Overall, the magnitude of the decline has increased, suggesting a higher likelihood of further downside. Today's trading strategy considers shorting on rebounds as the primary approach, while waiting for long opportunities at lower levels. Resistance is focused on the $62.0–63.0 area, with support at $60.0–59.0.
you are currently struggling with losses, or are unsure which of the numerous trading strategies to follow, at this moment, you can choose to observe the operations within our channel.
USOIL UPDATEHello friends
Given the recent growth in oil prices, it is natural for the price to correct. Now we have obtained the most important price support areas for you and we have also specified the target. If you are willing to enter the transaction, be sure to observe capital management.
*Trade safely with us*

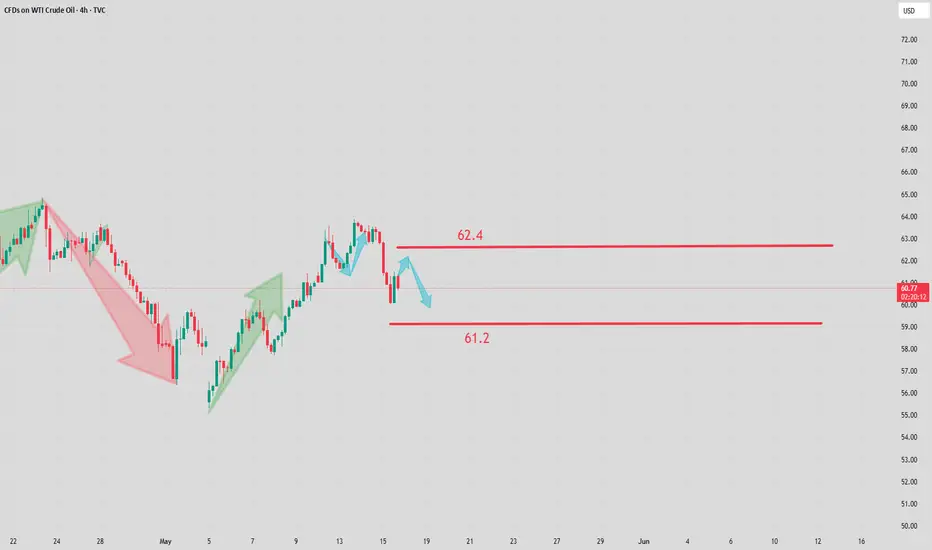
WTI crude (USOUSD) short continuation .. the week of 12 MayWill price retest the support/resistance zone one more time? That is what I am hoping for. Note that we have been seeing consistently lower highs. Price then broke below the zone, did one retest already and seems to be trying to retest it once again. I am looking for price to enter the zone and then give me some bearish evidence.
Stop – above the zone
1st target can be at 57.00 with the possibility to take this down to 52.00
This is not a trade recommendation; it’s merely my own analysis. Trading carries a high level of risk, carefully manage your capital and risk. If you like my idea, please give a “boost” and follow me to get even more.
It’s not whether you are right or wrong, but how much money you make when you are right and how much you lose when you are wrong – George Soros

USOIL:Strategic Analysis on ThursdayThe Ministry of Energy of Kazakhstan stated that the country has no plans to cut oil production in May. The country has continuously exceeded production limits, creating tensions within OPEC+. The Ministry of Energy in Astana said that the largest oil-producing country in Central Asia will have an average daily production of crude oil and condensate of 277,000 tons in May, remaining the same as in April, while the average daily production in March was 260,000 tons. OPEC+ has agreed to significantly increase production for two consecutive months, surprising traders and pushing down oil prices. This move is largely driven by Saudi Arabia, the leader of OPEC, which hopes to punish member states such as Kazakhstan that have continuously exceeded production limits. Crude oil has shown a trend of stabilizing and rebounding at a low level today, stabilizing and rising around $57.7, and showing a volatile upward trend. The key today is whether the upward trend of crude oil can continue to break above the level of $60.6.
you are currently struggling with losses, or are unsure which of the numerous trading strategies to follow, at this moment, you can choose to observe the operations within our channel.

USOIL Trading strategiesOn Tuesday, due to the increase in demand from Asia and Europe, the decline in U.S. production, and the further escalation of the situation in Israel, international oil prices soared. After today's opening, oil prices have remained volatile at a high level, demonstrating strong resilience. The key dividing line between bulls and bears is at the crucial price level of $58.4. As long as this price level is not effectively broken, it will be difficult for the bullish trend of oil prices to change. Currently, oil prices are still within the bullish channel.
In terms of today's trading strategy, it is recommended to mainly place long orders on pullbacks, supplemented by a small number of short positions. Pay close attention to the resistance range of $60.8 - $61.6 above, and closely monitor the support area of $58.9 - $58.0 below.
USOIL
buy@58.80-59.30
tp:60.00-61.00

Oil prices still face systemic downside risks.Although the geopolitical situation in the Middle East (the conflict between Israel and Iran) may support oil prices in the short term, market sentiment is still dominated by supply pressure. Technically, WTI has broken below the key support level of $60. The MACD death cross and the oversold RSI suggest that the bears are in the dominant position, and the next support level is expected to be $54.80. Barclays Bank has lowered its price forecast for Brent crude in 2025 to $66. Weak demand and the expectation of the resumption of shale oil production in the United States further suppress the medium - term trend.
you are currently struggling with losses, or are unsure which of the numerous trading strategies to follow, at this moment, you can choose to observe the operations within our channel.
Trading Strategy:
sell@58.8-59.1
TP:57.6-58.1

Can it hit the bottom and rebound?Fundamental Analysis: Driven by the trade concerns sparked by Trump and the risk aversion sentiment arising from the global economic slowdown, the trajectory of oil prices has been shaped. Additionally, OPEC+ convened an early meeting on Saturday and confirmed an increase in production of 411,000 barrels per day in June. This decision has indubitably intensified the market's apprehensions regarding the oversupply of crude oil 📉.
Technical Analysis: Technically speaking, the price of crude oil has persistently lingered below the midline of the Bollinger Bands, distinctly indicating that the bearish trend is in the ascendancy 📉. Last week, on the weekly chart, it closed with a substantial bearish candlestick, exhibiting a downward tail pattern, and in the short term, the price has been fluctuating within a trading range 📊. As for the upcoming week's trend, whether the support level established by the previous double doji bottoming formation will be broken through effectively will be the focal point of market attention 👀. Nevertheless, once the price reaches the crucial support level, there exists the potential for a technical rebound. Investors should closely monitor the variations in trading volume and the response of the moving average system 📈.
Market Situation: It is crucial to note that due to the holiday factor in the Asian market next Monday, market liquidity is anticipated to decline significantly. Under such circumstances, the oil price is likely to encounter a higher risk of more pronounced volatility, further escalating the uncertainty of the market situation ⚠️.
⚡⚡⚡ USOIL ⚡⚡⚡
🚀 Buy@56.0 - 57.0
🚀 TP 59.0 - 60.0
Accurate signals are updated every day 📈 If you encounter any problems during trading, these signals can serve as your reliable guide 🧭 Feel free to refer to them! I sincerely hope they'll be of great help to you 🌟

USOIL trading opportunities.After the "OPEC+ continued to increase production" on Monday, USOIL continued to fall to a four-year low near 55. However, it rebounded after opening low on Monday. It continued on Tuesday. Is it no longer able to fall?
Ludvig believes that it will continue to fall. Because the decline is caused by the growth of production capacity. The rise is caused by geopolitical strategic reserve materials. One of these two directly affects the trend of OIL, and the other indirectly.
The trend of economic data API/EAI will continue to be released. If the geopolitical weakening situation, the oil price data released is roughly negative, so it will continue to fall. But if the impact of geopolitics intensifies, this is a positive factor.
So the current trading direction that can be determined is to continue to short.
In terms of trading, traders with large funds can sell at the current price, and those with small funds can wait until the market returns to above 59 to sell.
The band trading center continues to update new real-time trading opportunities. If you don’t know how to trade, or don’t want to miss the next real-time trading opportunity, remember to follow me.

What adjustments will be made to oil prices?If traders don’t know how to trade, they can refer to the strategy of the Swing Trading Center. Earlier, it was announced to sell at 57.24. The lowest price reached around 56.3, and now the oil price has returned to 57.24. How to trade? If you are also confused, you can refer to the views of the Swing Trading Center.
At present, the supply of oil prices exceeds the demand, and some oil-producing countries will continue to increase the production of oil prices. The market has never recognized that oil will become a slow-selling product. Oil prices can be allowed to fall. But oil is not allowed to have no production capacity. I like this sentence.
Oil prices are expected to be mainly adjusted in the short term. The clear trading instructions have been announced in the Swing Trading Center. Stay tuned. Prevent missing good trading opportunities.

After a period of fluctuation, it will continue to decline.WTI crude oil has recouped part of the decline from the sharp drop at the start of this week. It was quoted at $57.55 per barrel during intraday trading. OPEC+ has unexpectedly increased production again, and WTI crude oil has continued the bearish trend that has gradually taken shape since March. With the increase in global supply and the rise in macro risks, the downward price range has emerged once again. If the tensions in the Middle East escalate further, it may trigger market volatility. The eight core member states of the organization, led by Saudi Arabia, have agreed to increase daily production by 411,000 barrels in June, which is the same as the unexpected production increase in May. The cumulative production increase now exceeds 800,000 barrels per day, marking an important step towards canceling the target of the voluntary production cut of 2.2 million barrels per day that has been promised since 2022. Crude oil showed a trend of rising first and then falling today. After breaking through a new low, the upward movement continued. It faced resistance after reaching
you are currently struggling with losses, or are unsure which of the numerous trading strategies to follow, at this moment, you can choose to observe the operations within our channel.

Analysis and Layout of Crude Oil at the Opening of the MarketThe international crude oil market has experienced intense fluctuations. Both Brent crude oil and West Texas Intermediate (WTI) crude oil have recorded significant declines, dropping by 8.31% and 7.58% respectively. The expectations of OPEC+ production increase, the trade concerns triggered by Trump, and the market's risk aversion sentiment due to the global economic slowdown have become the key factors dominating the trend of oil prices.
The crude oil has corrected and broken below the support line, and there is a high probability that the bearish trend will enter a further acceleration stage. After the initial rise followed by a fall, the demarcation line between the bulls and the bears is around 59.4. If it comes under pressure again, it will indicate the continuation of the future trend. The moving average system is in a bearish arrangement, and it is suppressed by the 30-day moving average. Objectively, the short-term trend direction remains downward. Next week, consider taking short positions around 59.4 and expect further decline.

Analysis of the Market Trend for Next WeekThe price of crude oil futures declined on Friday, falling by approximately 1% during the session, giving back the gains brought about by a brief technical rebound. Bearish demand signals continued to dominate traders' sentiment. The price of crude oil is likely to drop by more than 7% this week, which reflects the growing concerns in the market about the weakening of global demand. Traders remain cautious ahead of the crucial OPEC+ meeting scheduled for May 5th. It is expected that some member states will push for an acceleration of production increases before June. There are reports that Saudi Arabia has hinted that it has no intention of supporting oil prices through a new round of production cuts, which has further intensified the downward pressure on oil prices.
In terms of demand, the market remains skeptical about potential trade negotiations. The Ministry of Commerce of China stated that it is evaluating the proposal put forward by the United States to resume tariff negotiations. Analysts said that the trade environment remains unstable and fraught with uncertainties.
Crude oil showed a trend of rising first and then falling today. At the same time, the oil price correction broke below the support line, and the bearish trend of oil prices is expected to enter a further acceleration stage. After the rise first and then the fall, the demarcation line between the bulls and bears of oil prices is around $59.3. If it is under pressure again, it will indicate the continuation of the future trend.

Summary of the Crude Oil Market This WeekThis week, the crude oil market witnessed a significant decline. Brent crude oil dropped by a cumulative 8.3%, and WTI crude oil fell by 7.5%. Both recorded their largest single-week declines since the end of March.👉👉👉
OPEC+ convened a production meeting ahead of schedule and planned to discuss the production increase plan for June. The market bets that the probability of a production increase is as high as 70%. Previously, OPEC+ unexpectedly announced in April that it would increase daily production by 411,000 barrels starting from May, which is three times the original planned increase. This move aimed to punish member states that had overproduced oil. If production is further increased in June, it will further intensify the supply pressure on the market.
Although the geopolitical tensions in the Middle East region have intensified, such as the postponement of the fourth round of nuclear negotiations between the United States and Iran, which has, to a certain extent, provided support for oil prices, judging from the overall market situation this week, this supporting effect has failed to offset the impact of increased supply and decreased demand.
Overall, this week, under the intertwined influence of factors such as increased supply, uncertain demand prospects, and changes in the geopolitical situation, the crude oil market showed a significant downward trend. The market's expectations for crude oil prices are rather pessimistic, and it is expected that crude oil prices will still face certain downward pressure in the coming period. However, if OPEC+ changes its production increase plan, or if there is an unexpected improvement in the global economy, crude oil prices may rebound.

The decisive day of major data (USOIL)
Yesterday, it was pointed out in the analysis circle: The support of 58 needs to be tested. Sure enough, buying at low levels continued to expand profits. The current price is 59.6. From the pressure analysis, the market is still affected by data that oversupply, and institutions will not reduce production in a short time. Therefore, oil prices will fall further,
The oil price broke through 59. Due to supply reasons, the market still has a downward range. 60-61 is a good choice to sell in succession.
tp58-57

USOIL trading alerts. Pressure and support.Oil also fell according to instructions. I just forgot to remind you. Sorry, but the profit is quite good. Sell short from 58.7. Then the lowest reached 56.34
But today in the New York market, USOIL rose again above 58. From a fundamental perspective. The market will continue to fall under pressure. But from the trend, we need to pay attention to the support of 58. If it does not fall today, it is likely to continue to fall based on Friday's trend. The pressure level near 59 needs to be paid attention to. In terms of operation, it is still mainly selling at high levels.
Always remind trading risks. So don't ignore this. If you don't know how to trade. Remember to wait and see. Don't trade blindly or gamble.
Many investor friends know that I have led some investors to create good profits for several consecutive days. If you don't know how to trade, remember to leave me a message and try it. Maybe your profit will double.

Can oil prices continue to be shorted? Of courseSaudi Arabia made a major strategic shift, willing to accept low oil prices and unwilling to cut supply.
Oil prices fell sharply as a result.
It is expected that oil prices will hit 55-56 in the short term, so the operation is still mainly shorting oil prices. Overcapacity.

Short on Oil/Back to 57$ SOONI believe we can continue the retest of previous major support level at 65-66$ and fibonacci 0.618. This major support will be flipped to resistance in my opinion. We can see a significant sell-off back towards the 57$ area and below from this location.
I will be looking to enter a short trade from the 0.618 region/66$ if there is a rejection.
My mid-term/end-of-year prediction for US OIL is between 45-50$ and possibly lower.
If you believe in the fundamentals and idea of this setup, feel free to follow and use it.
Not financial advice.

