USOIL:Sharing of the Latest Trading StrategyAll the trading signals last week have resulted in profits!!! Check it!!!👉👉👉
Fundamental Analysis:
The ceasefire agreement between Israel and Iran has eased tensions in the Middle East, the primary factor behind the recent decline in oil prices. Meanwhile, market rumors suggest the U.S. may ease sanctions on Iran, which—if realized—would raise expectations of increased crude supply and further pressure oil prices.
Additionally, OPEC+ plans to continue increasing production by 411,000 barrels per day in July, with supply growth expectations exerting long-term downward pressure on oil.
Technical Analysis (4-Hour Chart):
USOIL prices have pulled back from highs and currently hover near $65.20, approaching the S2 pivot point at around $64.69 and the 4-hour 200-period moving average. The prior appearance of a long candlestick may signal short-term support.
Notwithstanding, the current market remains in a bearish trend, so the strategy prioritizes buying on rebounds.
Trading Strategy:
Sell@67-66
TP:65-64
Usoilsignal

USOIL:Go long
usoil: Let's start with a short-term rebound.
Trading idea:
BUY@64.8-65.2
TP: 66-66.4
More detailed strategies and trading will be notified here ↗↗↗
Keep updated, come to "get" ↗↗↗

USoilLatest news. If the Strait of Hormuz is closed, the restrictions on the import and export of oil and natural gas will increase greatly. Because 20% of the world's oil and natural gas exports come from the Strait of Hormuz. So the trend of geopolitics will affect the closing and opening of this important checkpoint. If the increase in geopolitics really reaches this point, the price of oil may rise to 90$-100$. This is an excellent trading opportunity for investors who like to trade oil. But at present, this is an option for Iran to negotiate. Rather than a real closure, after all, the incident has not developed to this situation. If you like to trade oil. You can also follow me. Get brand new trading opportunities and make profits. Do not trade independently to avoid losses.

USOIL Expected to Rebound to the 68–70 ZoneUSOIL has shown signs of short-term overselling, and a technical rebound is likely during today’s session. Traders participating in crude oil can consider buying on dips, focusing on short-term opportunities with proper position management. Quick entries and exits are recommended.

USOIL 1 - Hour Chart AnalysisUSOIL 1 - Hour Chart Analysis
Key Levels
Support: ~69.50 (short - term), 67.70 (critical backup).
Resistance: 73.50 (major hurdle, tested before).
Trend, Pattern & Middle East Conflict
Price oscillates between support/resistance, with a potential “V - shaped reversal”. Middle East conflicts add high uncertainty:
Escalation: Fears of supply cuts could push price above 73.50 rapidly.
De - escalation: May pressure price down, but 67.70/69.50 still get support from lingering supply - risk worries.
Trading Strategies
Bullish: If 69.50 holds (e.g., long lower shadows/bullish candles), small - size long. Target 73.50; stop - loss ~69.20. Watch for sudden conflict news.
Bearish: If 69.50 breaks (consecutive closes below), short. Target 67.70; stop - loss ~69.80. Stay alert to conflict updates.
Note: Oil prices hinge on supply - demand, Middle East tensions, and the USD. Combine tech/fundamental analysis; manage risk strictly.
⚡️⚡️⚡️ USOil ⚡️⚡️⚡️
🚀 Buy@ 70.50 - 71.00
🚀 TP 73.00 - 74.00
Accurate signals are updated every day 📈 If you encounter any problems during trading, these signals can serve as your reliable guide 🧭 Feel free to refer to them! I sincerely hope they'll be of great help to you 🌟 👇

USOIL:Go long
USOIL: Short-term momentum is still dominant, the trend of crude oil is expected to maintain a high shock upward rhythm.
Trading Strategy:
BUY@70.5-71
TP: 73-73.6
↓↓↓ More detailed strategies and trading will be notified here ↗↗↗
↓↓↓ Keep updated, come to "get" ↗↗↗

Today's Crude Oil Trend Analysis and Trading RecommendationsFrom a daily chart perspective, the violent rally in USOIL driven by external factors has completely disrupted prior technical expectations. The sharp surge has also significantly exhausted future upside potential, explaining today's gap-up and subsequent decline. With minimal likelihood of near-term de-escalation in the Iran situation, USOIL is likely to remain bullish. However, severe overbought conditions on technical charts have disrupted structural expectations, necessitating a price correction.
Technically, the $70-$75 range serves as a reasonable short-term consolidation zone, contingent on no severe escalation in Iran tensions. Given the high probability of worsening tensions, USOIL may retest $75 and even challenge $80 driven by geopolitical developments.
Thus, while the market remains focused on Iran-related risks, the short-term bias remains bullish. Avoid chasing the rally recklessly. Focus on the $70.5-$71.5 pullback zone early in the week—consider long entries only after price consolidation in this area.
USOIL
buy@70.50-71.50
tp:74-76-78
Investment itself is not the source of risk; it is only when investment behavior escapes rational control that risks lie in wait. In the trading process, always bear in mind that restraining impulsiveness is the primary criterion for success. I share trading signals daily, and all signals have been accurate without error for a full month. Regardless of your past profits or losses, with my assistance, you have the hope to achieve a breakthrough in your investment.

The main strategy is to go long on pullbacksDuring the Asian trading session on Monday, Brent crude fell slightly by $0.05 to $65.15 per barrel; WTI crude was quoted at $61.76, while the more actively traded July contract dropped $0.04 to $61.93. Both benchmark oil prices recorded weekly gains of over 1% last week, mainly boosted by the easing of global trade sentiment. The market will closely monitor data to be released soon by a major Asian economy, including April industrial added value, fixed asset investment, and retail sales. ANZ Bank noted in a report that weak data from the major Asian economy could undermine the optimism brought by the tariff suspension, thereby pressing down oil prices.👉👉👉
The K-line closed as a yang line with a long lower shadow, indicating strong bullish momentum from buyers. The moving average system is gradually arranging in a bullish formation, relying on the oil price, and the short-term objective trend direction has turned upward. It is expected that the intraday crude oil trend will continue to rise, reaching near 63. Overall, in terms of crude oil trading strategies, it is recommended to focus on buying low on pullbacks and supplement with selling high on rebounds. In the short term, pay attention to the resistance at the 63.0-63.5 level above, and the support at the 61.0-60.5 level below.
Oil trading strategy:
buy @ 61.00-61.50
sl 60.00
tp 62.30-62.80
If you think the analysis helpful, you can give a thumbs-up to show your support. If you have different opinions, you can leave your thoughts in the comments. Thank you for reading!👉👉👉

"US Oil Spot/WTI" Energy Market Bullish Heist (Swing Trade Plan)🌟Hi! Hola! Ola! Bonjour! Hallo! Marhaba!🌟
Dear Money Makers & Robbers, 🤑 💰💸✈️
Based on 🔥Thief Trading style technical and fundamental analysis🔥, here is our master plan to heist the "US Oil Spot/WTI" Energy Market. Please adhere to the strategy I've outlined in the chart, which emphasizes long entry. Our aim is to escape near the high-risk Red Zone Level. Risky level, overbought market, consolidation, trend reversal, trap at the level where traders and bearish robbers are stronger. 🏆💸"Take profit and treat yourself, traders. You deserve it!💪🏆🎉
Entry 📈 : "The heist is on! Wait for the MA breakout (59.700) then make your move - Bullish profits await!"
however I advise to Place Buy stop orders above the Moving average (or) Place buy limit orders within a 15 or 30 minute timeframe most recent or swing, low or high level for Pullback entries.
📌I strongly advise you to set an "alert (Alarm)" on your chart so you can see when the breakout entry occurs.
Stop Loss 🛑: "🔊 Yo, listen up! 🗣️ If you're lookin' to get in on a buy stop order, don't even think about settin' that stop loss till after the breakout 🚀. You feel me? Now, if you're smart, you'll place that stop loss where I told you to 📍, but if you're a rebel, you can put it wherever you like 🤪 - just don't say I didn't warn you ⚠️. You're playin' with fire 🔥, and it's your risk, not mine 👊."
📍 Thief SL placed at the recent/swing low level Using the 3H timeframe (57.400) Swing trade basis.
📍 SL is based on your risk of the trade, lot size and how many multiple orders you have to take.
🏴☠️Target 🎯: 63.000 (or) Escape Before the Target.
🧲Scalpers, take note 👀 : only scalp on the Long side. If you have a lot of money, you can go straight away; if not, you can join swing traders and carry out the robbery plan. Use trailing SL to safeguard your money 💰.
💰💵💴💸"US Oil Spot / WTI" Energy Market Heist Plan (Swing Trade) is currently experiencing a bullishness🐂.., driven by several key factors.☝☝☝
⚠️Trading Alert : News Releases and Position Management 📰 🗞️ 🚫🚏
As a reminder, news releases can have a significant impact on market prices and volatility. To minimize potential losses and protect your running positions,
we recommend the following:
Avoid taking new trades during news releases
Use trailing stop-loss orders to protect your running positions and lock in profits
💖Supporting our robbery plan 💥Hit the Boost Button💥 will enable us to effortlessly make and steal money 💰💵. Boost the strength of our robbery team. Every day in this market make money with ease by using the Thief Trading Style.🏆💪🤝❤️🎉🚀
I'll see you soon with another heist plan, so stay tuned 🤑🐱👤🤗🤩

Can it hit the bottom and rebound?Fundamental Analysis: Driven by the trade concerns sparked by Trump and the risk aversion sentiment arising from the global economic slowdown, the trajectory of oil prices has been shaped. Additionally, OPEC+ convened an early meeting on Saturday and confirmed an increase in production of 411,000 barrels per day in June. This decision has indubitably intensified the market's apprehensions regarding the oversupply of crude oil 📉.
Technical Analysis: Technically speaking, the price of crude oil has persistently lingered below the midline of the Bollinger Bands, distinctly indicating that the bearish trend is in the ascendancy 📉. Last week, on the weekly chart, it closed with a substantial bearish candlestick, exhibiting a downward tail pattern, and in the short term, the price has been fluctuating within a trading range 📊. As for the upcoming week's trend, whether the support level established by the previous double doji bottoming formation will be broken through effectively will be the focal point of market attention 👀. Nevertheless, once the price reaches the crucial support level, there exists the potential for a technical rebound. Investors should closely monitor the variations in trading volume and the response of the moving average system 📈.
Market Situation: It is crucial to note that due to the holiday factor in the Asian market next Monday, market liquidity is anticipated to decline significantly. Under such circumstances, the oil price is likely to encounter a higher risk of more pronounced volatility, further escalating the uncertainty of the market situation ⚠️.
⚡⚡⚡ USOIL ⚡⚡⚡
🚀 Buy@56.0 - 57.0
🚀 TP 59.0 - 60.0
Accurate signals are updated every day 📈 If you encounter any problems during trading, these signals can serve as your reliable guide 🧭 Feel free to refer to them! I sincerely hope they'll be of great help to you 🌟

USOIL trading opportunities.After the "OPEC+ continued to increase production" on Monday, USOIL continued to fall to a four-year low near 55. However, it rebounded after opening low on Monday. It continued on Tuesday. Is it no longer able to fall?
Ludvig believes that it will continue to fall. Because the decline is caused by the growth of production capacity. The rise is caused by geopolitical strategic reserve materials. One of these two directly affects the trend of OIL, and the other indirectly.
The trend of economic data API/EAI will continue to be released. If the geopolitical weakening situation, the oil price data released is roughly negative, so it will continue to fall. But if the impact of geopolitics intensifies, this is a positive factor.
So the current trading direction that can be determined is to continue to short.
In terms of trading, traders with large funds can sell at the current price, and those with small funds can wait until the market returns to above 59 to sell.
The band trading center continues to update new real-time trading opportunities. If you don’t know how to trade, or don’t want to miss the next real-time trading opportunity, remember to follow me.

What adjustments will be made to oil prices?If traders don’t know how to trade, they can refer to the strategy of the Swing Trading Center. Earlier, it was announced to sell at 57.24. The lowest price reached around 56.3, and now the oil price has returned to 57.24. How to trade? If you are also confused, you can refer to the views of the Swing Trading Center.
At present, the supply of oil prices exceeds the demand, and some oil-producing countries will continue to increase the production of oil prices. The market has never recognized that oil will become a slow-selling product. Oil prices can be allowed to fall. But oil is not allowed to have no production capacity. I like this sentence.
Oil prices are expected to be mainly adjusted in the short term. The clear trading instructions have been announced in the Swing Trading Center. Stay tuned. Prevent missing good trading opportunities.

Summary of the Crude Oil Market This WeekThis week, the crude oil market witnessed a significant decline. Brent crude oil dropped by a cumulative 8.3%, and WTI crude oil fell by 7.5%. Both recorded their largest single-week declines since the end of March.👉👉👉
OPEC+ convened a production meeting ahead of schedule and planned to discuss the production increase plan for June. The market bets that the probability of a production increase is as high as 70%. Previously, OPEC+ unexpectedly announced in April that it would increase daily production by 411,000 barrels starting from May, which is three times the original planned increase. This move aimed to punish member states that had overproduced oil. If production is further increased in June, it will further intensify the supply pressure on the market.
Although the geopolitical tensions in the Middle East region have intensified, such as the postponement of the fourth round of nuclear negotiations between the United States and Iran, which has, to a certain extent, provided support for oil prices, judging from the overall market situation this week, this supporting effect has failed to offset the impact of increased supply and decreased demand.
Overall, this week, under the intertwined influence of factors such as increased supply, uncertain demand prospects, and changes in the geopolitical situation, the crude oil market showed a significant downward trend. The market's expectations for crude oil prices are rather pessimistic, and it is expected that crude oil prices will still face certain downward pressure in the coming period. However, if OPEC+ changes its production increase plan, or if there is an unexpected improvement in the global economy, crude oil prices may rebound.

The decisive day of major data (USOIL)
Yesterday, it was pointed out in the analysis circle: The support of 58 needs to be tested. Sure enough, buying at low levels continued to expand profits. The current price is 59.6. From the pressure analysis, the market is still affected by data that oversupply, and institutions will not reduce production in a short time. Therefore, oil prices will fall further,
The oil price broke through 59. Due to supply reasons, the market still has a downward range. 60-61 is a good choice to sell in succession.
tp58-57

USOIL trading alerts. Pressure and support.Oil also fell according to instructions. I just forgot to remind you. Sorry, but the profit is quite good. Sell short from 58.7. Then the lowest reached 56.34
But today in the New York market, USOIL rose again above 58. From a fundamental perspective. The market will continue to fall under pressure. But from the trend, we need to pay attention to the support of 58. If it does not fall today, it is likely to continue to fall based on Friday's trend. The pressure level near 59 needs to be paid attention to. In terms of operation, it is still mainly selling at high levels.
Always remind trading risks. So don't ignore this. If you don't know how to trade. Remember to wait and see. Don't trade blindly or gamble.
Many investor friends know that I have led some investors to create good profits for several consecutive days. If you don't know how to trade, remember to leave me a message and try it. Maybe your profit will double.

Can oil prices continue to be shorted? Of courseSaudi Arabia made a major strategic shift, willing to accept low oil prices and unwilling to cut supply.
Oil prices fell sharply as a result.
It is expected that oil prices will hit 55-56 in the short term, so the operation is still mainly shorting oil prices. Overcapacity.

Short on Oil/Back to 57$ SOONI believe we can continue the retest of previous major support level at 65-66$ and fibonacci 0.618. This major support will be flipped to resistance in my opinion. We can see a significant sell-off back towards the 57$ area and below from this location.
I will be looking to enter a short trade from the 0.618 region/66$ if there is a rejection.
My mid-term/end-of-year prediction for US OIL is between 45-50$ and possibly lower.
If you believe in the fundamentals and idea of this setup, feel free to follow and use it.
Not financial advice.

USOIL ANALYSISHello friends
Everything is clear on the chart for you, our probability is price growth to the specified areas.
Be sure to observe risk and capital management.
*Trade safely with us*

Join me in being bearish on crude oil
Dear traders, remember to bask in the sun when your mood is moldy. Throw away what you should throw away, and don't think about the people you have missed. Life is boring, so make yourself relaxed and happy.
Crude oil has been running up recently. Yesterday, the daily line had a technical retracement under the pressure of 65.00. Today, we are still bearish. Let's continue to go short on the rebound. There is still a lot of room for crude oil shorts to fall. Today's crude oil rebounded near 64.00. If it breaks below 60.00, it will open up a new space for a big drop. The recent data and fundamentals of crude oil are suppressing it. Bulls predict a big rebound today.
Fundamental analysis
Operational suggestions
Crude oil------short near 64.00, target 63.00-62.00
Hello traders, if you have better ideas and suggestions, welcome to leave a message below, I will be very happy

Daily Analysis of USOILChanges in Crude Oil Supply and Demand:
Demand Side: China imposes tariffs on U.S. crude oil, raising the import cost and reducing the import volume. The United States imposes tariffs on energy imports from Canada and Mexico, affecting the crude oil exports of these two countries to the U.S., reducing the demand for crude oil in the United States and putting pressure on the price of USOIL 😟.
Supply Side: After China reduces its imports of U.S. crude oil, it increases imports from other exporting countries, changing the global crude oil supply pattern and possibly strengthening the expectation of a supply surplus. The decrease in U.S. crude oil exports may lead to an increase in domestic inventory, exerting downward pressure on the price of USOIL 😣.
💰💰💰 USOIL💰💰💰
🎯 Sell@61.0 - 61.2
🎯 TP 59.5 - 59.5
Traders, if you're fond of this perspective or have your own insights regarding it, feel free to share in the comments. I'm really looking forward to reading your thoughts! 🤗
The accuracy rate of our daily signals has remained above 98% within a month! 📈 We sincerely welcome you to join our channel and share in the success with us! 🌟

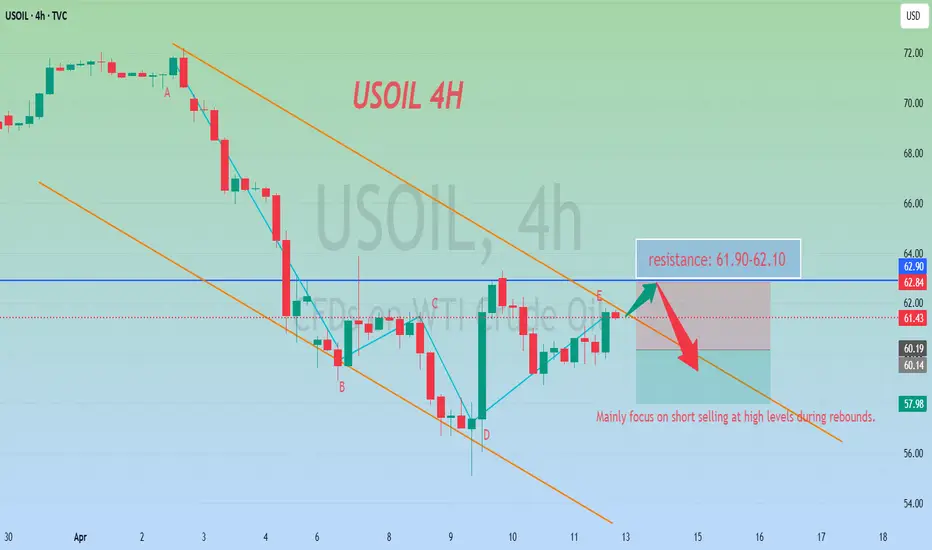
Choose to go short at high levels for crude oilThe price of crude oil is still fluctuating within a range and lacks clear directional momentum. The outlook remains bearish until it breaks through the $63.70 mark or there are clear factors stimulating demand. In the short term, the trend of oil prices is likely to remain confined to the current range. In terms of trading suggestions, it is advisable to mainly go short and go long as a supplement.
Oil trading strategy:
sell @ 61.90-62.10
sl 62.80
tp 61.20-61.00
If you approve of my analysis, you can give it a thumbs-up as support. If you have different opinions, you can leave your thoughts in the comments.

Strategic Analysis of Crude Oil for Next WeekBehind the current fluctuations in international oil prices lies the market's deep anxiety over the extreme uncertainty of global trade policies. Trump's "suspension + escalation" approach has, in the short term, stabilized relations with non - Chinese economies, but it has also dealt a blow to the global supply chain and energy consumption confidence.
In terms of the trading ideas for crude oil next week, it is recommended to mainly go short at high levels during rebounds and go long at low levels during pullbacks as a supplement. In the short term, pay attention to the resistance level in the range of 62.8 - 63.2. In the short term, focus on the support level in the range of 60.5 - 59.5.
Oil trading strategy:
sell @ 61.90-62.10
sl 62.80
tp 61.70-61.40
If you approve of my analysis, you can give it a thumbs-up as support. If you have different opinions, you can leave your thoughts in the comments.Thank you!
WTI Crude Oil Bearish Reversal Setup – Short from Resistance ZonEntry Point: 62.66 USD
Stop Loss: 65.26 USD
Target Point (Take Profit): 55.09 USD
Indicators:
EMA 200 (blue): 60.92 USD — long-term trend indicator
EMA 30 (red): 60.75 USD — short-term trend indicator
Analysis:
1. Bearish Setup:
The price is approaching a key resistance zone marked by the purple shaded area near 62.66.
The strategy is to short from this level, anticipating a drop to the 55.09 target area.
2. Risk/Reward:
Risk (SL - Entry): 65.26 - 62.66 = 2.60 USD
Reward (Entry - TP): 62.66 - 55.09 = 7.57 USD
Risk-to-reward ratio: ~1:2.9, which is favorable.
3. Support/Resistance Confirmation:
Multiple touches at the resistance zone (or
