USOIL, Best Place to open Long EntryCrash of USOIL Market is only temporary and this price cannot be rejected by any trader. The highlighted place of 10 dollars per barrel is the best historical price you can get to open a buy position for long-term. The Scalp can be targeted for 100% profit to place around 20.00 and swing trade to 300% if not even more. This trade is only AWESOME!
Usoiltrade

Good time to Oil buyOil drop to downtrend channel bottom. Bear candle is weakened 1 day candle shows support .
Buy oil now TP1 - 22.05 TP2 - 26.00
If you reach TP1 take half profit first then keeping your position.


Phenomenal long opportunity in USO?If you are an experienced professional trader, this one might interest you... Green box: 3.40-2.96. Green algo target at 3.31. If we make an extended 5, we may reach 1.92. In the meantime, watch that $17 support in the WTI. Again, for professionals only :grinning:

CFDS ON CRUDE OIL (WTI) USOIL LONG SET UPTITLE : BUY USOIL
ASSETS : COMMODITIE
SYMBOL : USOIL
ORDER TYPE : (EP1) LIMIT ORDER
(EP2) LIMIT ORDER
TF : 8hr
ENTRY PRICE 1: $20.28
ENTRY PRICE 2: $19.68
STOP LOSS : $16.71
TAKE PROFIT 1- $23.86
TAKE PROFIT 2- $26.68
TAKE PROFIT 3 -$30.86
STATUS: ACTIVE

usoil entering the$20 region where a strong ressistance is readywith a Major rejection at the 786 level of the fib, we saw a nice bearish movement to the first -27 level. we have some room of 100 pips to hit the $20.00 region which aligns with the -618 level. from that level, we can expect some sideways movement and a bullish push. especially now when Trump made a deal with the OPEC for a production cut, and China who is slowly getting the factories ready for production. we can expect a higher demand for usoil which can push the price to the 30-35 $ region.


CRUDE OIL (WTI):HITS KEY HISTORICAL LEVELS (GO LONG)TITLE : BUY USOIL
ASSETS : COMMODITIE
SYMBOL : USOIL
ORDER TYPE : (EP1) MARKET ORDER
(EP2) LIMIT ORDER
TF : 6 MONTH
ENTRY PRICE 1: $20.86
ENTRY PRICE 2: $18.68
STOP LOSS : $16.71
TAKE PROFIT 1- $23.86
TAKE PROFIT 2- $28.68
TAKE PROFIT 3- $30.86
TAKE PROFIT 4- $34.68
TAKE PROFIT 5- $40.86
STATUS : ENTRY 1 active

USOIL Fall Down - Good Oppurtunity - 10. APR. 2020.Looks like we're going to 18.
Test for the trend.
If we touch the 18, many people will go long.
We won't get a better chance like this.
This is not for financial advice but for education!
If you think its helpful leave us a comment or like!
Have a great day everyone!

USOIL Sell Update (+263 pips)See attached trade entry from yesterday below,
18:02:18 (UTC)
Tue Apr 7, 2020

Cl! Light Crude Futures Short Update (+200 pips) 18:00:12 (UTC) See attached trades from yesterday linked below
18:00:12 (UTC)
Tue Apr 7, 2020

USOIL Daily Risk Range - 13:19:54 (UTC) Tue Apr 7, 2020Previous Close: 28.34
Higher Bound: 30.40
Lower Bound: 17.81
13:19:36 ( UTC )
Tue Apr 7, 2020


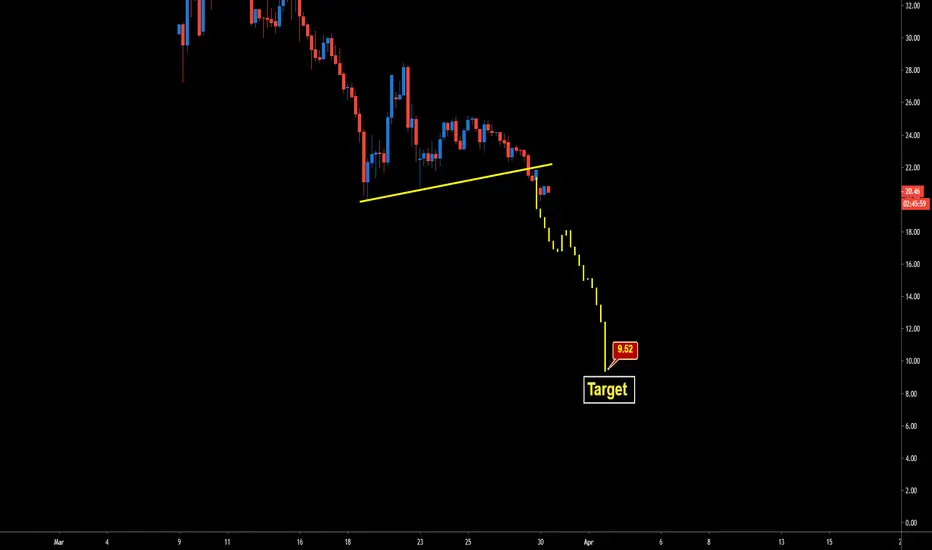
USOIL: Possibility to Drop till $10 Thanks for Taking Interested in my Trading Idea.
USOIL: Possibility to Drop till $10
Dear followers, the best Gift for me is "will be your likes , comments & Share
Note: This is only for Educational purposes; this is not investment advice.
Thanks for your support!
chance at a rejection after positive news from China and Russiawith a completed wave and a rejection at the 618 level, we expect that the price can make new higher highs. especially with the fact in mind that Russia started the conversation with the Saudis to stop the price war in the OIL. on the other hand, China recovering from the Covid-19. this can be a double impulse for a bullish oil.


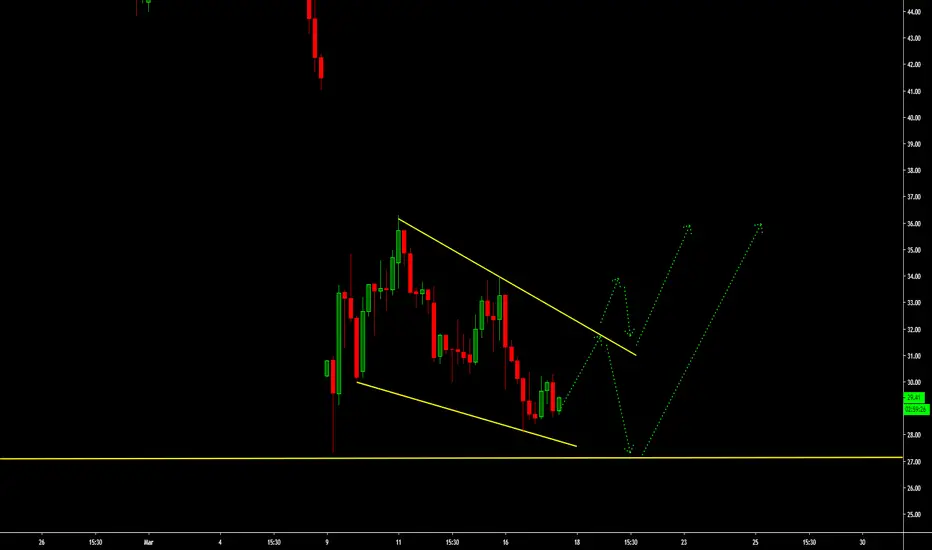
USOIL: Falling Wedge Pattern.Thanks for Taking Interested in my Trading Idea.
USOIL: Falling Wedge Pattern.
Dear followers, the best Gift for me is "will be your likes , comments & Share
Note: This is only for Educational purposes; this is not investment advice.
Thanks for your support!


CRUDE OIL (USOIL) DailyDates in the future with the highest probability for price direction reversals

USOIL output cuts to end of AprilWe highlighted this zone earlier this week. the price will probably bounce from this level. we will watch the $42 level closely.
