Can you buy SWN in US stock market ? 27/6/2022It is move in big sideway between 6.3 and 9.7
It is in lower band and test EXMA 200
Increase in volume
So you can buy it
Target 7.66 and 8.66 stop loss 6.23
money management is your responsibility
I recommend entering a maximum of 10% of the portfolio.
good luck
Usstockmarket

PG is Bullish!PG sets to complete its inverse head & shoulder formation which would shoot the price to an ATH. It is the best time to make an entry now with the formation of Bullish Harami Candle.
Also, Bullish Divergence, ABCD pattern and retracement of price from 0.5 Fib level supports the idea.
Entry - 156
Target - 165
Stoploss - 153
Disclaimer: Not a financial advise. Do your own due diligence.

AMGN: A High Probability Buy Setup Amgen Inc. has been trending up since December last year. We can observe that price has recently reached a higher high at the resistance level of 258.00. Therefore, we are only looking for buy entries for this stock.
258.00 is a very strong resistance level; we can see from the past that prices have rejected more than 9 times from this level. After rejections, prices retraced but eventually rose again to retest this level multiple times. Last week, price gapped down from this resistance level, dropping back to the trend line. Therefore, this gives us a great opportunity to buy the pullback.
Entry Criteria:
We can observe from the past price movement that when the price touched the current ascending trend line, a gap up immediately was formed, followed by a strong bullish momentum sending the price back to the previous high. Therefore, during the next few days, we will be looking for a gap up from the trend line. Then we will place our buy stop orders to capture the bullish momentum.
This is a high probability buy setup because many factors support another bullish impulsive movement which could potentially send the price back to retest the recent high.

S&P 500 Downfall?The S&P 500 is very close to signalling the start of a potential bear trend in the market,
something we have not seen since the 2007-2009 market crash.
Yes, we have seen some bearish moves since, but not a long-term bear trend that has
lasted for months/years.
If this does come to fruition, it will be bad news for bullish investors who have held
positions for years. But it will be good news for long-term trend followers who can
adapt to market conditions and invest in the direction of current trends.
Trend-followers are waiting for the opportune time to place short positions, but that
time is not yet, and patience will need to be applied.
The reason for us needing to apply patience is because the market can go either way.
Price, at the moment, is still inside an area of consolidation and has been since
January 4th 2022.
When price consolidates, it tends to bounce between the consolidation low support
level and the consolidation high resistance level, at $4114 and $4818, respectively.
Currently, price is approaching the support level and could just bounce from this level
and continue moving sideways between the support and resistance levels mentioned above.
But, if price breaks down below support, this will trigger us trend-followers to pay close
attention and be ready for a potential long-term bearish opportunity.
The first breakout of support is not what we are looking for, as this may turn out to be
a fake breakout and catches out the majority of investors.
A pattern of lower lows and lower highs below consolidation will give us the signal
to look for shorting opportunities.
Unless this happens, we will continue to stand aside as we are in an overall bull trend
which could resume if the support level holds. We will have to just stay on the sidelines
and watch and wait for the right moment.
If you like enjoyed this post, make sure to like, and follow for more quality content!
If you have any questions or comments, comment below. We reply to every comment!
See below for more information on our trading techniques.
As always, keep it simple, keep it Sublime.

#SP500 IS IN DOWNTREND CYCLE?#SP500 is in a down phase since March 2022
- On the daily time frame, the bearish structure is forming sustainably with the continuous creation of HL-LL (Higher low, lower low); The price line has lost its balance and is completely below the averages;
The important support zone at 4170 has broken down, supporting the mid- and long-term correcting trend;
- On weekly time frame, the index is moving sideways with a amplitude of ~10%; we can easily see that a double top pattern is forming, and when combined with a downtrend structure => It is in favor of continuing the strong correcting trend in the next period;


BABA Trend analysis and SIGNALThe price falls to the specified limit
Be sure to stick to Stop Lost and TAkE Profit. This is an idea and not a bargain offer

AMZN WAVE AND PATTERN ANALYSIS Be sure to stick to Stop Lost and TAkE Profit. This is an idea and not a bargain offer
It has the structure of an ABC FLAT Failure Irregular and the price is likely to go down to the specified range

GOOGLE WAVE AND PATTER ANALYZING Be sure to stick to Stop Lost and TAkE Profit. This is an idea and not a bargain offer
The onset of the recession, which could last until 2025 and even 2028

NVIDIA WAVE AND PATTERN ANALYSIS The correctional structure, especially the three waves, whether in descending or ascending and pulse correction, indicates the formation of a diametric pattern. For the formation of wave b, which is another sign of diametric wave formation in wave a and g, in 1999 and 2019, respectively, we see diametric waves in their microwaves.
In the case of the formation of this structure, we will see a deep decline in many companies listed on the US stock exchange, which will last for several years and we are at the beginning of a possible major recession.
This post is just a personal idea and analysis should not be the criterion for buying or selling


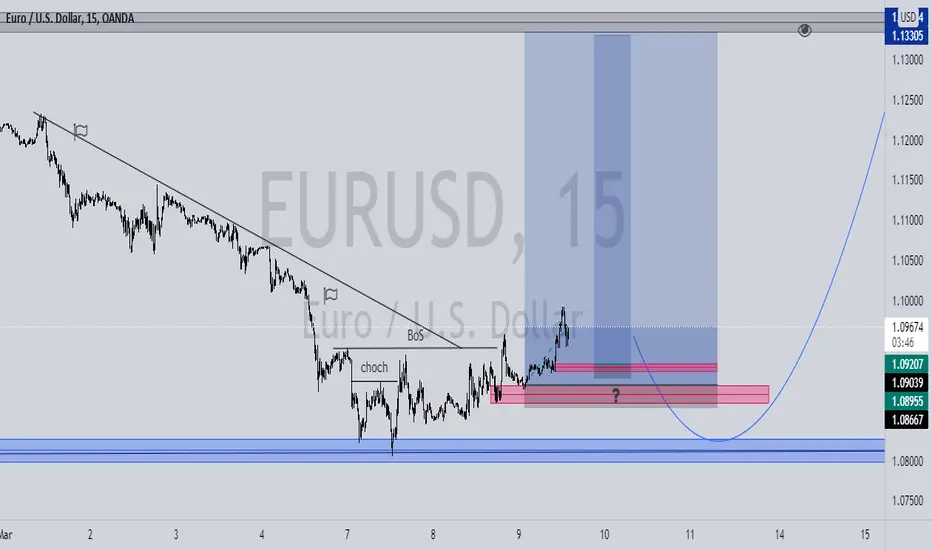
EURUSD_UPDATEAn entry we had of EURUSD still flying_due to heavy weighing fundamentals on us stock, we are expecting EUR to overpower it for a while
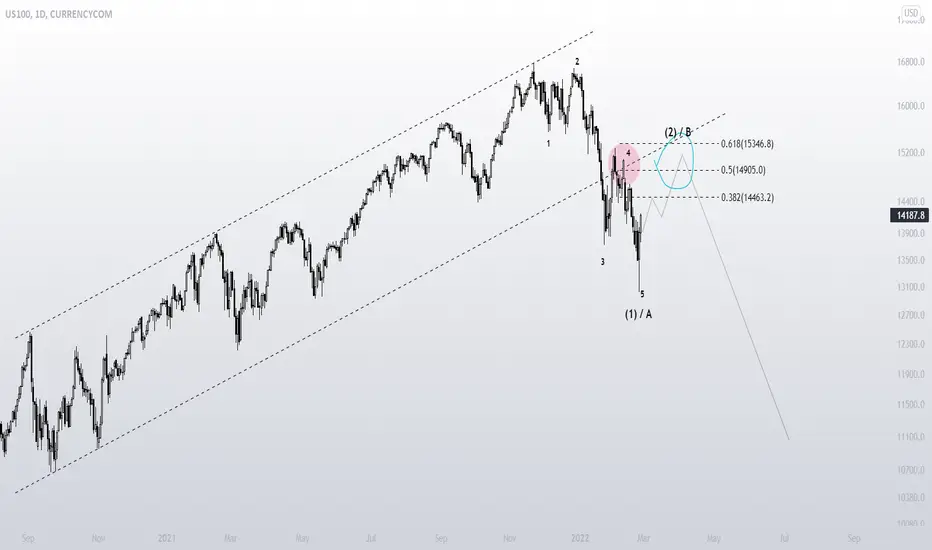
NASDAQ - Is the stock market alive now?NASDAQ. US100.
Under technical terms, and by using the principles of the Elliott Wave Theory, the market is likely to remain bearish for a longer duration after making a correction bullish wave. The previous move can be termed as wave 1 consisting of 5 sub-waves, and we can expect a corrective pattern up to 50% - 61.8% fib. level.
We can also assume that there is a lot of fear in the stock market in this current situation. Because of this, investors may start selling off at the technical levels. Furthermore, we have been expecting an interest rate hike this year (actually multiple times?), and we might get to see that happen soon.
While the market may go up in the next few weeks (corrective move?), there are far more reasons for a decline in the coming months.
Manage risk while trading / Investing.
This analysis is based on the Elliott Wave Theory and the current fundamentals with some expectations/assumptions.
S&P 500 by CryptoTradersWWYesterday was a day of extreme volatility, as expected. The US stock market has lost a key support level and is again retesting this zone, which is currently acting as resistance.
If we have a rejection on a retest like this, we will see more downward movement.
As we all know, once the New York session begins, the US Market has a strong link with BTC, anticipating market changes.
<---------------------------->
☑️ Follow, Comment & Like
☑️ Create a civil and healty discuss in the comments and share with me your thoughts
Thanks and Happy Trading!

FACEBOOK : 44% Down! Should you invest?Facebook is almost 45% down from its top. There was some news of its daily user which plunges the stock to drag down. But, fundamentally speaking it has strong financials. Currently it is testing the FY Low of 2021 and a strong Financial Quarter (FQ) high of 2020 7 also hedging towards a strong Monthly level near 210 $ making 215 $-210 $ a strong support level. Leta watch and study the price action at those levels.
Please do write in comment section about your views.
Thank You! Happy Investing!
NB: The chart analysis is for educational purpose only. Its full my personnel view. Place your trade/investment before consulting your financial advisor only.

NASDAQ UP Trend.!#NASDAQ Looking for Buy trade setup as I mentioned in the Chart.!
Keep Supporting LIKE, COMMENT And FOLLOW.!
Thank You.!

SP500 4 possible scenariosSP500 has shown some weakness in the beginning of 2022...
All of us know that one of the most important reason behind such a 12% drawdown is Fed hawkishness...
At the time of writing smart money traders are pricing at least 5 interest rate hikes by the end of 2022, which is obviously putting pressure on the US stock market.
''Money today worth more than money tomorrow''
In addition to that we'll have QT most probably from the second quarter of this year.
On the chart I am showing 4 possible scenarios (maybe someone will see even more) of price movement from technical POV.
Fundamentally speaking I think and believe that we are going to see ATH this year around 4950-5000 zone at least. Also it is quite possible that we will see another lower low this year.
This week we had great results from such tech giants as MSFT and AAPL, which in my opinion is and will remain one of the most important bullish supporter.
We can see a very weak momentum and RSI or MACD indicators in the oversold territory. Also, huge volumes entered the market on the ''panic'' last week.
I hope to see a strong rebound in the short-mid term.
All the best,
GIgor_021
#tothemoon


which one? Back to the bull or investor will cryWell, SP500 will show us the real face soon. keep watching stay tune !!
My predict the market will clearly direction on FEB to March.

US30 Live US30 Trade. But this is my personal view. This is not any kind of call or tip. Please consult your financial advisor before taking and position.

Buy SI 13/1/2022You can buy SI target 189.3 stop loss 109.3
Money management your responsibility.
I recommend entering a maximum of 10% of the portfolio.
Good luck

NASDAQ - support and resistanceNASDAQ / US100 support zones :
After taking support at 15160, Nasdaq seems to be heading for 16670 as forming HH / HL

Buy PHUN 12/1/2022You can buy PHUN target 4.1 stop loss 2.21
Money management your responsibility.
I recommend entering a maximum of 10% of the portfolio.
Good luck
