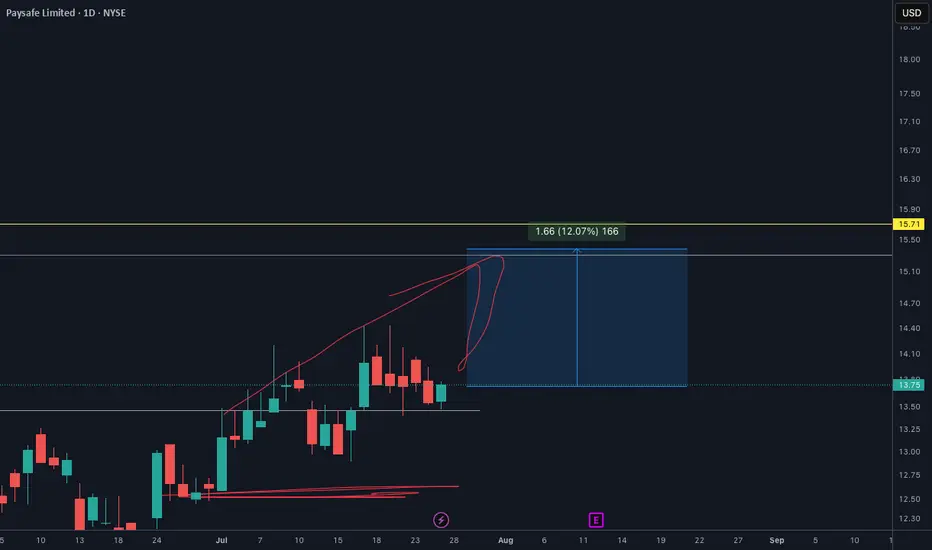
PSFE will EXPLODE soon. Make sure you check out my analysisPSFE price target is definetly $15.30. And It will happen so soon I see.
I shared this one on my youtube channel and X as well. You make sure go to my profile and follow for more.
Usstocks
Market Mood Sours as Inflation Surprises AgainU.S. stock markets were under pressure on Tuesday after new inflation data came in higher than expected. This has made investors rethink how soon the Federal Reserve might cut interest rates.
What Happened?
● The Consumer Price Index (CPI) recorded its biggest monthly rise in 5 months.
● Core inflation (which excludes food and energy) jumped by 2.9% compared to last year — more than the Fed's 2% target.
What It Means
● Investors had expected the Fed to cut interest rates multiple times in 2025.
● After the inflation report, they now think the Fed will cut less than expected.
● The chances of a rate cut in September also dropped sharply.
Market Impact
● Bond yields went up — the 10-year U.S. government bond yield rose to 4.49%, making borrowing more expensive.
● Stock futures fell (Dow, S&P 500, Nasdaq), as higher yields tend to hurt company profits and stock prices.
S&P 500 and Dow Struggle at Resistance
● Both the S&P 500 and Dow Jones faced resistance near all-time highs.
● This rejection suggests potential for further short-term pullback, especially if macro pressures like inflation and rate uncertainty persist.
Near-Term Outlook
With inflation running hotter than expected, hopes for early Fed rate cuts have cooled. Traders and investors should remain cautious, manage risk actively, and prepare for continued volatility in the coming weeks.

Tesla (TSLA) -Bullish Reaccumulation Setup | Smart Money conceptTesla shows a clean CHoCH followed by BOS structure, indicating a potential bullish continuation. The market is forming equal lows into a demand zone (green box), suggesting a possible liquidity sweep before a move higher.
Key Technical Points:
CHoCH (Change of Character) confirmed on strong bullish impulse.
BOS (Break of Structure) signals market intent to continue upward.
Ascending triangle structure with multiple support tests (marked "S").
Anticipated sweep into demand zone: $308–$312 area.
Potential upside target: $365–$375 supply zone.
Bias: Bullish on confirmation of demand reaction.
Disclaimer:
This is not financial advice. Always do your own analysis before investing.

GH (Guardant Health) — Breakout Setup with Strong Upside PotentiGuardant Health (GH) is showing signs of completing a long-term accumulation phase and transitioning into a bullish trend. After breaking out of a major descending trendline and holding above key resistance at $38.30, the stock entered a tight consolidation range — a classic base formation before a potential breakout.
Technical Highlights:
– Confirmed trendline breakout
– Price is consolidating above previous highs
– Entry zone around $50–$51
– First target: $70 (+40%)
– Second target: $103 (+100% from current levels)
Fundamental Support:
Guardant Health is a leading precision oncology company specializing in liquid biopsy technologies for cancer screening and monitoring. The company continues to expand its product offerings, especially in early cancer detection — a market with huge long-term growth potential. Recent news includes positive developments in clinical trials and expanded partnerships, which could significantly boost revenue.
Institutional interest in GH has also been rising, with increased buying activity visible in the most recent 13F filings. The overall market sentiment toward biotech stocks with strong data pipelines is improving, which further supports the bullish outlook.
Conclusion:
GH is a strong candidate for medium- to long-term growth. The technical setup aligns with a fundamental narrative of innovation and market expansion. Partial profit-taking could be considered at $70 and $103. Due to the volatility of biotech stocks, proper risk management and position sizing are essential.

S&P 500 (SPX) 1M next week?The S&P 500 is pulling back from a key resistance after completing a bearish AB=CD pattern on the monthly chart. Price action suggests a potential correction toward the 4662–4700 zone, aligning with the 0.618 Fibonacci retracement level, which may serve as a key area for bullish reaccumulation. Momentum indicators show bearish divergence, hinting at a cooling rally.
Fundamentally, the index remains supported by strong earnings in tech and AI sectors, but risks persist from elevated interest rates, sticky inflation, and potential Fed policy shifts. A pullback into the 4662–4700 zone may offer a medium-term setup for continuation toward 5198 and potentially 5338. A breakdown below 4662 would invalidate the bullish structure and shift focus to lower Fibonacci levels.

My buy view for BlackBerryMy buy view for BlackBerry.
This stock has pushed up about 60% following the draw down from the US tariff.
I am still bullish on this stock.
My buy thoughts are on the chart

California Resources Corporation (CRC) – Stock Analysis and ForeCalifornia Resources Corporation, a key player in crude oil production and carbon management, has recently experienced a notable uptick in investor interest.
This momentum appears to be supported by macroeconomic tailwinds, including renewed trade tensions between the United States and other major economies.
Historically, geopolitical uncertainty often leads to increased energy demand and price volatility, both of which tend to benefit domestic oil producers like CRC.
From a fundamental standpoint, investor sentiment toward CRC has grown increasingly positive. The company’s strategic positioning in California's energy transition—particularly its focus on carbon capture and storage (CCS)—is beginning to resonate more with institutional investors looking to align portfolios with sustainable yet profitable energy operations.
If these supportive fundamentals continue, there is potential for the stock to reach $56 in the coming months, assuming no major changes to current market dynamics or geopolitical influences.
Technical Outlook:
Entry Point: $44.68
Stop Loss: $42.73
Take Profit 1: $50.84
Take Profit 2: $55.88
As always, trade with care, apply proper risk management, and ensure your positions align with your overall investment strategy.
If you find this helpful, kindly follow me, subscribe, like, comment and share.

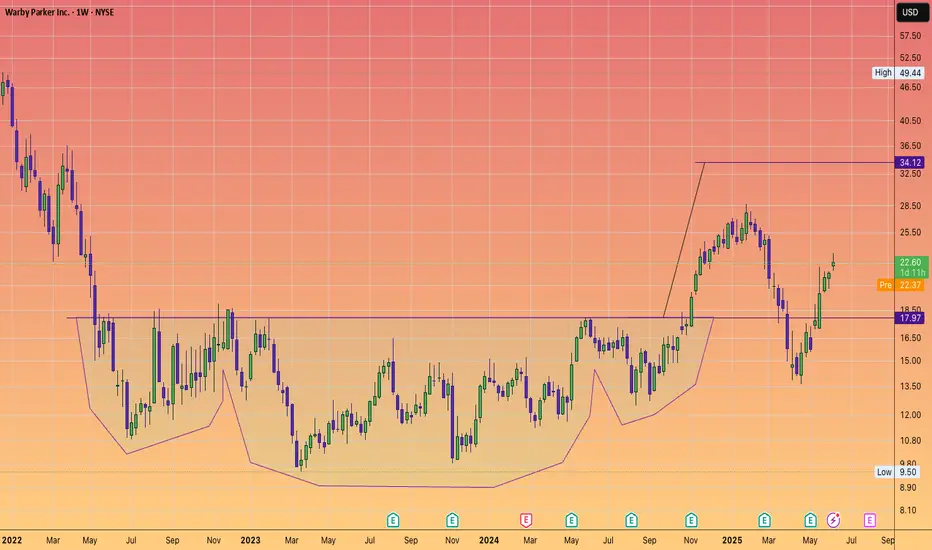
WARBY PARKER to continue its recovery to $34 and beyond#inverseheadandshoulders
They want to have 900 retail locations
currently operating 271 in the US and 5 in Canada.
SPX 500 to 17,000 in 7 years.This chart represents the S&P 500, showcasing its performance over time, including quarterly data.
It captures everything.
Every recession.
Every war.
Every president.
Every variation of the monetary base as superpowers rise and fall.
Whenever I hear a bear in the stock market declare that THE TOP has been reached, and we are about to CRASH -50% to -90%
I find myself drawn to these comprehensive long term charts.
If the bulls are genuinely in control and we have merely undergone an intermediate-term correction, then the long-term bull market that commenced at the 2009 low remains robust, with many more years ahead.
The chart also illustrates that the three significant bull market phases typically last around 18-20 years following a major breakout.
And they yield a comparable number of X's.
It's all quite fascinating, if you ask me.
See you in the future!

$TJX with a bullish outlook following its earnings #StocksThe PEAD projected a bullish outlook for NYSE:TJX after a negative under reaction following its earnings release placing the stock in drift D with an expected accuracy of 50%.

$INTU with a bullish outlook following its earnings #StocksThe PEAD projected a bullish outlook for NASDAQ:INTU after a positive under reaction following its earnings release placing the stock in drift A with an expected accuracy of 71.43%.

$CSCO with a bullish outlook following its earnings #StocksThe PEAD projected a bullish outlook for NASDAQ:CSCO after a positive under reaction following its earnings release placing the stock in drift A with an expected accuracy of 75%.

$WMT with a bullish outlook following its earnings #StocksThe PEAD projected a bullish outlook for NYSE:WMT after a negative over reaction following its earnings release placing the stock in drift C with an expected accuracy of 66.67%%.

$HD with a bullish outlook following its earnings #StocksThe PEAD projected a bullish outlook for NYSE:HD after a positive over reaction following its earnings release placing the stock in drift B with an expected accuracy of 80%.

Trump Delays Tariffs, but Trade Tensions with EU Are Heating UpDonald Trump is back in headline mode — and this time, the EU is in his crosshairs.
After weeks of relative calm, the US President reignited global trade tensions by announcing a 50% tariff on all EU imports. But in a surprise twist — and in true reality-TV fashion — he’s now pushed the start date from June 1 to July 9.
So Europe gets a five-week stay of execution. Lucky? Or just stuck in limbo?
Let’s dive into what it means for markets, why traders aren’t exactly panicking yet, and whether this is just another Trump bluff — or a prelude to Trade Wars, Season 2.
🍝 All EU Imports — Yes, Even the Pasta
Trump’s post-holiday bombshell would slap a sweeping 50% tariff on everything from French wine and Italian olive oil to German sedans and Spanish ham.
His reason? Brussels is “dragging its feet,” and Trump, never one to shy away from drama, says enough is enough.
Cue the “America First” soundtrack.
But with the tariff now rescheduled for July 9, markets are interpreting this as more of a pressure tactic than an immediate economic hammer. A cooling-off period? Or the calm before the tariff storm?
👀 Markets Blink — But Just Barely
When the initial June 1 announcement hit Friday, Europe’s Stoxx 600 TVC:SXXP dropped about 1% — not exactly a meltdown, more like a “here we go again” shrug.
US stocks , which are closed for Memorial Day Monday, had already wrapped Friday in the red. Investors were digesting the potential for yet another trade war rerun — just when things were starting to feel a bit less chaotic.
The new July 9 date has offered some breathing room, but it hasn’t erased the risk. Instead, it’s created a countdown clock for volatility — one that traders can’t ignore.
⏳ Bluff or Battle Plan?
Trump’s tone this time is more poker table than podium.
“That’s the way it is,” he told reporters.
“Our discussions with them are going nowhere!” he posted on Truth Social.
“I’m not looking for a deal — we’ve set the deal: 50%.”
Still, the sudden five-week delay suggests there might be some wiggle room behind the scenes. Maybe it’s about giving Brussels time to blink. Or maybe it’s about giving voters time to rally.
🧐 Should Traders Be Freaking Out?
Short answer: No.
Slightly longer answer: Not yet.
While the tone feels sharper and the numbers bigger, traders have learned one thing about Trump: even the most dramatic threats often serve as negotiation leverage.
That said, this isn't 2018. The global economy is more fragile. Rates are higher. Consumer fatigue is real. And if this escalates into tit-for-tat tariffs, the recovery narrative could hit a speed bump — just in time for earnings season.
So traders should:
Keep an eye on EU-exposed sectors — autos, luxury goods, industrials
Monitor the FX space — especially EUR/USD volatility
Watch the earnings calendar for reports from multinationals with eurozone exposure
Stay alert for a potential 3 a.m. Trump pivot post
And maybe keep one tab open for the Brussels response
🌱 A New Deadline, Same Old Drama
So, is this real? Maybe. Is it priced in? Partially. Is it over? Definitely not.
The July 9 date might delay the fallout, but it also means the headlines — and market jitters — aren’t going anywhere. Investors now have five more weeks of speculation, positioning, and potential volatility as the transatlantic trade story unfolds.
And if you’re sitting on European exposure? Maybe don’t go full “buy-the-dip” mode just yet. More like a “watch the tape, prep your hedges, and don’t believe everything you read is final.”
Your turn: are you fading the noise or surfing the chaos? Let us know how you’re playing the next move in this global chess match.

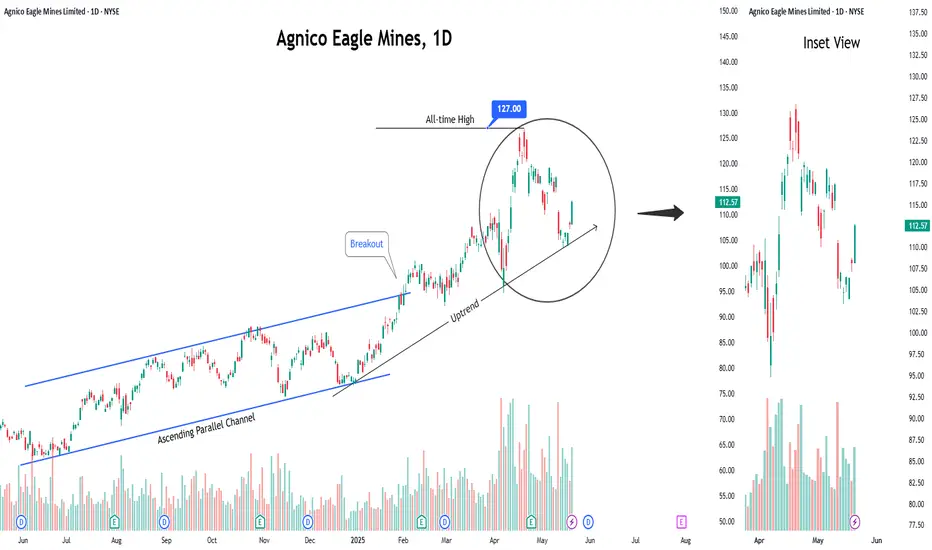
Buy Agnico Eagle Mines LimitedShort Term Trading Advice by Naranj Capital
Buy Agnico Eagle Mines Limited
● Buy Range- 108.5 - 112
● Target- 116 - 118
● StopLoss- 104.5
● Potential Return- 4-5%
● Duration- 14-15 Trading Days
Merck & Company Potential Post Tariff Resolution Bullish RallyWith potential developments towards the resolution of global tariffs and pharma being defensive in general, MRK price action seems to exhibit signs of a potential Bullish reversal breakout as the price action may form a prominent Higher High with multiple confluences through key Fibonacci and Support levels which presents us with a potential Non-Leverage hold opportunity.
Entry: (Buy 1 CMP 76.2 & Buy 2 87.6)
Stop Loss: 45 or 0 (depends on trading style as Non-Leverage Buy & Hold is recommended)
Potential Range for Targets: 130 - 170

Primoris Services: A Long-Term Pick in US Energy Infrastructure◉ Abstract
Our latest analysis focuses on the booming U.S. utility and energy sector, set to hit a massive $1.1 trillion! Learn about the key drivers fueling this growth, from our increasing electricity needs and the electric vehicle revolution to the exciting rise of clean energy.
We have also given a “Buy” rating on Primoris Services Corporation NYSE:PRIM , a major player in building this energy infrastructure. Our analysis reveals their strong financial performance, attractive valuation compared to its peers, and promising technical indicators. While acknowledging potential headwinds like regulatory shifts, we believe Primoris presents a compelling long-term investment opportunity with significant upside potential. Read detailed analysis here and invest smartly.
Read full analysis here...
◉ Introduction
Imagine the companies that bring electricity to your home, the gas for your stove, and are building the future of clean energy. That's the U.S. utility and energy sector! It's a massive part of the American economy, and it's getting even bigger. By 2025, experts predict it will be worth a whopping $1.1 trillion! This includes everything from generating electricity to delivering it through power lines and pipelines, as well as distributing natural gas across the country.
This sector has been steadily growing at about 2.7% each year between 2020 and 2025, and it looks like this growth is going to continue. This article will give you a snapshot of the major reasons behind this growth, top players in this sector, and investment opportunities.
◉ Major Factors Behind the Growth of US Energy Sector
1. Electricity Use is Climbing: Americans are using more power than ever. The EIA expects electricity consumption to hit 4,205 Billion kWh in 2025, up from 4,097 Billion kWh in 2024. This surge is fuelled by increased usage in residential, commercial, and industrial sectors.
2. Everything’s Going Electric: Think about electric cars, heat pumps that heat and cool homes, and even cleaner machines in factories. More and more things are switching to electricity, which means we need even more power! This big shift towards using electricity is called electrification, and it's a major driver for the energy sector.
3. Clean Energy on the Rise: Solar panels and wind turbines are becoming a bigger part of how we get our electricity. These renewable energy sources are growing fast. By 2026, it's expected that they will provide about 27% of all the electricity in the U.S., up from around 25% in 2024. This move towards cleaner energy is really important for the future.
4. Massive Investments Ahead: To keep up with this growing demand and the shift to new technologies, utility companies are investing a lot of money. They are upgrading power grids (the network of lines that deliver electricity), building charging stations for electric vehicles (EVs), and using smart technologies to manage energy better. Experts at S&P Global predict that total spending on these things could be over $790 Billion between 2025 and 2030!
◉ Big Players in Building the US Energy Infrastructure
1. Quanta Services, Inc. NYSE:PWR : A premier provider of specialized infrastructure solutions for the electric power and oil & gas sectors. They are also heavily involved in renewable energy projects like solar and wind farms. You can learn more about them on their official website .
2. Primoris Services Corporation NYSE:PRIM : They provide construction and engineering services for the energy, utility, and infrastructure markets. They are increasingly focusing on building projects related to renewable energy. You can explore their details on their official website .
3. MasTec, Inc. NYSE:MTZ : This is a top infrastructure company in North America, working on energy, utility, and communication projects. This includes building renewable energy facilities, telecom networks, and oil & gas pipelines. You can find more information on their official website .
This report offers an in-depth analysis of Primoris Services Corporation , a prominent player in the U.S. energy infrastructure space.
Our long term recommendation is backed by Primoris Services Corporation ’s technical analysis and fundamental performance.
◉ Investment Advice
💡 Buy Primoris Services Corporation NYSE:PRIM
● Buy Range - 67 - 68
● Sell Target - 88 - 90
● Potential Return - 30% - 45%
● Approx Holding Period - 12-14 months
◉ Revenue and Profit Analysis
● Year-on-Year
- In FY24, Primoris reported revenue of $6,367 Million, marking an 11% increase from $5,715 Million in FY23.
- EBITDA grew to $415 Million, up from $366 Million the previous year, with the EBITDA margin slightly improving to 6.5% from 6.4%.
● Quarter-on-Quarter
- Q4 FY24 revenue reached a record $1,741 Million, up from $1,649 Million in Q3 and 14.9% higher than $1,515 Million in Q4 FY23.
- Despite the revenue growth, Q4 EBITDA declined to $110.6 Million from $123 Million in Q3.
- Diluted EPS (LTM) rose to $3.30 in Q4, up from $3.00 in Q3 FY24, indicating solid earnings momentum.
◉ Valuation
1. P/E Ratio (Price-to-Earnings)
● Compared to Peers:
- PRIM’s P/E is 17.9x, much lower than the peer average of 32.7x. This means the stock is cheaper than most competitors based on earnings.
● Compared to Industry:
- With a P/E ratio of 17.9x, PRIM trades below the industry average of 26.4x, suggesting it offers strong value within the sector.
2. P/B Ratio (Price-to-Book)
● Compared to Peers:
- PRIM’s P/B is 2.6x, while peers average 4.5x—again showing the stock may be undervalued.
● Compared to Industry:
- Compared to the industry average of 4.4x, PRIM still appears to be a bargain.
3. PEG Ratio (Price/Earnings to Growth)
PRIM’s PEG ratio is 0.43, which suggests the stock is not only cheap but also expected to grow earnings strongly—an attractive combination for investors.
◉ Cash Flow Analysis
- Primoris saw a strong improvement in operating cash flow, which jumped to $508 Million in FY24 from $196.8 Million in FY23—a sign of better cash generation from its core business.
◉ Debt Analysis
- With a debt-to-equity ratio of 0.42, the company maintains a solid financial position, suggesting its debt levels are well under control and not overly risky.
◉ Top Shareholders
- The Vanguard Group holds a substantial 11.6% stake in Primoris, reflecting strong confidence in the company.
- BlackRock also increased its investment by 9.65% from Q3 FY24 and now owns approximately 11.3% of the company.
◉ Technical Aspects
- On the monthly chart, the price is in an overall uptrend and has bounced off the trendline support, indicating continued upward momentum.
- On the daily chart, the price has broken through a rounding bottom pattern and is holding above the breakout zone, suggesting a potential for further upside movement.
◉ Potential Risks & Challenges
1. Regulatory Uncertainty: Ongoing concerns about global trade policies, tariffs, and regulatory changes, especially in the solar and battery storage markets, could impact future project economics and timing.
2. SG&A Expenses: Increased by $10.9 Million year-over-year, driven by higher personnel costs and $3.2 Million in severance expenses.
3. Energy Segment Backlog: Experienced a decrease due to the timing of new solar awards, potentially affecting future revenue visibility.
◉ Conclusion
Primoris Services Corporation NYSE:PRIM stands out as a promising investment, backed by consistent growth, strong financials, and a strategic focus on renewable energy and infrastructure. Despite facing risks like regulatory changes and backlog fluctuations, its solid position in the U.S. energy sector—especially with increased demand for clean energy solutions—gives it a clear path forward. With a competitive valuation and support from major investors like Vanguard and BlackRock, Primoris is poised for sustainable growth, making it an attractive long-term opportunity for investors.

Buy Agnico Eagle Mines LimitedShort Term Trading Advice by Naranj Capital
Buy Agnico Eagle Mines Limited
● Buy Range- 116 - 119
● Target- 125 - 126
● StopLoss- 112
● Potential Return- 5-6%
● Duration- 14-15 Trading Days

US Stocks Pare Back All Tariff-Fueled Losses. Are We So Back?Remember “Liberation Day”? The one that felt more like Liquidation Day ? When markets tanked, tickers turned red, and you were afraid to check the markets on the next day? Well, turns out the rumors of the market’s demise were — once again — greatly exaggerated.
If the average recession 10 years ago lasted two years, this year’s recession was approximately 37 minutes (more or less, depending on the day).
Just a month ago, the S&P 500 SP:SPX started crumbling to the point it entered into correction territory (and then got out of correction territory ).
Long story short, it took the punches, went down 15%, stood back up, and is now throwing jabs with a nine-day winning streak — its longest since 2004, when iPods were still a thing and Facebook was just for Harvard students.
So… are we back? Like, really back? Let’s dig in.
💰 Trillions Lost, Trillions Found
On April 2, President Donald Trump dropped the hammer — or rather, the online post — unveiling his “reciprocal tariffs,” which, in true Trumpian fashion, sounded equal parts policy and promo PR.
Markets didn’t take it well. Global stocks collectively threw a tantrum. The S&P 500 dropped like it had a brick in its pocket . Financials cratered, energy took a gut punch, and tech? See for yourself — we don't want to talk about it .
But now? The dip buyers are shopping up, scooping up, snapping up everything from banks to oil stocks to beleaguered megacaps. Suddenly, all those stock discounts look like missed opportunities, and the cash-on-the-sidelines traders are jumping in.
👌 Jobs Data: Not Too Hot, Not Too Cold
Friday was a good day. Why? Because April’s nonfarm payrolls ECONOMICS:USNFP report came in at 177,000 jobs — not too strong to trigger Fed-tightening fears, not too weak to imply economic decay. It was the goldilocks print.
The number was a drop from March’s revised 185,000, but what mattered was the beat: economists had pencilled in just 135,000. Markets took that as permission to throw a party.
The S&P 500 jumped 1.5%, reclaiming the level it had before Trump’s tariff tirade and putting an emphatic end to the selloff. Nine green days in a row? That’s a bull flex Wall Street hasn’t seen in two decades.
💥 Truth Social Posts That Move Markets
Not to be left out of the celebration, Trump hopped onto Truth Social with his usual caps lock enthusiasm:
“THE FED SHOULD LOWER ITS RATE!!!”
Sounds familiar?
Still, even without a rate cut (for now), the market got what it wanted: signs that the US labor market isn’t collapsing, trade talks might be back on the table, and the economy hasn’t lost its way.
😌 A Global Sigh of Relief
While the US led the rally, global markets also joined the rebound chorus. China’s commerce ministry chimed in Friday, saying Washington had expressed a “desire to engage in discussions.” In market-speak, that translates to: "Everyone calm down — we might not blow this up after all."
It doesn’t take much to change sentiment. A tweet here, a headline there, a hint of diplomatic progress — suddenly risk appetite returns and everyone forgets they were panic-selling just three weeks ago.
But don’t go lining up the espresso martinis just yet — not everything is fully recovered. The US dollar, for example, remains nearly 4% below its pre-tariff-announcement level.
🤔 We Are So… Back?
So are we officially back? Short answer — “put the word out there that we back up” for now . Markets are up, volatility is down, and everyone’s pretending they didn’t sell the dip at the worst possible time.
But — and you knew there’d be a “but” — caution still applies. Trade tensions aren’t over. The next Trump post could shake things again. The Fed hasn’t made its next move (that’s coming this Wednesday). And geopolitics remains a powder keg.
Still, what this rebound tells us is clear: the market has resilience. Maybe not logic. Maybe not grace. But resilience? Yes.
It also reminds us that trying to time news-driven selloffs is a dangerous game. Often, the best trades happen when fear peaks and everyone else is running for the hills.
👉 Final Thoughts: Watch the Calendar, Not the Chaos
The key takeaway from this tariff-to-rally rollercoaster? Markets can move fast — but they can also recover faster. If you panicked, you probably sold low. If you stayed focused, checked the earnings calendar , and remembered that market narratives shift like wind direction, you're probably doing well right now.
We’re so back — for now. But stay sharp. This market may have nine lives, but it also has the attention span of a toddler.
Your move : Did you ride the dip? Buy the bounce? Or just mute the chaos and sip your coffee? Drop your best “Liberation Day to Redemption Rally” trade below.

Invest in STRL: Ride the Coming US Digital Infrastructure Surge◉ Abstract
Sterling Infrastructure (NASDAQ: STRL) is a top pick to benefit from America's digital infrastructure boom, with the sector expected to grow 26% annually through 2034. The company specializes in data centers, 5G networks, and smart city projects, supported by a $1 billion backlog and improving profit margins. While risks like regional market shifts and housing demand exist, STRL's fundamentals are strong—revenue grew 7% in 2024, debt is manageable, and its P/E ratio (17.9x) looks cheap compared to peers (70.5x).
Technically, the stock shows bullish patterns after pulling back 35% from highs. With government infrastructure spending rising and strategic acquisitions likely, STRL could deliver 35-40% returns in the next 12-14 months. A good option for long term investing!
Read full analysis here...
◉ Introduction
The U.S. digital infrastructure market, valued at approximately USD 140 billion in 2024, is expanding rapidly, with a projected CAGR of 26.4% through 2034. This growth is driven by factors like the expansion of 5G networks, increased demand for data centers, rising cloud services adoption, AI automation, and investments in smart cities and edge computing. The 5G infrastructure segment alone is expected to grow at a CAGR of 20.2%, reaching USD 17.26 billion by 2030. North America holds a 42.8% share of the global market.
◉ Key Trends and Opportunities
1. Data Centers: Demand continues to rise, driven by cloud computing, AI, and data-intensive applications. Power availability and location are becoming critical, with providers moving to secondary markets to secure reliable energy sources.
2. Fiber Networks: Expansion is underway to support new data centers and remote connectivity needs. Middle-mile and long-haul fiber, as well as fiber-to-the-home (FTTH), are key areas of investment and consolidation.
3. 5G and Wireless: Ongoing rollout of 5G networks is fueling growth in hardware and network densification, with increased activity expected in wireless infrastructure and tower markets.
4. Edge Computing and Smart Cities: The proliferation of IoT devices and smart city initiatives is driving demand for edge data centers and low-latency networks.
5. Mergers and Acquisitions: The market is seeing consolidation, especially in fiber and data center segments, as major players acquire smaller firms to expand their footprint and capabilities.
Today, we’ll focus on Sterling Infrastructure (STRL), a key player navigating the U.S. infrastructure market.
This report provides a detailed look at STRL's technical and fundamental performance.
◉ Company Overview
Sterling Infrastructure Inc. NASDAQ:STRL is a U.S.-based company specializing in e-infrastructure, transportation, and building solutions. It operates through three key segments: E-Infrastructure Solutions, which focuses on site development for data centers, e-commerce warehouses, and industrial facilities; Transportation Solutions, handling infrastructure projects such as highways, bridges, airports, and rail systems for government agencies; and Building Solutions, providing concrete foundations and construction services for residential and commercial projects. Originally founded in 1955 as Sterling Construction Company, the firm rebranded to its current name in June 2022. Headquartered in The Woodlands, Texas, the company serves a wide range of sectors, including logistics, manufacturing, and public infrastructure.
◉ Investment Advice
💡 Buy Sterling Infrastructure NASDAQ:STRL
● Buy Range - 148 - 150
● Sell Target - 200 - 205
● Potential Return - 35% - 40%
● Approx Holding Period - 12-14 months
◉ SWOT Analysis
● Strengths
1. Strong E-Infrastructure Backlog – With over $1 billion in backlog, Sterling has a robust pipeline of future projects, ensuring sustained revenue growth.
2. Higher-Margin Services Shift – The company’s strategic focus on higher-margin work (21% gross profit margin in Q4) improves profitability without relying solely on volume.
3. E-Infrastructure Growth Potential – Expected 10%+ revenue growth and 25%+ operating profit growth in 2025 position Sterling for strong earnings expansion.
4. Strategic M&A Opportunities – Strong liquidity allows for accretive acquisitions, enhancing market share and service offerings.
5. Share Repurchase Program – Active buybacks reduce outstanding shares, potentially boosting EPS and shareholder value.
● Weaknesses
1. Texas Market Transition Risks – Moving away from low-bid work in Texas may slow revenue growth in the Transportation segment if not managed well.
2. Revenue Loss from RHB Deconsolidation – Excluding $236 million in RHB revenue could distort growth metrics and reduce reported earnings.
3. Residential Market Pressures – A 14% decline in residential slab revenue (due to DFW affordability issues) could persist if housing demand weakens further.
4. Geographic Expansion Challenges – High costs and logistical hurdles in expanding data center projects outside core regions may limit growth opportunities.
5. Competitive Bidding & Acquisition Risks – Difficulty in securing profitable acquisitions or winning competitive bids could hinder margin and revenue growth.
● Opportunities
1. Data Center & E-Commerce Boom – Rising demand for data centers and distribution facilities presents long-term growth potential for E-Infrastructure.
2. Government Infrastructure Spending – Federal and state investments in highways, bridges, and airports could boost Transportation Solutions revenue.
3. Strategic Acquisitions – Pursuing complementary M&A deals could expand capabilities and market reach.
4. Diversification into New Regions – Expanding into underserved markets could reduce dependency on Texas and mitigate regional risks.
5. Operational Efficiency Improvements – Further margin expansion through cost optimization and technology adoption.
● Threats
1. Economic Slowdown Impact – A recession could reduce demand for residential and commercial construction, affecting Building Solutions.
2. Rising Interest Rates – Higher borrowing costs may pressure profitability and delay large-scale projects.
3. Labor & Material Cost Inflation – Increasing wages and supply chain disruptions could squeeze margins.
4. Intense Competition – Rival firms competing for the same infrastructure projects may drive down pricing and profitability.
5. Regulatory & Permitting Delays – Government approvals and environmental regulations could slow project execution.
◉ Revenue & Profit Analysis
● Year-on-Year
➖ FY24 sales reached $2,116 million, reflecting a 7.28% increase compared to $1,972 million in FY23.
➖ EBITDA rose to $334 million, up from $264 million in FY23.
➖ EBITDA margin improved to 15.8%, up from 13.4% in the same period last year.
● Quarter-on-Quarter
➖ Q4 sales decreased to $499 million, down from $593 million in Q3, but showed a slight increase from $486 million in Q4 of the previous year.
➖ Q4 EBITDA was $80.3 million, down from $105 million in Q3.
➖ Q4 diluted EPS saw a notable rise, reaching $8.27 (LTM), up from $5.89 (LTM) in Q3 2024.
◉ Valuation
1. P/E Ratio (Price-to-Earnings)
● Current vs. Peer Average
➖ STRL’s P/E ratio is 17.9x, much lower than the peer average of 70.5x, suggesting the stock is undervalued compared to peers.
● Current vs. Industry Average
➖ Compared to the broader industry average of 22.9x, STRL again looks relatively inexpensive at 17.9x.
2. P/B Ratio (Price-to-Book)
● Current vs. Peer Average
➖ STRL’s P/B ratio stands at 5.7x, slightly higher than the peer average of 5x, indicating overvaluation.
● Current vs. Industry Average
➖ Against the industry average of 3.6x, STRL’s 5.7x P/B ratio suggests a noticeable overvaluation.
3. PEG Ratio (Price/Earnings to Growth)
➖ STRL’s PEG ratio is 0.21, which means the stock appears undervalued relative to its strong expected earnings growth.
◉ Cash Flow Analysis
➖ Sterling Infrastructure's operating cash flow grew to $497 million in FY24, up from $479 million in FY23, showing steady financial strength.
◉ Debt Analysis
➖ The company's debt-to-equity ratio is 0.38, indicating a healthy balance sheet with manageable debt levels.
◉ Top Shareholders
➖ The Vanguard Group has significantly increased its investment in this stock, now owning an impressive 8.3% stake, which marks a 30% rise since the end of the September quarter.
➖ Meanwhile, Blackrock holds a stake of around 8% in the company.
◉ Technical Aspects
➖ On the monthly chart, the stock remains in a strong uptrend.
➖ On the daily chart, an Inverted Head & Shoulders pattern has formed, signaling a potential breakout soon.
➖ The stock is currently trading at about 35% below its all-time high, making it an attractive investment opportunity.
◉ Conclusion
Sterling Infrastructure (STRL) stands out as a strong investment candidate, backed by solid financial performance, a growing E-Infrastructure backlog, and a strategic focus on higher-margin projects. Its attractive valuation, healthy cash flow, and low debt levels provide further confidence in its growth potential. While there are challenges—such as market competition, geographic expansion hurdles, and economic uncertainties—Sterling’s strengths, including a robust project pipeline, strategic acquisitions, and exposure to high-growth sectors like data centers and 5G infrastructure, offer a favorable risk-reward balance. Overall, Sterling is well-positioned to benefit from the ongoing U.S. e-infrastructure boom, making it an attractive long-term investment opportunity.

U.S. Stock Swing TradeBRK.B
This stock remains one of the few in the U.S. market that continues to exhibit technical strength, maintaining a well-defined uptrend.
Current price action suggests a potential buy-on-dip opportunity near key support levels.
Entry Zone: 494 – 501
Take-Profit Target: 518 – 530
Stop Loss: 488
That said, it remains essential to closely monitor the S&P 500 index, along with prevailing macroeconomic developments, which continue to exert significant influence on market sentiment.

$S&P500 macro analysis , market approaching correction °•° $SPXHi 👋🏻 check out my previous analysis ⏰ on SP:SPX macro bullish analysis ⏰
As provided it went up up 🚀 completed my target's 🎯 💯💪🏻 ✅ ✔️
Click on it 👆🏻 just check out each and every time updates ☝🏻 ☺️
•••••••••••••••••••••••••••••••••••••••••••••••••••••••••••••••••••••••••••••••••••••••••
NOW I was completely 🐻 BEARISH on the market with in upcoming months SP:SPX
📌 Expecting liquidation pump $6500 - $6700
Invalid 🛑 when complete month close above $6700
¹support - $5500 ( 🎯 ¹ )
²support - $5130 ( 🎯 ² )
🎯 3 ... Will be updated based on market conditions by that time ☺️
📍 A wise 🦉 man said - always having patience " is " always gaining only /-
NASDAQ:TSLA ( i accumulate slowly until it cross above $400 )
rest of stocks i will follow index ☝🏻 i will invest based on market conditions ..... ✔️
