Ustech


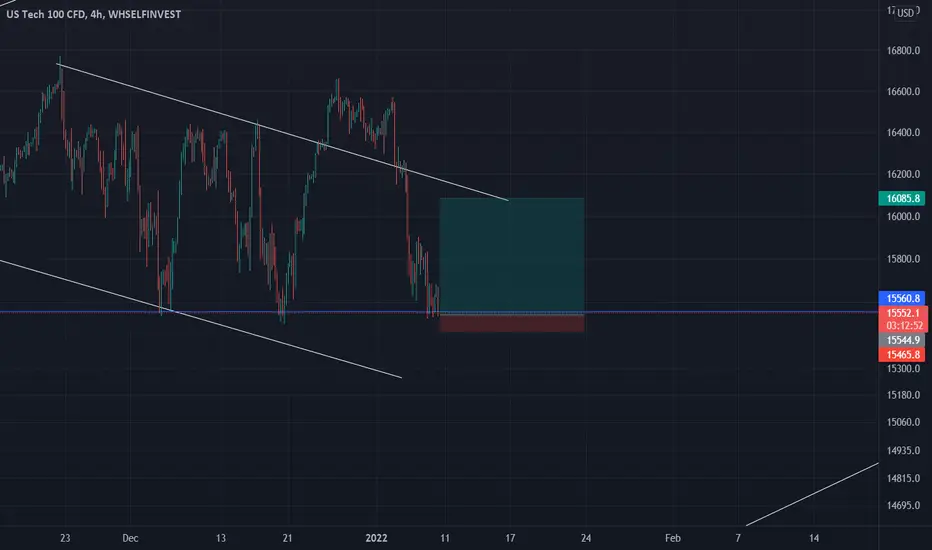
Ndx: 16000 Is The MarkHey y'all, so---I'm still waiting for the train Cos' honestly it's been a bit confusing. The over-all trend is still bullish but, I need to buy at a good price. The nasdaq100 isn't giving that. The hour-4 kind of gave a great pull that I missed out on. Well, that's the disadvantage of my strategy You miss it, you got to wait for another train.
16k is still my mark. It determines the next step!
In this video, I explain all that I'm expecting. Be sure to watch the whole clip!
If my work is something you admire, be sure to leave a like, comment and follow.
I'm forever grateful!

Netflix: Double top pattern completeNetflix - Intraday - We look to Sell at 642 (stop at 665.4)
Selling pressure dominated price action yesterday and we expect this to continue today. Posted a Double Top formation. The continuation lower in prices through support has been impressive with strong momentum and shows no signs of slowing. As this corrective sequence continues we look to set shorts on a rally at better risk/reward levels. Although we remain bullish overall, a correction is possible with plenty of room to move lower without impacting the trend higher. The formation has a measured move target of 583.5.
Our profit targets will be 583.5 and 563.5
Resistance: 642 / 658 / 700
Support: 617 / 600 / 563
Disclaimer – Saxo Bank Group. Please be reminded – you alone are responsible for your trading – both gains and losses. There is a very high degree of risk involved in trading. The technical analysis, like any and all indicators, strategies, columns, articles and other features accessible on/though this site (including those from Signal Centre) are for informational purposes only and should not be construed as investment advice by you. Such technical analysis are believed to be obtained from sources believed to be reliable, but not warrant their respective completeness or accuracy, or warrant any results from the use of the information. Your use of the technical analysis, as would also your use of any and all mentioned indicators, strategies, columns, articles and all other features, is entirely at your own risk and it is your sole responsibility to evaluate the accuracy, completeness and usefulness (including suitability) of the information. You should assess the risk of any trade with your financial adviser and make your own independent decision(s) regarding any tradable products which may be the subject matter of the technical analysis or any of the said indicators, strategies, columns, articles and all other features.
Please also be reminded that if despite the above, any of the said technical analysis (or any of the said indicators, strategies, columns, articles and other features accessible on/through this site) is found to be advisory or a recommendation; and not merely informational in nature, the same is in any event provided with the intention of being for general circulation and availability only. As such it is not intended to and does not form part of any offer or recommendation directed at you specifically, or have any regard to the investment objectives, financial situation or needs of yourself or any other specific person. Before committing toa trade or investment therefore, please seek advice from a financial or other professional adviser regarding the suitability of the product for you and (where available) read the relevant product offer/description documents, including the risk disclosures. If you do not wish to seek such financial advice, please still exercise your mind and consider carefully whether the product is suitable for you because you alone remain responsible for your trading – both gains and losses.

Ndx: Wick Fill Or NotSomething great happened to me---I lost a trade but the reason I said it's great is---it revealed to me what I needed to do personally. My ego and intuitions get the best of me sometimes. Which I know I need to work on.
Either way, I also took the trade because of a daily wick fill I believe might happen. Not expecting though I'll just wait for the market to decide...
Then again, let me remind you of the kevels.
Bulls---17200, 16400 and 15600 (mid)
Bears--14400, 14800 and 15200 (mid)
The bulls are at the strong stick now but since there's a wick, the bears might just be back...
Remember, this is my journal so I post everything and talk about everything.
Follow me to be more enlightened or not if you think trading isn't for you. The question is, are you honest with you?
I'm brutally honest and the truth hurts so only follow me for the truth... That wasn't even ego speaking but you get it though.

Ndx: What The Side Channel Sayshey y'all we're currently in a channel... "side-channel" with 16000 serving as the mid, 16771 top and 15580 it's bottom.
Be sure to use this as a guide.
In that---if the 16000 serves as a resistance, then these bears would be back and vice-versa.
In this video, I explain all that I'm expecting. Be sure to watch the whole clip!
If my work is something you admire, be sure to leave a like, comment and follow.
I'm forever grateful!

Ndx Watch Hour: I Have Three Pointshey nq_f lovers glad to have you in this week.
In this video, I explain the three points the market is likely to reach if you missed the train.
Be sure to watch to get the points!
You can also see this video as a guide.
Listen, trading is risky and not easy. Be sure to not trust anyone---even me!
Please leave a comment, like and follow-up if you enjoy my feeds or not. Haha! still follow me either way.

Ndx Trade Review: A Detailed PlanIt's Sunday a day for reviews. In this video, I talk about my confluences for taking trades, weaknesses and strengths...
I even have resolutions---Haha! check this one out.
Listen, trading is risky and not easy. Be sure to not trust anyone---even me!
Please leave a comment, like and follow-up if you enjoy my feeds or not. Haha! still follow me either way.

NASDAQ 100 BIG MOVEI think that nasdaq 100 is going to jump back up
Firstly wait for stop hunt and then trade channel breakout to the upside.

Ndx: Nfp Is Here, Signs To Watch Out ForHey lovers, made a short clip on the signs I'll be watching out for---today's nfp and you don't want to be left out.
What are your plans for Nfp?
Some key levels---15888-16000 (bulls)
15888-15550 (bears)
Watch the whole clip to get my reaction!
Listen, trading is risky and not easy. Be sure to not trust anyone---even me!
Please leave a comment, like and follow-up if you enjoy my feeds or not. Haha! still follow me either way.

Ndx: Are The Bulls Coming Back?After yesterday's success, I'm really happy with the year already.
Anyway, the market has finally gotten to the bullish key level giving it---it's third touch.
I guess the main question is, "are we getting a new higher low?"
Watch the whole clip to get my reaction!
Listen, trading is risky and not easy. Be sure to not trust anyone---even me!
Please leave a comment, like and follow-up if you enjoy my feeds or not. Haha! still follow me either way.

Ndx: First Trade, Yay Or Nay?New L.highs?
At exactly 12am, I took a trade. Once the train stopped---but now I'm actually looking at it like, "whether it was the right time or not..."
The market has a funny way of letting you know you're wrong so---I'll just wait to see.
Till then, How has your week been so far?
Listen, trading is risky and not easy. Be sure to not trust anyone---even me!
Please leave a comment, like and follow-up if you enjoy my feeds or not. Haha! still follow me either way.

Ndx: Again, Wait For The New HighThe train left.
Wait for the new high...
Well, it's a good thing I waited... huh!
These bears weren't done and it saved me some cash.
Now I await the pull!
Be sure to watch the whole clip, like, comment and follow me. I appreciate all your contributions to my work.
Happy a great week!
Lazyluchi.

Ndx: Watch Hour Opening Firstly, I just want to congratulate everyone who made it to this year. I pray for success and positivity for y'all.
Nasdaq100 has been on a roll for a while now... The indecision between the bulls and bears have made me to just wait at the sidelines.
My edge hasn't fully played out so---I'm not about to force things.
In this video, I explain all that should be done.
Be sure to watch the whole clip, like, comment and follow me. I appreciate all your contributions to my work.
Happy a great week!
Lazyluchi.

Your only as good as the assets you tradeThis is just a short blog post of a much longer idea!
In a recent post we spoke about focusing only on assets that are in play for the day, even tough with day trading you can still make solid profits, especially on the tick charts, trading ranges, a trend will generate you much bigger and more importantly, easier profits.
This is why it is vital to focus on assets which could generate momentum, because at the end of the day in day trading you are only as good as the assets you trade.
Below you will find a chart of NASDAQ (left) and a chart of XAUUSD (right), one has moved significantly upwards while one was stuck in a whipsaw range which ended up breaking to the down side towards the end of the day on December 31st.
Choosing to trade XAUUSD would be much easier to make a profit.

Ndx: Last Days Of DecemberHow was your December/year?
In this video, I explain how the bulls and bears are now in a range. It's advised to stay out as we watch the watch-hour close. Be available every Saturdays for my teaching.
Happy new year!
Listen, trading is risky and not easy. Be sure to not trust anyone---even me!
Please leave a comment, like and follow-up if you enjoy my feeds or not. Haha! still follow me either way.

Alphabet: Bearish Ending Wedge Formation - Selling OpportunityAlphabet - Short Term - We look to Sell at 2875 (stop at 2967)
Broken out of the channel formation to the downside. Price action has formed a bearish ending wedge formation. Price action has posted a bearish Engulfing Candle and is negative for short-term sentiment. A lower correction is expected. Preferred trade is to sell into rallies.
Our profit targets will be 2575 and 2400
Resistance: 2925 / 3012 / 3019
Support: 2832 / 2708 / 2621
Disclaimer – Saxo Bank Group. Please be reminded – you alone are responsible for your trading – both gains and losses. There is a very high degree of risk involved in trading. The technical analysis, like any and all indicators, strategies, columns, articles and other features accessible on/though this site (including those from Signal Centre) are for informational purposes only and should not be construed as investment advice by you. Such technical analysis are believed to be obtained from sources believed to be reliable, but not warrant their respective completeness or accuracy, or warrant any results from the use of the information. Your use of the technical analysis, as would also your use of any and all mentioned indicators, strategies, columns, articles and all other features, is entirely at your own risk and it is your sole responsibility to evaluate the accuracy, completeness and usefulness (including suitability) of the information. You should assess the risk of any trade with your financial adviser and make your own independent decision(s) regarding any tradable products which may be the subject matter of the technical analysis or any of the said indicators, strategies, columns, articles and all other features.
Please also be reminded that if despite the above, any of the said technical analysis (or any of the said indicators, strategies, columns, articles and other features accessible on/through this site) is found to be advisory or a recommendation; and not merely informational in nature, the same is in any event provided with the intention of being for general circulation and availability only. As such it is not intended to and does not form part of any offer or recommendation directed at you specifically, or have any regard to the investment objectives, financial situation or needs of yourself or any other specific person. Before committing toa trade or investment therefore, please seek advice from a financial or other professional adviser regarding the suitability of the product for you and (where available) read the relevant product offer/description documents, including the risk disclosures. If you do not wish to seek such financial advice, please still exercise your mind and consider carefully whether the product is suitable for you because you alone remain responsible for your trading – both gains and losses.

AbbVie: Breakout! Buying a re-test of supportAbbVie - Short Term - We look to Buy at 119.00 (stop at 114.50)
Previous resistance level of 119.95 broken. A move higher has resulted in prices breaking from the previous range and confirmed our bullish expectation. We have a Gap open at 118.86 from 03/12/2021 to 06/12/2021. Further upside is expected although we prefer to set longs at our bespoke support levels at 119.00, resulting in improved risk/reward.
Our profit targets will be 135.00 and 150.00
Resistance: 122.42 / 124.00 / 130.00
Support: 119.95 / 118.86 / 115.03
Disclaimer – Saxo Bank Group. Please be reminded – you alone are responsible for your trading – both gains and losses. There is a very high degree of risk involved in trading. The technical analysis, like any and all indicators, strategies, columns, articles and other features accessible on/though this site (including those from Signal Centre) are for informational purposes only and should not be construed as investment advice by you. Such technical analysis are believed to be obtained from sources believed to be reliable, but not warrant their respective completeness or accuracy, or warrant any results from the use of the information. Your use of the technical analysis, as would also your use of any and all mentioned indicators, strategies, columns, articles and all other features, is entirely at your own risk and it is your sole responsibility to evaluate the accuracy, completeness and usefulness (including suitability) of the information. You should assess the risk of any trade with your financial adviser and make your own independent decision(s) regarding any tradable products which may be the subject matter of the technical analysis or any of the said indicators, strategies, columns, articles and all other features.
Please also be reminded that if despite the above, any of the said technical analysis (or any of the said indicators, strategies, columns, articles and other features accessible on/through this site) is found to be advisory or a recommendation; and not merely informational in nature, the same is in any event provided with the intention of being for general circulation and availability only. As such it is not intended to and does not form part of any offer or recommendation directed at you specifically, or have any regard to the investment objectives, financial situation or needs of yourself or any other specific person. Before committing to a trade or investment therefore, please seek advice from a financial or other professional adviser regarding the suitability of the product for you and (where available) read the relevant product offer/description documents, including the risk disclosures. If you do not wish to seek such financial advice, please still exercise your mind and consider carefully whether the product is suitable for you because you alone remain responsible for your trading – both gains and losses.

NAS SCENARIOOutlook for NAS.
-
Weekly: Nas had a nice big pullback on the weekly, perfectly testing and rejecting the 50%. It caught some liquidity and currently it's making it's way up again.
-
Daily: After that nice H&S pattern we can see liquidity being caught at the zone below the 50% fib, rejection and a perfect retest on the 50% on the daily aswell. I can see this being a major pivot point.
-
4H: We can see the downtrend/major pullback very clear here, currently nas is making up moves after catching liquidity.
if nas breaks the 61.8%, then I would like to see an ABC pullback correlating with the fib, creating a higher low. Indicating a shift of trend before looking for buy opportunities.
-
Let me know your thoughts, link your outlooks in the comments below.

Nas100 Undecided? 🤷♂️❌📈Will we see it head down to 15 860 before bouncing back up to 16 245?? 🐱🏍🔥🤑🤑
Or will it ultimately continue to crash to below 15 500?? The uncertainty thus far is TOO MUCH🤦♂️❌🤯
Either way, get ready to pull the final trigger on the NFP 2021!!🔥🔥😁🤑🤑🐱🏍✔
LETSGO!! Secure the bag!!💰💰💰💰🤑🔥🔥🔥

NASDAQ 100 STILL GOING LONG!I believe that nasdaq will return to highs again.
even though this covid variant came out.
Or it can drop more, I might be wrong.

NAS100 is going down?!!🤷♂️🤷♂️🔥Has the roller coaster reached it's peak?
I feel like it's time for the bears to take us below 15k or even 14k. What do you think?
TESLA will help drag it down there. It is definitely looking bearish on the daily. I'm just gonna wait for 15 999 and then enter a short.
LET'S GO!! Secure the bag!!!🔥🔥🔥💰💰😉✔🤑🤑🐱🏍
