Short USTECHPossible short bias on the USTECH. Daily bias still stuck in some consolidation but i believe we have a pending short before going bullish to take out some weekly liquidity.
Relatively equal lows present around 12925 therefore, posible target. Entry is premature as London open has not occured yet.
Ustech

Nasdaq Analysis Hello,
Since my last analysis, I have been closely monitoring the market and wanted to provide you with an update. Despite some fluctuations, we have yet to witness a significant shift in the market. While we did experience a push out from the wedge, we have remained within the confines of the consolidation box.
However, I must emphasise that the current build-up of market is quite intense, and I anticipate that we will experience some substantial movements very soon. If you have not already done so, I recommend reviewing my previous analysis for a comprehensive understanding of my projections for the market's future direction and what levels to watch out for.

Nasdaq Analysis Hello,
From yesterday's analysis you can see the price done as I expected. The prices has broken out the wedge I drew yesterday but we are still in the consolidation box. Now the price may come back retest the wedge and continue going up or this could be a fake break push price back down to the lows of the consolidation and then breaking down.
For Bulls: 13306- 13516
For Bears: 12813- 12417
I will be looking very closely for the bull run and even if we push down il still be looking for bull entries. As the market is still very bullish!!

Nasdaq 4Hr TF AnalysisHello,
My previous post I analysed the weekly timeframe and I mentioned how the market has been consolidating and now on the 4 hour chart you can see the build up of the consolidation. We can see we are getting closer and closer for this break. We have had few fake breakouts, which we want to avoid getting caught in.
I would wait for a break of 131200 area or 12840 area to decide to get a safer entry weather you go buy or sell short term.

NASDAQ TRADE IDEA - EARNINGS WEEKNASDAQ / US30 TRADE IDEAS
Potential bullish week ahead, waiting for financials to get released to determine whether I will be bullish or bearish.
There are a lot of opportunities to get in long positions so we will wait for price and try avoid the false break outs.

INVERTED H&S ON NASDAQ Morning everyone,
Looking at this inverted H&S move play out today for Nasdaq - if price breaks the shoulder zone I would I really hold sell positions to 12935 - 12820
If preteen is respected we will look to take some long positions on the formation of the shoulder.

Weekly Outlook NAS100 Monday 27 MarchHere are some upside targets for you to study, please take note of the broker to match your chart.
Are you currently marrying an outlook that has not had the chance to form yet ..?
Here is an alternate perspective to consider maybe.
Note: Monday 27 March - low probability.
Good luck, may the Nasdaq forces be in your favour.

Sell NAS100Technical Analysis] A double top seems to be forming inside this bearish channel, I'd like to see price drop heavily from here.

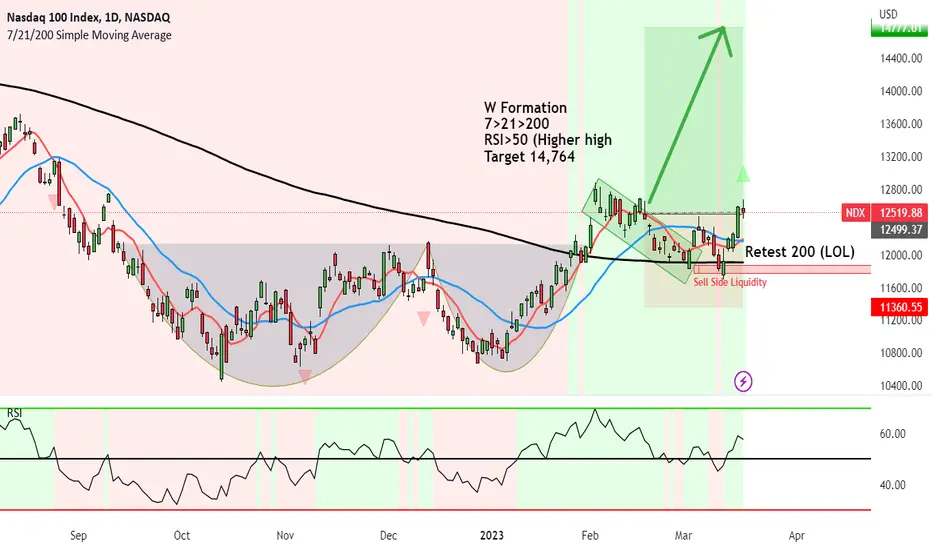
NASDAQ USTEC showing Medium term upside to 14,764 YES!W Formation formed on the larger scale.
We then had the price break above and come right back down in a form of a flag formation.
The big test was to 200MA which it tested touched and formed a LOL.
SMC:
LOL = (Level of Liquidity) Sell SIde Liquidity.
That's where the market drops, tackles all the selling orders(sweeps the longers out) and it gets the big boys in.
This means, we can expect the price to rally quite a bit.
7>21>200
RSI>50 (Higher high
Target 14,764
Nas100 H1Good day everyone . Took a day off yesterday to monitor the balance of market after NFP I'm happy with thr results.
This trade idea of a short position is well planned and confirmed on the daily chart . We have a big liquidity sweep that's need to be taken on out . So please take this trade cautiously.
Targe of this trade setup is to catch 450points , it'll be a swing trade . Let's trade smart

nas100 short tradelooking at RR I got a short entry level which im not going to miss . market is giving us impulse correction setup .. ride along 300 points drop will do me good

UStech analysis 1DUStech analysis 1D.
It retraces twice about 62% now 78.6%. Making a bullish flag and could go up if it breaks this level.
otherwise we could see a downtrend from here.

Buy NasdaqFormation of the Drop base rally, support/supply zone, wich also made a BuOB which is tested. Now take profit on Buy side liquidity.

Nas100 ( update )Earlier on I shared this trade idea on the demand zone which help up the entire day . I'm to see market is preparing a bullish reversal for us to take long positions

USTEC Swing trade idea As u can see my Point of Intrest in the chart. i will go long when market ienter in my zone going lower Timeframe for small sl and good entry...

Nasdaq Direction for the coming monthsNASDAQ- We are yet to have another big bullish momentum, however, price needs to drop a bit in order for it to bounce for the last move. Longer term view is bearish as the fear of recession in US rising every day. Upcoming months will affect how Nas100 perform for current year.

META PLATFORMS INC COM CL A Meta is a solid company with many milestones ahead in it's future.
It is the future. Don't get lost in the sauce spacey
home alone stik tracey
=stikstocktitslive

Accelerating Trend lines WARNING DANGER !! 🔊🔊💣💣A repetitive phenomenon in the Forex markets is the price acceleration and deceleration.
It is very common that you see the price trend starts suddenly to accelerate and the
upward wave gets sharper and steeper, especially in times of speculative bubbles.
P.S.
i dont say that will happen tomorrow but you have to be very careful now


Buying NASDAQ at previous swing highs.NASDAQ - Intraday - We look to Buy at 11611 (stop at 11494)
Buying pressure from 11726 resulted in all the initial daily selloff being recaptured.
A Fibonacci confluence area is located at 12002.
The bias remains mildly bullish but there is scope for a move in either direction at the open.
Bespoke support is located at 11615.
Our profit targets will be 11615 and 11715
Resistance: 11810 / 12002 / 12232
Support: 11609 / 11476 / 10664
Disclaimer – Saxo Bank Group.
Please be reminded – you alone are responsible for your trading – both gains and losses. There is a very high degree of risk involved in trading. The technical analysis , like any and all indicators, strategies, columns, articles and other features accessible on/though this site (including those from Signal Centre) are for informational purposes only and should not be construed as investment advice by you. Such technical analysis are believed to be obtained from sources believed to be reliable, but not warrant their respective completeness or accuracy, or warrant any results from the use of the information. Your use of the technical analysis , as would also your use of any and all mentioned indicators, strategies, columns, articles and all other features, is entirely at your own risk and it is your sole responsibility to evaluate the accuracy, completeness and usefulness (including suitability) of the information. You should assess the risk of any trade with your financial adviser and make your own independent decision(s) regarding any tradable products which may be the subject matter of the technical analysis or any of the said indicators, strategies, columns, articles and all other features.
Please also be reminded that if despite the above, any of the said technical analysis (or any of the said indicators, strategies, columns, articles and other features accessible on/through this site) is found to be advisory or a recommendation; and not merely informational in nature, the same is in any event provided with the intention of being for general circulation and availability only. As such it is not intended to and does not form part of any offer or recommendation directed at you specifically, or have any regard to the investment objectives, financial situation or needs of yourself or any other specific person. Before committing to a trade or investment therefore, please seek advice from a financial or other professional adviser regarding the suitability of the product for you and (where available) read the relevant product offer/description documents, including the risk disclosures. If you do not wish to seek such financial advice, please still exercise your mind and consider carefully whether the product is suitable for you because you alone remain responsible for your trading – both gains and losses.

Tesla - Breaking out of a wedgeTesla - Short Term - We look to Buy at 177.90 (stop at 163.33)
The medium term bias remains bearish. Broken out of the wedge formation to the upside. Bullish divergence can be seen on the daily (the chart makes a lower low while the oscillator makes a higher low), often a signal of exhausted bearish momentum, or at least a correction higher. Although the anticipated move higher is corrective, it does offer ample risk/reward today. Preferred trade is to buy on dips.
Our profit targets will be 237.00 and 262
Resistance: 200.82 / 237.40 / 265.25
Support: 169.91 / 166.19 / 150.83
Please be advised that the information presented on TradingView is provided to Vantage (‘Vantage Global Limited’, ‘we’) by a third-party provider (‘Signal Centre’). Please be reminded that you are solely responsible for the trading decisions on your account. There is a very high degree of risk involved in trading. Any information and/or content is intended entirely for research, educational and informational purposes only and does not constitute investment or consultation advice or investment strategy. The information is not tailored to the investment needs of any specific person and therefore does not involve a consideration of any of the investment objectives, financial situation or needs of any viewer that may receive it. Kindly also note that past performance is not a reliable indicator of future results. Actual results may differ materially from those anticipated in forward-looking or past performance statements. We assume no liability as to the accuracy or completeness of any of the information and/or content provided herein and the Company cannot be held responsible for any omission, mistake nor for any loss or damage including without limitation to any loss of profit which may arise from reliance on any information supplied by Signal Centre.

Buying NASDAQ at support.NASDAQ - Intraday - We look to Buy at 11438 (stop at 11313)
Continued downward momentum from 12085 resulted in the pair posting net daily losses yesterday.
An overnight negative theme in Equities has led to a lower open this morning.
Bespoke support is located at 11438.
A Fibonacci confluence area is located at 9668.
Although the anticipated move higher is corrective, it does offer ample risk/reward today.
Our profit targets will be 11870 and 12000
Resistance: 11705 / 11870 / 12088
Support: 11600 / 11438 / 10634
Disclaimer – Saxo Bank Group.
Please be reminded – you alone are responsible for your trading – both gains and losses. There is a very high degree of risk involved in trading. The technical analysis , like any and all indicators, strategies, columns, articles and other features accessible on/though this site (including those from Signal Centre) are for informational purposes only and should not be construed as investment advice by you. Such technical analysis are believed to be obtained from sources believed to be reliable, but not warrant their respective completeness or accuracy, or warrant any results from the use of the information. Your use of the technical analysis , as would also your use of any and all mentioned indicators, strategies, columns, articles and all other features, is entirely at your own risk and it is your sole responsibility to evaluate the accuracy, completeness and usefulness (including suitability) of the information. You should assess the risk of any trade with your financial adviser and make your own independent decision(s) regarding any tradable products which may be the subject matter of the technical analysis or any of the said indicators, strategies, columns, articles and all other features.
Please also be reminded that if despite the above, any of the said technical analysis (or any of the said indicators, strategies, columns, articles and other features accessible on/through this site) is found to be advisory or a recommendation; and not merely informational in nature, the same is in any event provided with the intention of being for general circulation and availability only. As such it is not intended to and does not form part of any offer or recommendation directed at you specifically, or have any regard to the investment objectives, financial situation or needs of yourself or any other specific person. Before committing to a trade or investment therefore, please seek advice from a financial or other professional adviser regarding the suitability of the product for you and (where available) read the relevant product offer/description documents, including the risk disclosures. If you do not wish to seek such financial advice, please still exercise your mind and consider carefully whether the product is suitable for you because you alone remain responsible for your trading – both gains and losses.

Buying NASDAQ at previous swing highs.NASDAQ - Intraday - We look to Buy at 11601 (stop at 11449)
There is no clear indication that the upward move is coming to an end.
The 261.8% Fibonacci extension is located at 12160 from 10592 to 11191.
Risk/Reward would be poor to call a buy from current levels.
We look to set longs at our bespoke indicator levels (11600).
Our profit targets will be 11991 and 12091.
Resistance: 11933 / 12160 / 12466
Support: 11600 / 11360 / 10667
Disclaimer – Saxo Bank Group.
Please be reminded – you alone are responsible for your trading – both gains and losses. There is a very high degree of risk involved in trading. The technical analysis , like any and all indicators, strategies, columns, articles and other features accessible on/though this site (including those from Signal Centre) are for informational purposes only and should not be construed as investment advice by you. Such technical analysis are believed to be obtained from sources believed to be reliable, but not warrant their respective completeness or accuracy, or warrant any results from the use of the information. Your use of the technical analysis , as would also your use of any and all mentioned indicators, strategies, columns, articles and all other features, is entirely at your own risk and it is your sole responsibility to evaluate the accuracy, completeness and usefulness (including suitability) of the information. You should assess the risk of any trade with your financial adviser and make your own independent decision(s) regarding any tradable products which may be the subject matter of the technical analysis or any of the said indicators, strategies, columns, articles and all other features.
Please also be reminded that if despite the above, any of the said technical analysis (or any of the said indicators, strategies, columns, articles and other features accessible on/through this site) is found to be advisory or a recommendation; and not merely informational in nature, the same is in any event provided with the intention of being for general circulation and availability only. As such it is not intended to and does not form part of any offer or recommendation directed at you specifically, or have any regard to the investment objectives, financial situation or needs of yourself or any other specific person. Before committing to a trade or investment therefore, please seek advice from a financial or other professional adviser regarding the suitability of the product for you and (where available) read the relevant product offer/description documents, including the risk disclosures. If you do not wish to seek such financial advice, please still exercise your mind and consider carefully whether the product is suitable for you because you alone remain responsible for your trading – both gains and losses.
