Nasdaq Moving as PredictedNasdaq is currently running in profit after the call outs made last week.
We can expect some support as we are selling of in to discount, so be aware.
Scenarios:
-If price breaks 12800.00 we will likely see 12500.00 next.
-If price holds 12800.00 we can expect bullish PA back above 13000.00 and beyond.
Two sides to a coin so be aware of both possibilities.
Make of this what you will. I do this for free.
Good Trading!
Ustech100

Nasdaq Pre-Market UpdateNasdaq reacted from the equilibrium of the most recent up leg. If we hold the momentum of this leg and push higher we can take out BSL as marked out. However if we respect the area at around 1378.00 we can expect lower prices.
I'll wait for market open to see what level the market is going to be attracted to next.

Nasdaq Potential ShortsAs we can see Nas reacted from A HTF POI marked with the orange box. Since then we have seen Bearish OF out of that area breaking structure of a medium term swing low. If we get a retracement higher in to the FVG of the bearish leg and confirmation on the LTF we can expect lower prices in to Liquidity areas and the FVG noted by the dotted line.

BULLISH OR BEARISH?Nasdaq is currently in a strong bulls market - all though there are a lot of signs both technically and fundamentally for it to go down, the bulls have taken over this area in the market. Today we will go with market direction rather than fighting the market.
We will wait and see what price does at 13130 - if it respects ema and tl then we will go long to resistance (13205) and ideally end off at 13315.
If price breaks ema and TL we should see price head down to 13044 and potentially lower.
Overall today should be clear for a 700-1000 pip move.

USTECH100CFD 31 MARCH 2023 (NASDAQ)Findings:
1) Dow Theory Previous HH broke possibly will make new HH.
2) Cup and Handle breakout neckline breached.
3) Bullish Flag Formation Hight point breached.
4) History: In correction phase never goes sides ways, always makes V shape recovery in Daily Time Frame.
Analysis:
Strong Buy Call, Buy on Dips
Trade Plan:
ENTRY 13002
STOPLOSS 12460
TARGET 1 13430
TARGET 2 13850

NASDAQ BULL RUN?The bulls have taken over considering majority of technicals and recent fundamentals pointing at a price correction.
Due to APPLE releasing its new payment method and headset enticed bulls to push pice up, I still see the overall move being a SHORT but if the bulls continue pushing price higher up we could see 13033 really soon.

NASDAQ POIAs we can see Nasdaq is trading within the weekly range. The BSL of the weekly high seems to be the target for our next run of liquidity. Just above the PWH we have HTF POI that I will be looking at to see if we can get some sort of reaction. For now I am sitting on my hands to see if we can get a run above these highs and then take action ones the directional bias becomes evident on all timeframes.

NASDAQ BUYS TO THE MOONThe weekly and daily timeframe is showing a bullish trend, and remember the idea of the CADCHF setup I posted, this is what was expected to happen there.
What do we expect here? A retest to 12000 SUPPORT zone and a bullish move to 13720. This is a long term buy for NASDAQ.
Please do share, and give a follow to support.

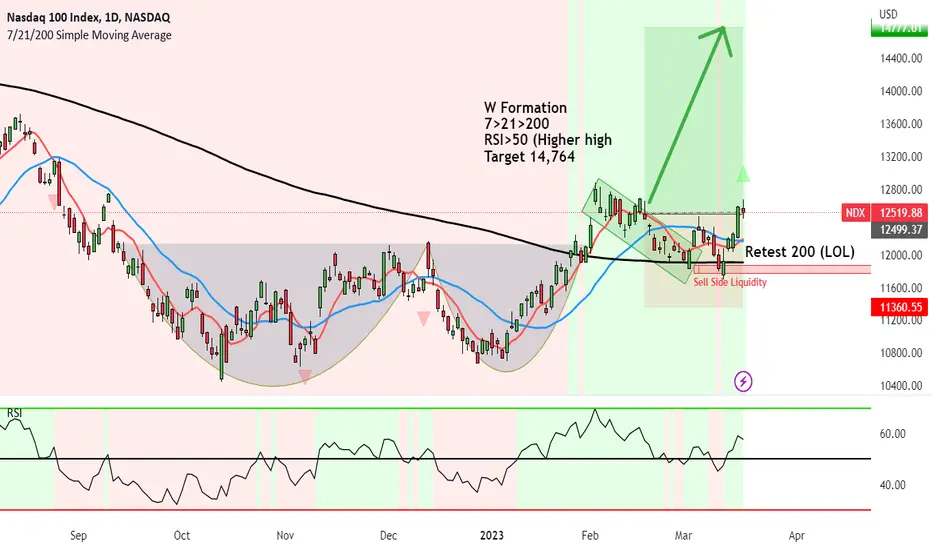
NASDAQ USTEC showing Medium term upside to 14,764 YES!W Formation formed on the larger scale.
We then had the price break above and come right back down in a form of a flag formation.
The big test was to 200MA which it tested touched and formed a LOL.
SMC:
LOL = (Level of Liquidity) Sell SIde Liquidity.
That's where the market drops, tackles all the selling orders(sweeps the longers out) and it gets the big boys in.
This means, we can expect the price to rally quite a bit.
7>21>200
RSI>50 (Higher high
Target 14,764
NASDAQ | ALL EYES ON BULLSDespite negativity on banking system default. NASDAQ is on the move with bulls printing new high everyday.
Technically speaking, US100 is trading in bullish flag with the breakout target comes at 15000. But we will move step by step. The upcoming resistance comes at 12900 which is horizontal level.
Previously, NASDAQ printed triple bottom around 10650 where the neckline comes at 12100. The target of triple bottom comes at 13700.
All signs shows strong bullish momentum. Any dip will be buying opportunity with appropiate stoploss.
Let us know what do you think of the idea?

Nas100 H1Good day everyone . Took a day off yesterday to monitor the balance of market after NFP I'm happy with thr results.
This trade idea of a short position is well planned and confirmed on the daily chart . We have a big liquidity sweep that's need to be taken on out . So please take this trade cautiously.
Targe of this trade setup is to catch 450points , it'll be a swing trade . Let's trade smart

Nasdaq Target HitAs mentioned in my previous posts, Nasdaq has reached my target of 11811.00.
Thank You!

Nasdaq NFPLook where price was delivered to. If we hold beneath this area we might see further downside movement on Nasdaq. Otherwise if the bullishness continuous above that level we will see higher prices in to premium.

Nasdaq Projected Target ReachedNasdaq reached the first area that was projected.
Please like this and I will be posting more!

USTECH 100USTEC took support from 0.75 sd (12135), this move goes up to 12,250 and the final target of this move will be 12300-12345.
Stoploss below 12000
Plan B
wait for the price to reach 12330, then short with a stop loss above 12400 and target 12250 and 12050

nas100 short tradelooking at RR I got a short entry level which im not going to miss . market is giving us impulse correction setup .. ride along 300 points drop will do me good

UStech analysis 1DUStech analysis 1D.
It retraces twice about 62% now 78.6%. Making a bullish flag and could go up if it breaks this level.
otherwise we could see a downtrend from here.

Nasdaq 500point Reaction From Support, What Next?In this update we review the recent price action in the Nasdaq emini futures contract and identify the next high probability trading opportunity and price objectives tot arget

Buy NasdaqFormation of the Drop base rally, support/supply zone, wich also made a BuOB which is tested. Now take profit on Buy side liquidity.

Nas100 ( update )Earlier on I shared this trade idea on the demand zone which help up the entire day . I'm to see market is preparing a bullish reversal for us to take long positions

USTECH NAS100Possible long on nas100. currently on demand and also a strong support were price reacted in previous weeks. Lets see how it goes !

NQ1! Nasdaq Ustec 100 ndx buy Limit !According to my chart analysis , NQ1! Nasdaq Ustec 100 ndx buy limit ! Show strong signal to buy , buy max as you can .

NQ1! Nasdaq Ustec 100 ndx buy stop !According to my chart analysis , NQ1! Nasdaq Ustec 100 ndx buy stop ! Show strong signal to buy , buy max as you can .
