Nasdaq reversed to bearish, looking short tradeHello traders 👋
According to 1 day chart, Nasdaq index is ready to do it's last downward movement. Hence I've prepared my analysis on how to trade in the bearish market. Many said rise from the previous low point; 11050 indicated beginning of bullish market. On the other hand, I think it is the 4th wave correction. Therefore I will continue to do short for the long term.
Ustech100

NAS100 Bearish forecastThe US100 has copmleted a Bearish Gartley harmonic pattern. From what we know of the Gartley is that from point D it reutns to point A. We however can't risk holding this indice with the yet another recession knocking on our doors. Another thing to consider is that we are currently overbought on our RSI, we should see this index plummet down to the $10 000 area
We will now sell the NASDAQ100 Index/ UStech100 and take partially close our positions on the listed take profit points (TP) listed above.
Please share your thoughts.
Disclaimer
NASDAQ Guru offers general trading signals that does not take into consideration your own trading experiences, personal objectives and goals, financial means, or risk tolerance.

Nasdaq Analysis Hello Everyone,
The market has so far played beautifully as analysed. Now we have reached a area of strong resistance 12039; this area has had price rejection in the past many time. However I can see this breaking soon. Price may come down close to 11878 area before breaking 12039, Or it will soon break 12039 without a pullback. When it does break, price will go to areas between 12159- 12431.

Nasdaq Review This was an analysis i did couple days ago. The market came to my support area and bounced off as i expected.
Hope these analysis are helping you


Nasdaq AnalysisHello everyone,
The market had some beautiful clear bullish run and we are now at the top of the channel. Two scenarios this may play, firstly price may pull back to areas of 11581 before continuing to go up to 12159 area. OR price may just break 11878 area and continue going uo to 12159. Either way I am bullish with the market.
Check my profile for more info

NAS100 DumpPrice formed a Bearing Flag/Pennant on Daily. With the structure break on H4 timeframes are now confluent. Price is now moving retesting resistance zone.Layered with the supply zone and the divergence. A Sell pressure is on the rise.

Nasdaq Analysis Hello Everybody.
The market played really nicely to the analysis from Monday. Now we will probably see price pushing down to the levels I drew earlier. These levels were mentioned in the previous analysis. The price will most likely now come down to 11334 IF the centre channel line is broken. if that happens nothing it stopping it going down to levels of 11236- 11138. Bare in mind we will have many pullbacks if market does come down so do wait for these pullbacks. Also if price decides to go up from here then I would like to see a break of this channel. Break of this channel up can break a major trend line on the daily time frame which may change the dynamics to the trend from bearish to bullish!! We will wait and see how this plays

NASDAQ Analysis Hi Everyone,
It has been a while and I hope you all are doing well. I am back to do regular analysis and help you all progress and get better at understanding the markets.
Looking at the current nasdaq market, we can see a rising wedge has been formed. It is very close to a breakout. This is likely to break down however there is good possibility for it to continue going up. If price does break down, I would wait for confirmation after the break of 11440, a break here will push price down further to 11334-11236.
if price does push higher than we expect it to go to 11700- 11821 and higher. As the market develops I will be posting to keep you all updated.

⚰️Nasty Nas100: Sell Part 2 ☠️$NAS100USD : My bias is still bearish. i waited for a bit more price to develop and saw that price retested a previous major exhaustion area. So i went back for sells and is looking for a break of major exhaustion area of 10803.8

NAS100 breatherWeak selling power, ABCD completed, will NAS100 push up for some gains. New year, new energy ✌🤷♂️

USTECH/NAS100/NASDAQ SELLSelling nasdaqg at current price, leverage trading 0.50% risk, if i get stopped out will wait for another good opportunity to enter the market again

Accelerating Trend lines WARNING DANGER !! 🔊🔊💣💣A repetitive phenomenon in the Forex markets is the price acceleration and deceleration.
It is very common that you see the price trend starts suddenly to accelerate and the
upward wave gets sharper and steeper, especially in times of speculative bubbles.
P.S.
i dont say that will happen tomorrow but you have to be very careful now

NAS100| USTECH |FOREX| STOCK|DECRYPTERSH i people Welcome to Team Decrypters
We are looking to Short Nas100 Around 11k on confirmation
Stoploss & Targets are mentioned in The chart
Fundamental Reason :- AS "AAPL" Loss the support on Daily it will move towards 100$ Tesla Microsoft and other Tech companies to Follow till pre covid level so we are expecting NAS 100 Also to visit pre covid levels first before any reversal or pause on selling momentum

Buying NASDAQ at yearly lows.NASDAQ - Intraday - We look to Buy at 10684 (stop at 10484)
Trades at the lowest level in 30 days.
Bespoke support is located at 10684.
The medium term bias remains bullish.
A Fibonacci confluence area is located at 13322.
Our profit targets will be 11337 and 13322
Resistance: 11337 / 11552 / 13322
Support: 10800 / 10684 / 10427
Disclaimer – Saxo Bank Group.
Please be reminded – you alone are responsible for your trading – both gains and losses. There is a very high degree of risk involved in trading. The technical analysis , like any and all indicators, strategies, columns, articles and other features accessible on/though this site (including those from Signal Centre) are for informational purposes only and should not be construed as investment advice by you. Such technical analysis are believed to be obtained from sources believed to be reliable, but not warrant their respective completeness or accuracy, or warrant any results from the use of the information. Your use of the technical analysis , as would also your use of any and all mentioned indicators, strategies, columns, articles and all other features, is entirely at your own risk and it is your sole responsibility to evaluate the accuracy, completeness and usefulness (including suitability) of the information. You should assess the risk of any trade with your financial adviser and make your own independent decision(s) regarding any tradable products which may be the subject matter of the technical analysis or any of the said indicators, strategies, columns, articles and all other features.
Please also be reminded that if despite the above, any of the said technical analysis (or any of the said indicators, strategies, columns, articles and other features accessible on/through this site) is found to be advisory or a recommendation; and not merely informational in nature, the same is in any event provided with the intention of being for general circulation and availability only. As such it is not intended to and does not form part of any offer or recommendation directed at you specifically, or have any regard to the investment objectives, financial situation or needs of yourself or any other specific person. Before committing to a trade or investment therefore, please seek advice from a financial or other professional adviser regarding the suitability of the product for you and (where available) read the relevant product offer/description documents, including the risk disclosures. If you do not wish to seek such financial advice, please still exercise your mind and consider carefully whether the product is suitable for you because you alone remain responsible for your trading – both gains and losses.

Iraq, Vietnam, Libya, Cyprus, Syria, Yugoslavia, Armenia ...I tried to give Nas a chance. but I can not wait any longer. I hope I'm very wrong.
P.S. this scenario is not valid above 15.2K and new ATH
10 reasons why someone chooses to become a refugee.
1.
2.
3.
4.
5.
6.
7.
8.
9.
10.
there is no reason.
people do not become refugees by choice.
Iraq, Vietnam, Libya, Cyprus, Syria, Yugoslavia, Armenia ... "West", stop pretend so much. hypocrisy at its best...


We see S&P500 is very bullish with recent tech innovations. TSMC to up Arizona investment to $40 billion with second semiconductor chip plant
The investment by TSMC is one of the largest foreign investments in U.S. history, and the largest in the state of Arizona.
Semiconductor chips are used in everything from computers and smartphones to cars, microwaves and health-care devices. Once the plants open, they will produce enough chips to meet the U.S. annual demand.
The announcement comes in wake of the passage of the CHIPS and Science Act which was signed into law in early August.
President Joe Biden is joining the founder of Taiwan Semiconductor Manufacturing
Co. on Tuesday to announce the opening of the company’s second chip plant in Arizona, raising its investment in the state from $12 billion to $40 billion.
The company will also announce it will be producing more technically advanced chips than originally proposed. The investment by TSMC is one of the largest foreign investments in U.S. history, and the biggest in the state of Arizona.
Semiconductor chips are used in everything from computers and smartphones to cars, microwaves and health-care devices. The Covid-19 pandemic shined a bright light on U.S. dependence on Chinese manufacturers as lockdowns led to a global shortage of the high-tech chips.

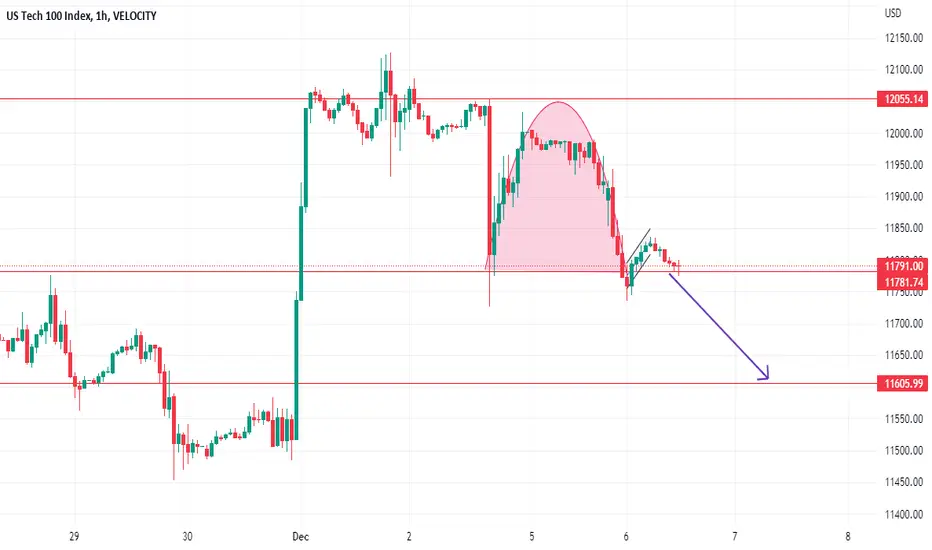
Nasdaq Forming a Bearish pattern . Take a Sell ride Nasdaq making inverted cup and handle formation and after completing its handle retracement it is going down with the major support area of 11605.
Stop loss area should be the 11850 .
Buying NASDAQ at previous swing highs.NASDAQ - Intraday - We look to Buy at 11611 (stop at 11494)
Buying pressure from 11726 resulted in all the initial daily selloff being recaptured.
A Fibonacci confluence area is located at 12002.
The bias remains mildly bullish but there is scope for a move in either direction at the open.
Bespoke support is located at 11615.
Our profit targets will be 11615 and 11715
Resistance: 11810 / 12002 / 12232
Support: 11609 / 11476 / 10664
Disclaimer – Saxo Bank Group.
Please be reminded – you alone are responsible for your trading – both gains and losses. There is a very high degree of risk involved in trading. The technical analysis , like any and all indicators, strategies, columns, articles and other features accessible on/though this site (including those from Signal Centre) are for informational purposes only and should not be construed as investment advice by you. Such technical analysis are believed to be obtained from sources believed to be reliable, but not warrant their respective completeness or accuracy, or warrant any results from the use of the information. Your use of the technical analysis , as would also your use of any and all mentioned indicators, strategies, columns, articles and all other features, is entirely at your own risk and it is your sole responsibility to evaluate the accuracy, completeness and usefulness (including suitability) of the information. You should assess the risk of any trade with your financial adviser and make your own independent decision(s) regarding any tradable products which may be the subject matter of the technical analysis or any of the said indicators, strategies, columns, articles and all other features.
Please also be reminded that if despite the above, any of the said technical analysis (or any of the said indicators, strategies, columns, articles and other features accessible on/through this site) is found to be advisory or a recommendation; and not merely informational in nature, the same is in any event provided with the intention of being for general circulation and availability only. As such it is not intended to and does not form part of any offer or recommendation directed at you specifically, or have any regard to the investment objectives, financial situation or needs of yourself or any other specific person. Before committing to a trade or investment therefore, please seek advice from a financial or other professional adviser regarding the suitability of the product for you and (where available) read the relevant product offer/description documents, including the risk disclosures. If you do not wish to seek such financial advice, please still exercise your mind and consider carefully whether the product is suitable for you because you alone remain responsible for your trading – both gains and losses.

Buying NASDAQ at previous swing highs.NASDAQ - Intraday - We look to Buy at 11613 (stop at 11463)
Majority of the initial daily losses being recaptured.
Bespoke resistance is located at 12232.
Bespoke support is located at 11613.
An overnight positive theme in Equities has led to a higher open this morning.
The bias remains mildly bullish but there is scope for a move in either direction at the open.
Our profit targets will be 11998 and 12098
Resistance: 12159 / 12232 / 12751
Support: 11490 / 11463 / 11200
Disclaimer – Saxo Bank Group.
Please be reminded – you alone are responsible for your trading – both gains and losses. There is a very high degree of risk involved in trading. The technical analysis , like any and all indicators, strategies, columns, articles and other features accessible on/though this site (including those from Signal Centre) are for informational purposes only and should not be construed as investment advice by you. Such technical analysis are believed to be obtained from sources believed to be reliable, but not warrant their respective completeness or accuracy, or warrant any results from the use of the information. Your use of the technical analysis , as would also your use of any and all mentioned indicators, strategies, columns, articles and all other features, is entirely at your own risk and it is your sole responsibility to evaluate the accuracy, completeness and usefulness (including suitability) of the information. You should assess the risk of any trade with your financial adviser and make your own independent decision(s) regarding any tradable products which may be the subject matter of the technical analysis or any of the said indicators, strategies, columns, articles and all other features.
Please also be reminded that if despite the above, any of the said technical analysis (or any of the said indicators, strategies, columns, articles and other features accessible on/through this site) is found to be advisory or a recommendation; and not merely informational in nature, the same is in any event provided with the intention of being for general circulation and availability only. As such it is not intended to and does not form part of any offer or recommendation directed at you specifically, or have any regard to the investment objectives, financial situation or needs of yourself or any other specific person. Before committing to a trade or investment therefore, please seek advice from a financial or other professional adviser regarding the suitability of the product for you and (where available) read the relevant product offer/description documents, including the risk disclosures. If you do not wish to seek such financial advice, please still exercise your mind and consider carefully whether the product is suitable for you because you alone remain responsible for your trading – both gains and losses.

Buying NASDAQ at support.NASDAQ - Intraday - We look to Buy at 11438 (stop at 11313)
Continued downward momentum from 12085 resulted in the pair posting net daily losses yesterday.
An overnight negative theme in Equities has led to a lower open this morning.
Bespoke support is located at 11438.
A Fibonacci confluence area is located at 9668.
Although the anticipated move higher is corrective, it does offer ample risk/reward today.
Our profit targets will be 11870 and 12000
Resistance: 11705 / 11870 / 12088
Support: 11600 / 11438 / 10634
Disclaimer – Saxo Bank Group.
Please be reminded – you alone are responsible for your trading – both gains and losses. There is a very high degree of risk involved in trading. The technical analysis , like any and all indicators, strategies, columns, articles and other features accessible on/though this site (including those from Signal Centre) are for informational purposes only and should not be construed as investment advice by you. Such technical analysis are believed to be obtained from sources believed to be reliable, but not warrant their respective completeness or accuracy, or warrant any results from the use of the information. Your use of the technical analysis , as would also your use of any and all mentioned indicators, strategies, columns, articles and all other features, is entirely at your own risk and it is your sole responsibility to evaluate the accuracy, completeness and usefulness (including suitability) of the information. You should assess the risk of any trade with your financial adviser and make your own independent decision(s) regarding any tradable products which may be the subject matter of the technical analysis or any of the said indicators, strategies, columns, articles and all other features.
Please also be reminded that if despite the above, any of the said technical analysis (or any of the said indicators, strategies, columns, articles and other features accessible on/through this site) is found to be advisory or a recommendation; and not merely informational in nature, the same is in any event provided with the intention of being for general circulation and availability only. As such it is not intended to and does not form part of any offer or recommendation directed at you specifically, or have any regard to the investment objectives, financial situation or needs of yourself or any other specific person. Before committing to a trade or investment therefore, please seek advice from a financial or other professional adviser regarding the suitability of the product for you and (where available) read the relevant product offer/description documents, including the risk disclosures. If you do not wish to seek such financial advice, please still exercise your mind and consider carefully whether the product is suitable for you because you alone remain responsible for your trading – both gains and losses.

Buying NASDAQ at previous swing highs.NASDAQ - Intraday - We look to Buy at 11601 (stop at 11449)
There is no clear indication that the upward move is coming to an end.
The 261.8% Fibonacci extension is located at 12160 from 10592 to 11191.
Risk/Reward would be poor to call a buy from current levels.
We look to set longs at our bespoke indicator levels (11600).
Our profit targets will be 11991 and 12091.
Resistance: 11933 / 12160 / 12466
Support: 11600 / 11360 / 10667
Disclaimer – Saxo Bank Group.
Please be reminded – you alone are responsible for your trading – both gains and losses. There is a very high degree of risk involved in trading. The technical analysis , like any and all indicators, strategies, columns, articles and other features accessible on/though this site (including those from Signal Centre) are for informational purposes only and should not be construed as investment advice by you. Such technical analysis are believed to be obtained from sources believed to be reliable, but not warrant their respective completeness or accuracy, or warrant any results from the use of the information. Your use of the technical analysis , as would also your use of any and all mentioned indicators, strategies, columns, articles and all other features, is entirely at your own risk and it is your sole responsibility to evaluate the accuracy, completeness and usefulness (including suitability) of the information. You should assess the risk of any trade with your financial adviser and make your own independent decision(s) regarding any tradable products which may be the subject matter of the technical analysis or any of the said indicators, strategies, columns, articles and all other features.
Please also be reminded that if despite the above, any of the said technical analysis (or any of the said indicators, strategies, columns, articles and other features accessible on/through this site) is found to be advisory or a recommendation; and not merely informational in nature, the same is in any event provided with the intention of being for general circulation and availability only. As such it is not intended to and does not form part of any offer or recommendation directed at you specifically, or have any regard to the investment objectives, financial situation or needs of yourself or any other specific person. Before committing to a trade or investment therefore, please seek advice from a financial or other professional adviser regarding the suitability of the product for you and (where available) read the relevant product offer/description documents, including the risk disclosures. If you do not wish to seek such financial advice, please still exercise your mind and consider carefully whether the product is suitable for you because you alone remain responsible for your trading – both gains and losses.
