NSDQ100 bullish continuation supported at 21300Markets & Geopolitics:
Investors are holding back as Trump may try diplomacy before acting against Iran. Oil prices dropped, European stocks rose, and the dollar slipped.
Tensions remain high: Israel hit Iranian missile and nuclear sites, and Iran’s president demanded Israel stop unconditionally. Iran’s foreign minister is in Geneva for talks, and the country is speeding up oil exports.
Technology:
SoftBank’s founder Masayoshi Son wants to partner with TSMC to build a huge AI and robotics hub in Arizona. It’s unclear if TSMC will join, as it’s already investing $165 billion in the US.
US Politics & Immigration:
A court backed Trump’s use of the National Guard during LA protests, despite pushback from California’s governor. A deeper report looks at how immigration raids affect workers.
Trade & Business:
Canada may raise tariffs on US steel and aluminum if trade talks stall. Meanwhile, Temu’s US sales are falling as it cuts back on ads. A Fidelity manager says markets have likely priced in Trump’s tariff threats and sees opportunity in mid-sized companies.
Key Trading Levels:
Resistance Level 1: 22070
Resistance Level 2: 22370
Resistance Level 3: 22780
Support Level 1: 21300
Support Level 2: 21060
Support Level 3: 20820
This communication is for informational purposes only and should not be viewed as any form of recommendation as to a particular course of action or as investment advice. It is not intended as an offer or solicitation for the purchase or sale of any financial instrument or as an official confirmation of any transaction. Opinions, estimates and assumptions expressed herein are made as of the date of this communication and are subject to change without notice. This communication has been prepared based upon information, including market prices, data and other information, believed to be reliable; however, Trade Nation does not warrant its completeness or accuracy. All market prices and market data contained in or attached to this communication are indicative and subject to change without notice.
Ustech100

NSDQ100 Geopolitics, Fed & Rates Outlook Geopolitics & Market Sentiment
Iran-Israel conflict enters its sixth day, raising fears of broader escalation.
Speculation is building that Donald Trump may authorize the use of the Massive Ordnance Penetrator (bunker-buster bomb) to target Iran’s nuclear facilities.
Trump is also meeting with Pakistan’s army chief today for talks on Iran, adding to geopolitical uncertainty.
So far, Iran’s oil infrastructure remains intact, and Hezbollah has stayed out of the conflict, limiting immediate economic fallout.
Fed & Rates Outlook
The Federal Reserve is expected to hold rates steady today as it waits for clearer economic signals amid ongoing Trump policy shifts.
Trump is pressuring the Fed, now arguing for lower rates to cut US debt costs.
Traders are building record positions betting on a dovish Fed shift after Powell's term ends in May 2026.
Market Implications for NSDQ100
Nasdaq futures are mildly positive, supported by:
Stability in tech earnings outlook
Expectations of Fed staying on hold, with a possible dovish bias emerging
However, Middle East tensions remain a risk. Any strike on oil infrastructure or major military escalation could:
Trigger a risk-off move
Push oil prices higher, raising inflation concerns
Weigh on tech stocks sensitive to rate outlooks and sentiment
Key Focus for Nasdaq Traders Today:
Fed decision and Powell’s tone (especially on inflation and growth risks)
Headlines from the Middle East
Oil price action near the five-month high (WTI around $73.50–$74)
Resistance Level 1: 22070
Resistance Level 2: 22370
Resistance Level 3: 22780
Support Level 1: 21300
Support Level 2: 21060
Support Level 3: 20820
This communication is for informational purposes only and should not be viewed as any form of recommendation as to a particular course of action or as investment advice. It is not intended as an offer or solicitation for the purchase or sale of any financial instrument or as an official confirmation of any transaction. Opinions, estimates and assumptions expressed herein are made as of the date of this communication and are subject to change without notice. This communication has been prepared based upon information, including market prices, data and other information, believed to be reliable; however, Trade Nation does not warrant its completeness or accuracy. All market prices and market data contained in or attached to this communication are indicative and subject to change without notice.

USTECH Long Opportunity USTECH is currently on a break out to the upside, resuming the bullish trend. Price broke out above $21820 and is currently on a retracement where it could potentially provide a break and retest level at $21820.
Price is trading above the 50 SMA and is currently showing bullish momentum coming out of the RSI.
There is bullish structure amidst the consolidation present thus its important to trade cautious. Looking to the ride the bullish wave from the $21820 to the resistance at $22050.

Bearish reversal off pullback resistance?USTEC is rising toward the pivot, which serves as a pullback resistance. A reversal from this level could indicate a double top pattern, potentially leading to a price drop to the 1st support.
Pivot: 22,270.83
1st Support: 21,142.23
1st Resistance: 23,070.85
Risk Warning:
Trading Forex and CFDs carries a high level of risk to your capital and you should only trade with money you can afford to lose. Trading Forex and CFDs may not be suitable for all investors, so please ensure that you fully understand the risks involved and seek independent advice if necessary.
Disclaimer:
The above opinions given constitute general market commentary, and do not constitute the opinion or advice of IC Markets or any form of personal or investment advice.
Any opinions, news, research, analyses, prices, other information, or links to third-party sites contained on this website are provided on an "as-is" basis, are intended only to be informative, is not an advice nor a recommendation, nor research, or a record of our trading prices, or an offer of, or solicitation for a transaction in any financial instrument and thus should not be treated as such. The information provided does not involve any specific investment objectives, financial situation and needs of any specific person who may receive it. Please be aware, that past performance is not a reliable indicator of future performance and/or results. Past Performance or Forward-looking scenarios based upon the reasonable beliefs of the third-party provider are not a guarantee of future performance. Actual results may differ materially from those anticipated in forward-looking or past performance statements. IC Markets makes no representation or warranty and assumes no liability as to the accuracy or completeness of the information provided, nor any loss arising from any investment based on a recommendation, forecast or any information supplied by any third-party.

NSDQ100 INTRADAY awaits US CPI data Trade:
The US and China agreed on a basic plan to restart trade in sensitive goods. China will speed up rare earth exports, and the US may ease some export rules. The deal still needs approval from Trump and Xi. A court also ruled Trump can keep his global tariffs for now. Markets dipped due to the lack of details, and focus is now on US inflation data.
Protests:
LA had a quieter night after setting a downtown curfew. Anti-ICE protests spread to more cities. Trump’s move to send the military to LA is drawing controversy.
Key Support and Resistance Levels
Resistance Level 1: 22070
Resistance Level 2: 22370
Resistance Level 3: 22680
Support Level 1: 21300
Support Level 2: 21060
Support Level 3: 20820
This communication is for informational purposes only and should not be viewed as any form of recommendation as to a particular course of action or as investment advice. It is not intended as an offer or solicitation for the purchase or sale of any financial instrument or as an official confirmation of any transaction. Opinions, estimates and assumptions expressed herein are made as of the date of this communication and are subject to change without notice. This communication has been prepared based upon information, including market prices, data and other information, believed to be reliable; however, Trade Nation does not warrant its completeness or accuracy. All market prices and market data contained in or attached to this communication are indicative and subject to change without notice.

Nasdaq will reach 25'000 still no body see it?Current level: 21,876
Previous ATH: 22,222.61
Next stop? Well… if you ask the pivot levels they're whispering "23347.20, baby."
What we’re looking at is not just a strong recovery it’s a market that refuses to take a breather. With weekly candles forming higher lows and pivot zones behaving like polite suggestions rather than resistance, it’s hard not to think the index is gearing up for a proper breakout.
Sure, skeptics will say we’re overextended. Bears will point to the volume spikes and say “exhaustion.” But momentum? She's dancing in stilettos on top of R3 like it's a catwalk.
Now, here's the fun part:
If this rhythm keeps up and if inflation, rates, and the Fed behave like decent background characters then 25,000 by the end of the year isn’t just possible. It's that slightly overconfident friend at the party who's already halfway into a celebratory toast.
So… who dares to trust the trend?
Because let’s be honest: being early is painful, being late is expensive but being in the trend? That’s just good business.
📈 Trade safe, manage risk, and don’t fight the trend. Unless you're into that kind of thrill.
#tradehills #Pscarfo

Bullish continuation?USTEC is falling towards the pivot and could bounce to the 1st resistance.
Pivot: 21,115.24
1st Support: 20,647.83
1st Resistance: 22,217.62
Risk Warning:
Trading Forex and CFDs carries a high level of risk to your capital and you should only trade with money you can afford to lose. Trading Forex and CFDs may not be suitable for all investors, so please ensure that you fully understand the risks involved and seek independent advice if necessary.
Disclaimer:
The above opinions given constitute general market commentary, and do not constitute the opinion or advice of IC Markets or any form of personal or investment advice.
Any opinions, news, research, analyses, prices, other information, or links to third-party sites contained on this website are provided on an "as-is" basis, are intended only to be informative, is not an advice nor a recommendation, nor research, or a record of our trading prices, or an offer of, or solicitation for a transaction in any financial instrument and thus should not be treated as such. The information provided does not involve any specific investment objectives, financial situation and needs of any specific person who may receive it. Please be aware, that past performance is not a reliable indicator of future performance and/or results. Past Performance or Forward-looking scenarios based upon the reasonable beliefs of the third-party provider are not a guarantee of future performance. Actual results may differ materially from those anticipated in forward-looking or past performance statements. IC Markets makes no representation or warranty and assumes no liability as to the accuracy or completeness of the information provided, nor any loss arising from any investment based on a recommendation, forecast or any information supplied by any third-party.

NSDQ100 INTRADAY ahead of ADP Jobs andd PMI dataToday’s key focus is on U.S. jobs and services data, and the Fed’s tone.
Markets will react to signs of inflation, growth and the Feds speech which could indicate a shift in direction of its core policy.
Key Support and Resistance Levels
Resistance Level 1: 22040
Resistance Level 2: 22250
Resistance Level 3: 22690
Support Level 1: 22330
Support Level 2: 22010
Support Level 3: 20780
This communication is for informational purposes only and should not be viewed as any form of recommendation as to a particular course of action or as investment advice. It is not intended as an offer or solicitation for the purchase or sale of any financial instrument or as an official confirmation of any transaction. Opinions, estimates and assumptions expressed herein are made as of the date of this communication and are subject to change without notice. This communication has been prepared based upon information, including market prices, data and other information, believed to be reliable; however, Trade Nation does not warrant its completeness or accuracy. All market prices and market data contained in or attached to this communication are indicative and subject to change without notice.

Can Tech Strength Still Drive Markets Amid Trade Tensions?Macro approach:
The Nasdaq 100 (USTEC) began Jun with strong momentum after its best monthly performance since 2023, fueled by robust tech earnings and a brief lull in tariff concerns.
- However, renewed US-China trade tensions resurfaced early in the week, briefly weighing on sentiment before a market rebound restored cautious optimism.
- Nvidia (NVDA) surged due to the continued demand for AI chips. At the same time, Tesla (TSLA) drew investor focus ahead of its 12 Jun robotaxi launch, helping maintain positive momentum in the face of geopolitical uncertainty.
Technical approach:
- USTEC is now testing the previous swing high near 218000, staying above both EMAs, a sign of ongoing bullish strength.
- A clear break above 21800 would likely open the path toward the record-high zone near 22200.
- Failure to do so may trigger a pullback toward the nearest support of around 20700.
Analysis by: Dat Tong, Senior Financial Markets Strategist at Exness

US100 - Bullish Momentum Favors Upside ContinuationThe US Tech 100 is displaying strong bullish momentum after successfully breaking above the critical resistance level at 20,659.8, which had previously acted as a significant barrier. Currently trading at 21,316 the index has demonstrated impressive upward trajectory following what appears to be a healthy consolidation phase around the key resistance-turned-support zone. The technical setup strongly favors continuation to the upside as the higher probability scenario, with the breakout above 20,659.8 potentially opening the door for further gains toward higher resistance levels. However, prudent risk management suggests taking this rally piece by piece, monitoring how price action develops at each significant level while watching for any signs of exhaustion or pullback that might offer better entry opportunities. The bullish bias remains intact as long as the index maintains its position above the former resistance level, which should now serve as dynamic support for any potential retracements.
Disclosure: I am part of Trade Nation's Influencer program and receive a monthly fee for using their TradingView charts in my analysis.

NSDQ100 INTRADAY at pivotal level ?Tariffs & Trade:
The Trump administration is exploring ways to push through import tariffs, possibly including a temporary 15% tariff for 150 days.
A federal appeals court has paused a suspension of the tariffs for now.
Markets:
US stocks are holding up well. The S&P 500 is on track for its best May since 1990.
However, June may be weaker, and futures suggest a quieter trading day ahead.
Federal Reserve & Tax Concerns:
President Trump urged Fed Chair Jerome Powell to cut interest rates in a recent meeting.
Wall Street is uneasy about a tax measure in Trump’s bill that may increase taxes on foreign investors in US assets.
Europe:
The European Central Bank is expected to cut interest rates next week and again in September, possibly settling at 1.75% until the end of 2026.
Bank of England Governor Andrew Bailey pushed for a stronger EU trade deal and emphasized a slow and cautious approach to rate cuts.
Geopolitics:
Russia hasn’t provided a peace talk agenda to Ukraine or its allies.
Hamas is reviewing a US-backed ceasefire plan but says it doesn’t yet meet its demands.
Key Support and Resistance Levels
Resistance Level 1: 21850
Resistance Level 2: 22050
Resistance Level 3: 22200
Support Level 1: 21000
Support Level 2: 20770
Support Level 3: 20560
This communication is for informational purposes only and should not be viewed as any form of recommendation as to a particular course of action or as investment advice. It is not intended as an offer or solicitation for the purchase or sale of any financial instrument or as an official confirmation of any transaction. Opinions, estimates and assumptions expressed herein are made as of the date of this communication and are subject to change without notice. This communication has been prepared based upon information, including market prices, data and other information, believed to be reliable; however, Trade Nation does not warrant its completeness or accuracy. All market prices and market data contained in or attached to this communication are indicative and subject to change without notice.

Nasdaq analysis: 29-May-2025Good morning, everyone! Today's Nasdaq analysis is designed to educate and empower. Use these insights to refine your price action trading strategy.

NASDAQ Potential Bullish ContinuationNASDAQ price action seems to exhibit signs of potential Bullish momentum as the price action may form a credible Higher High (after tarriff delays on the EU) with multiple confluences through key Fibonacci and Support levels which presents us with a potential long opportunity.
Trade Plan:
Entry : 21600
Stop Loss : 20550
TP 1: 22649
NSDQ100 INTRADAY resistance retest ahead of US OpenThe USD continues to rally, driven by:
A strong rebound in US Consumer Confidence, reversing a six-month downtrend.
A decline in the number of Americans expecting a recession, improving risk sentiment.
This positive momentum helped offset weaker April Durable Goods Orders, which reflected business concerns tied to Trump’s tariff policies.
Trump Signals Progress with EU Trade Talks
Trump stated on Truth Social that the EU is moving quickly to begin trade negotiations after he expressed satisfaction with a proposed 50% tariff.
Markets could interpret this as a step toward de-escalation, potentially supporting US equities and the USD, while posing risk to EU markets if tensions resume.
SpaceX Test Failure
SpaceX’s Starship test failed mid-flight. While a technical setback, broader market impact is likely minimal unless similar failures persist.
Could marginally affect aerospace and space-related stocks.
Elon Musk on Crypto & Tax Policy
Musk criticized Trump’s tax bill, claiming it undermines DOGE and broader crypto innovation.
Slightly negative for crypto sentiment, particularly speculative tokens like Dogecoin.
Earnings in Focus
Nvidia (NVDA):
Market will watch for signs of weaker China-related growth, tied to Trump’s policy on semiconductors and AI.
Key impact expected on tech stocks, semis, and the NASDAQ.
Salesforce (CRM):
Focus on adoption of new AI tools and updates on the $8 billion Informatica acquisition.
Could affect broader enterprise software and cloud sector sentiment.
Key Support and Resistance Levels
Resistance Level 1: 21520
Resistance Level 2: 21850
Resistance Level 3: 22200
Support Level 1: 21000
Support Level 2: 20770
Support Level 3: 20560
This communication is for informational purposes only and should not be viewed as any form of recommendation as to a particular course of action or as investment advice. It is not intended as an offer or solicitation for the purchase or sale of any financial instrument or as an official confirmation of any transaction. Opinions, estimates and assumptions expressed herein are made as of the date of this communication and are subject to change without notice. This communication has been prepared based upon information, including market prices, data and other information, believed to be reliable; however, Trade Nation does not warrant its completeness or accuracy. All market prices and market data contained in or attached to this communication are indicative and subject to change without notice.

Actionable Nasdaq insights: 28-May-2025Rise and shine, traders! Start your day with actionable Nasdaq insights. Let's grow your skills together, one chart at a time.

Nasdaq market analysis: 27-May-2025Good morning, traders! Welcome to today's Nasdaq market analysis. Compare my price action insights with your own charts and enhance your trading skills.

Nasdaq trading insights: 26-May-2025Nasdaq trading insights: Not signals, but informative zones to aid your decision-making. Please note: These zones are not trading advice. Use them as a starting point for your own analysis.

USTEC100 Chart 4H, Trends To Watch for Short The provided USTEC 100 (US Tech 100) 4-hour chart highlights a strategic short (sell) trade setup based on technical price action and defined risk levels. The analysis suggests a bearish market bias, provided that specific price conditions are met and maintained. Let's explore the details and rationale behind this trade idea to understand how traders might approach this setup with calculated entries, targets, and stops.
As per the current market data presented, USTEC 100 is trading around 21,115.00 on Monday, 19 May 2025. The chart emphasizes a critical resistance zone highlighted in red, located at approximately 21,445.10. This level acts as a potential invalidation point for the short trade. If the price crosses above this red zone and a full candle closes above it, the entire bearish setup becomes invalid. This is a key condition – any move above this threshold signifies a shift in market sentiment and cancels the downward outlook.

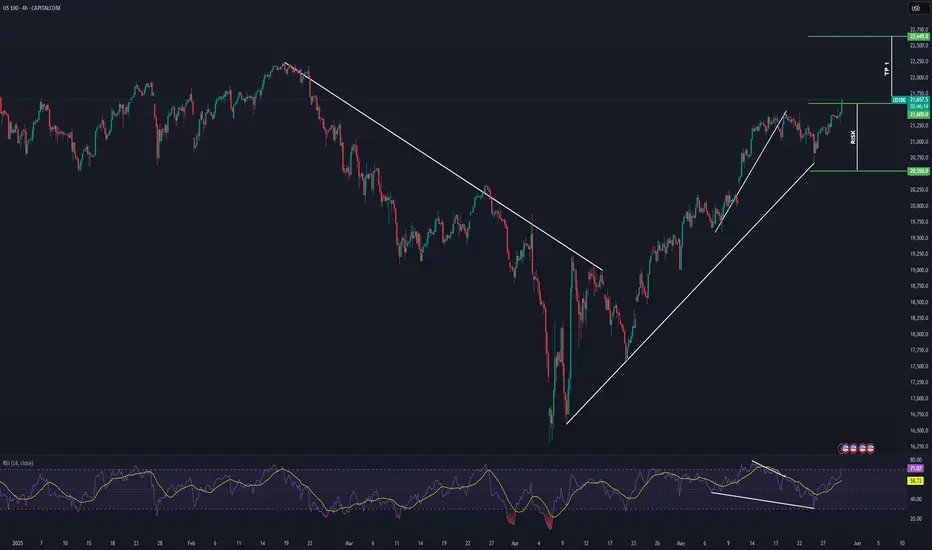
NASDAQ Potential Bullish Reversal OpportunityNASDAQ price action went through a massive correction during the global tariff war.
However after potential recent developments, we may finally see a direction towards the resolution of widespread tariff based uncertainty across the macro economic landscape.
This presents us with a potential Reversal opportunity if we see the formation of a credible Higher High (given a potential proper break out) on the Daily and shorter timeframes.
Trade Plan :
Entry @ 20440
Stop Loss @ 19500
TP 1 @ 21380

US Tech 100 setting sight for ALL time highs - Target 23,671Buy the dip. Never fails as the American markets will always recover.
The question is however, where is the bottom of the DIP and have I considered what risk to take if it continues to dip.
That is what actually causes portfolios to get blown.
However, I don't buy Dips. In fact, I don't buy low, sell high.
I buy HIGH sell HIGHER. Always have always will.
When momentum is on the way, it is better to get on the trend and ride it on up.
And that is WHAT the US Tech 100 is showing or the Nasdaq.
Technicals look great too.
Inv Head and Shoulders
Price>20 and 200MA
Target 23,671
Disclosure: I am part of Trade Nation's Influencer program and receive a monthly fee for using their TradingView charts in my analysis.

NSDQ100 INTRADAY uptrend continuationUS-China Trade Talks:
The Trump administration is considering cutting tariffs on Chinese goods to below 60% during upcoming talks. China may reciprocate. Chinese exports to the US have already dropped sharply following earlier steep tariffs.
Global Market Reaction:
Germany's DAX index hit a new high, recovering losses from the trade war. European stocks are rising on hopes of lower tariffs and potential rate cuts from the European Central Bank.
US Tax Policy:
Trump is urging Congress to raise taxes on the wealthy, proposing a 39.6% rate for individuals earning $2.5 million or more (or $5 million for couples).
Panasonic Job Cuts:
Panasonic plans to cut 10,000 jobs to improve profitability by focusing on growth areas and reducing operations in weaker sectors like TVs and industrial devices.
Key Support and Resistance Levels
Resistance Level 1: 20530
Resistance Level 2: 20730
Resistance Level 3: 20950
Support Level 1: 19640
Support Level 2: 19325
Support Level 3: 19030
This communication is for informational purposes only and should not be viewed as any form of recommendation as to a particular course of action or as investment advice. It is not intended as an offer or solicitation for the purchase or sale of any financial instrument or as an official confirmation of any transaction. Opinions, estimates and assumptions expressed herein are made as of the date of this communication and are subject to change without notice. This communication has been prepared based upon information, including market prices, data and other information, believed to be reliable; however, Trade Nation does not warrant its completeness or accuracy. All market prices and market data contained in or attached to this communication are indicative and subject to change without notice.

NSDQ100 INTRADAY awaits Fed Rate Decision Macro & Central Banks
The Federal Reserve is expected to keep interest rates unchanged. Officials say policy is well-positioned, despite political frustration.
China is adding stimulus: cutting rates, reducing bank reserve requirements, and increasing gold reserves for the sixth month in a row.
Markets
U.S. stock futures are higher.
The U.S. dollar is recovering after three days of declines.
The U.S. and China will restart trade talks — the first since the Trump-era tariff war.
Companies
Novo Nordisk shares are rising on expectations of less competition for its obesity drug Wegovy.
WeightWatchers has filed for bankruptcy.
Earnings reports this morning: Walt Disney, Uber, Barrick Gold.
Earnings reports this afternoon: Arm Holdings, Occidental Petroleum, Carvana, Flutter.
Key Support and Resistance Levels
Resistance Level 1: 20,190
Resistance Level 2: 20,510
Resistance Level 3: 20,930
Support Level 1: 19,330
Support Level 2: 19,020
Support Level 3: 18,570
This communication is for informational purposes only and should not be viewed as any form of recommendation as to a particular course of action or as investment advice. It is not intended as an offer or solicitation for the purchase or sale of any financial instrument or as an official confirmation of any transaction. Opinions, estimates and assumptions expressed herein are made as of the date of this communication and are subject to change without notice. This communication has been prepared based upon information, including market prices, data and other information, believed to be reliable; however, Trade Nation does not warrant its completeness or accuracy. All market prices and market data contained in or attached to this communication are indicative and subject to change without notice.
