Nasdaq market analysis: 03-APRIL-2025Good morning Dear Traders! Join me for Nasdaq market analysis for the today. Share your charts, ask questions, and let's discuss trading strategies.
Ustech100

NSDQ100 INTRADAY ahead of tariff announcement Donald Trump’s team is finalizing options for a reciprocal tariff plan, with proposals including a tiered system and a customized approach. Markets await clarity from the president’s 4 p.m. Rose Garden announcement, which could impact trade and financial markets.
Resistance Level 1: 19579
Resistance Level 2: 19962
Resistance Level 3: 20345
Support Level 1: 19077
Support Level 2: 18815
Support Level 3: 18434
This communication is for informational purposes only and should not be viewed as any form of recommendation as to a particular course of action or as investment advice. It is not intended as an offer or solicitation for the purchase or sale of any financial instrument or as an official confirmation of any transaction. Opinions, estimates and assumptions expressed herein are made as of the date of this communication and are subject to change without notice. This communication has been prepared based upon information, including market prices, data and other information, believed to be reliable; however, Trade Nation does not warrant its completeness or accuracy. All market prices and market data contained in or attached to this communication are indicative and subject to change without notice.

Nasdaq trading zones: 02-APRIL-2025Discover today's Nasdaq trading zones and refine your market analysis skills.

NASDAQ Bullish Reversal (Potential Tariff Resolution?) NASDAQ price action went through a massive correction with a drop from the top worth approx. 14%.
However after the passing of the latest FOMC Meeting, we may finally see a direction towards the resolution of widespread tariff based uncertainty across the macro economic landscape.
This presents us with a potential Reversal opportunity if we see the formation of a credible Higher High (given a potential proper break out) on the 4 HR and shorter timeframes.
Trade Plan :
Entry @ 20045
Stop Loss @ 19070
TP 0.9 - 1 @ 20923 - 21020

NSDQ100 INTRADAY bearish reaction to US PCE data US PCE Inflation – Market Impact (NASDAQ Focus)
Headline PCE YoY: 2.5% (steady, in line with expectations).
Core PCE YoY: 2.8% (higher than 2.7% prior, above forecasts).
MoM Figures: Headline +0.3%, Core +0.4% (showing steady inflation pressure).
Market Implications for NASDAQ:
Slightly hawkish as Core PCE remains elevated—could delay Fed rate cuts.
Tech stocks (NASDAQ) may face short-term selling pressure as yields react.
If risk appetite holds, dips could present buying opportunities in growth stocks.
Watch Treasury yields & Fed commentary for further market direction.
Key Support and Resistance Levels
Resistance Level 1: 20000
Resistance Level 2: 20350
Resistance Level 3: 20650
Support Level 1: 19,440
Support Level 2: 19,140
Support Level 3: 18880
This communication is for informational purposes only and should not be viewed as any form of recommendation as to a particular course of action or as investment advice. It is not intended as an offer or solicitation for the purchase or sale of any financial instrument or as an official confirmation of any transaction. Opinions, estimates and assumptions expressed herein are made as of the date of this communication and are subject to change without notice. This communication has been prepared based upon information, including market prices, data and other information, believed to be reliable; however, Trade Nation does not warrant its completeness or accuracy. All market prices and market data contained in or attached to this communication are indicative and subject to change without notice.

Nasdaq analysis: 28-MAR-2025Good morning, traders! Today's Nasdaq analysis will help you achieve your trading goals. Let's work together towards success.

Nasdaq analysis: 27-MAR-2025Good morning, traders! Today's Nasdaq analysis will help you achieve your trading goals. Let's work together towards success.

NSDQ100 INTRADAY no reaction to durable goods dataThe US Census Bureau reported that Durable Goods Orders increased 0.9% ($2.7 billion) in February, reaching $289.3 billion. This follows a revised 3.3% gain in January and beats market expectations of a 1% decline.
Excluding transportation, orders rose 0.7%.
Excluding defense, orders increased 0.8%.
Transportation equipment led the gains, up 1.5% ($1.4 billion) to $98.3 billion.
Despite the positive data, equity markets showed little reaction.
Key Support and Resistance Levels
Resistance Level 1: 20,386
Resistance Level 2: 20,658
Resistance Level 3: 21,000
Support Level 1: 19,692
Support Level 2: 19,443
Support Level 3: 19,131
This communication is for informational purposes only and should not be viewed as any form of recommendation as to a particular course of action or as investment advice. It is not intended as an offer or solicitation for the purchase or sale of any financial instrument or as an official confirmation of any transaction. Opinions, estimates and assumptions expressed herein are made as of the date of this communication and are subject to change without notice. This communication has been prepared based upon information, including market prices, data and other information, believed to be reliable; however, Trade Nation does not warrant its completeness or accuracy. All market prices and market data contained in or attached to this communication are indicative and subject to change without notice.

Nasdaq insights: 26-MAR-2025Good morning, traders! As a seasoned price action trader, I'll share my Nasdaq insights to help you improve your trading skills.

Nasdaq analysis: 25-MAR-2025Good morning, trading community! Today's Nasdaq analysis is for you. Share your thoughts, ask questions, and let me help you grow.

US100 - at support? Hold or not??#US100 - well guys market just near to his current supporting region.
That is around 19230 to 10330
Keep close that region because if market hold it in that case we can expect a bounce from here.
Good luck
Trade wisely

Nasdaq market analysis: 24-MAR-2025Good morning! Happy New Week! Happy New Day! Here's your daily Nasdaq market analysis. Learn, grow, and trade wisely.

NSDQ100 The Week Ahead 24th March '25NSDQ100 bearish & oversold, the key trading level is at 20090
This communication is for informational purposes only and should not be viewed as any form of recommendation as to a particular course of action or as investment advice. It is not intended as an offer or solicitation for the purchase or sale of any financial instrument or as an official confirmation of any transaction. Opinions, estimates and assumptions expressed herein are made as of the date of this communication and are subject to change without notice. This communication has been prepared based upon information, including market prices, data and other information, believed to be reliable; however, Trade Nation does not warrant its completeness or accuracy. All market prices and market data contained in or attached to this communication are indicative and subject to change without notice.

Nasdaq analysis: 21-MAR-2025Good morning, traders! Today's Nasdaq analysis will help you achieve your trading goals. Let's work together towards success.

NSDQ100 INTRADAY Bearish oversold bounce back
Key Support and Resistance Levels
Resistance Level 1: 19972
Resistance Level 2: 20127
Resistance Level 3: 20658
Support Level 1: 19124
Support Level 2: 18732
Support Level 3: 18100
This communication is for informational purposes only and should not be viewed as any form of recommendation as to a particular course of action or as investment advice. It is not intended as an offer or solicitation for the purchase or sale of any financial instrument or as an official confirmation of any transaction. Opinions, estimates and assumptions expressed herein are made as of the date of this communication and are subject to change without notice. This communication has been prepared based upon information, including market prices, data and other information, believed to be reliable; however, Trade Nation does not warrant its completeness or accuracy. All market prices and market data contained in or attached to this communication are indicative and subject to change without notice.

NSDQ100 INTRADAY Oversold bounce back capped at 19972Key Support and Resistance Levels
Resistance Level 1: 19972
Resistance Level 2: 20127
Resistance Level 3: 20658
Support Level 1: 19124
Support Level 2: 18732
Support Level 3: 18100
This communication is for informational purposes only and should not be viewed as any form of recommendation as to a particular course of action or as investment advice. It is not intended as an offer or solicitation for the purchase or sale of any financial instrument or as an official confirmation of any transaction. Opinions, estimates and assumptions expressed herein are made as of the date of this communication and are subject to change without notice. This communication has been prepared based upon information, including market prices, data and other information, believed to be reliable; however, Trade Nation does not warrant its completeness or accuracy. All market prices and market data contained in or attached to this communication are indicative and subject to change without notice.

Nasdaq analysis: 18-Mar-2025Good morning, trading community! Today's Nasdaq analysis is for you. Share your thoughts, ask questions, and let me help you grow.

Bullish bounce?USTEC has reacted off the pivot and could potentially rise to the 1st resistance that lines up with the 38.2% Fibonacci retracement.
Pivot: 19,631.95
1st Support: 19,126.61
1st Resistance: 20,332.42
Risk Warning:
Trading Forex and CFDs carries a high level of risk to your capital and you should only trade with money you can afford to lose. Trading Forex and CFDs may not be suitable for all investors, so please ensure that you fully understand the risks involved and seek independent advice if necessary.
Disclaimer:
The above opinions given constitute general market commentary, and do not constitute the opinion or advice of IC Markets or any form of personal or investment advice.
Any opinions, news, research, analyses, prices, other information, or links to third-party sites contained on this website are provided on an "as-is" basis, are intended only to be informative, is not an advice nor a recommendation, nor research, or a record of our trading prices, or an offer of, or solicitation for a transaction in any financial instrument and thus should not be treated as such. The information provided does not involve any specific investment objectives, financial situation and needs of any specific person who may receive it. Please be aware, that past performance is not a reliable indicator of future performance and/or results. Past Performance or Forward-looking scenarios based upon the reasonable beliefs of the third-party provider are not a guarantee of future performance. Actual results may differ materially from those anticipated in forward-looking or past performance statements. IC Markets makes no representation or warranty and assumes no liability as to the accuracy or completeness of the information provided, nor any loss arising from any investment based on a recommendation, forecast or any information supplied by any third-party.

Nasdaq market analysis: 17-MAR-2025Good morning! Happy New Week! Happy New Day! Here's your daily Nasdaq market analysis. Learn, grow, and trade wisely.

Bearish drop?USTEC is rising towards the pivot which is an overlap resistance and could drop to the 1st support which acts as a pullback support.
Pivot: 19,857.80
1st Support: 18,725.96
1st Resistance: 20,398.38
Risk Warning:
Trading Forex and CFDs carries a high level of risk to your capital and you should only trade with money you can afford to lose. Trading Forex and CFDs may not be suitable for all investors, so please ensure that you fully understand the risks involved and seek independent advice if necessary.
Disclaimer:
The above opinions given constitute general market commentary, and do not constitute the opinion or advice of IC Markets or any form of personal or investment advice.
Any opinions, news, research, analyses, prices, other information, or links to third-party sites contained on this website are provided on an "as-is" basis, are intended only to be informative, is not an advice nor a recommendation, nor research, or a record of our trading prices, or an offer of, or solicitation for a transaction in any financial instrument and thus should not be treated as such. The information provided does not involve any specific investment objectives, financial situation and needs of any specific person who may receive it. Please be aware, that past performance is not a reliable indicator of future performance and/or results. Past Performance or Forward-looking scenarios based upon the reasonable beliefs of the third-party provider are not a guarantee of future performance. Actual results may differ materially from those anticipated in forward-looking or past performance statements. IC Markets makes no representation or warranty and assumes no liability as to the accuracy or completeness of the information provided, nor any loss arising from any investment based on a recommendation, forecast or any information supplied by any third-party.

NSDQ100 The Week Ahead 17th March '25NSDQ100 INTRADAY bearish & oversold capped by resistance at 200 DMA.
This communication is for informational purposes only and should not be viewed as any form of recommendation as to a particular course of action or as investment advice. It is not intended as an offer or solicitation for the purchase or sale of any financial instrument or as an official confirmation of any transaction. Opinions, estimates and assumptions expressed herein are made as of the date of this communication and are subject to change without notice. This communication has been prepared based upon information, including market prices, data and other information, believed to be reliable; however, Trade Nation does not warrant its completeness or accuracy. All market prices and market data contained in or attached to this communication are indicative and subject to change without notice.

NSDQ INTRADAY Bearish continuation capped at 19970 New unemployment insurance claims in the US fell to 220,000 for the week ending March 8, slightly below expectations and down from the previous week's revised figure of 222,000 (originally 221,000). The insured unemployment rate remained steady at 1.2%, while the four-week moving average edged up by 1,500 to 226,000.
Meanwhile, continuing jobless claims dropped by 27,000 to 1.87 million for the week ending March 1.
Key Support and Resistance Levels
Resistance Level 19970
Resistance Level 2: 20300
Resistance Level 3: 20660
Support Level 1: 19124
Support Level 2: 18730
Support Level 3: 18220
This communication is for informational purposes only and should not be viewed as any form of recommendation as to a particular course of action or as investment advice. It is not intended as an offer or solicitation for the purchase or sale of any financial instrument or as an official confirmation of any transaction. Opinions, estimates and assumptions expressed herein are made as of the date of this communication and are subject to change without notice. This communication has been prepared based upon information, including market prices, data and other information, believed to be reliable; however, Trade Nation does not warrant its completeness or accuracy. All market prices and market data contained in or attached to this communication are indicative and subject to change without notice.
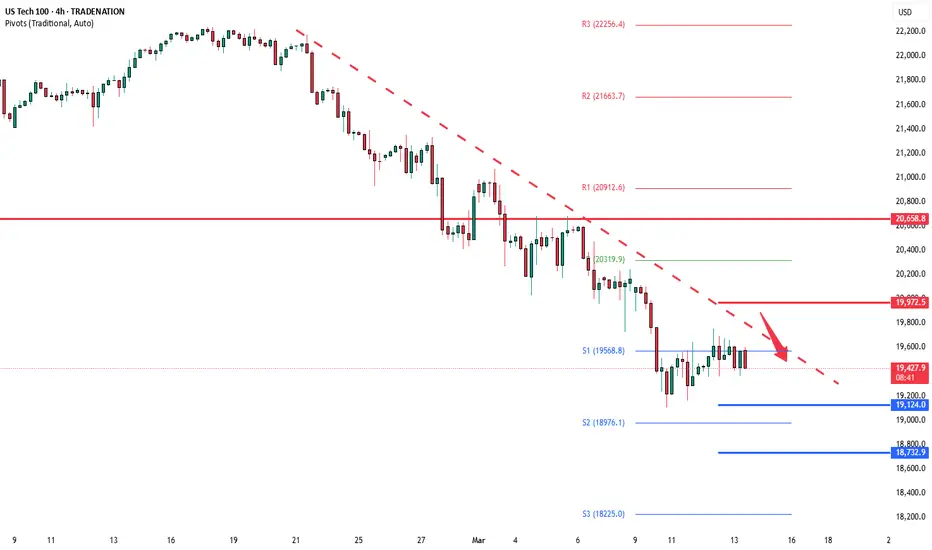
NSDQ100 INTRADAY Key Trading LevelsKey Support and Resistance Levels
Resistance Level 1: 19976
Resistance Level 2: 20300
Resistance Level 3: 20660
Support Level 1: 19570
Support Level 2: 19124
Support Level 3: 18750
This communication is for informational purposes only and should not be viewed as any form of recommendation as to a particular course of action or as investment advice. It is not intended as an offer or solicitation for the purchase or sale of any financial instrument or as an official confirmation of any transaction. Opinions, estimates and assumptions expressed herein are made as of the date of this communication and are subject to change without notice. This communication has been prepared based upon information, including market prices, data and other information, believed to be reliable; however, Trade Nation does not warrant its completeness or accuracy. All market prices and market data contained in or attached to this communication are indicative and subject to change without notice.
