AUDJPY Is Recovering After The Wedge PatternAUDJPY pair is sharply and impulsively recovering after we spotted the wedge pattern, so it’s now rising in minimum three waves A/1-B/2-C/3 that can retrace the price back to the starting point of the wedge pattern and back to 99-100 area, especially if we consider an unfilled GAP at 98.35 level. Currently we can see it making a five-wave impulse into wave A/1, so after corrective pullback in wave B/2, be aware of a bigger rally within wave C or maybe even wave 3 if goes decisively above 100 area.
The ending diagonal (wedge) pattern is a special type of wave that occurs in wave 5 of an impulse or wave C of a correction. An ending diagonal pattern is a type of pattern that can occur at the completion of a strong move. It reflects a “calming” of the market sentiment such that price still moves generally in the direction of the larger move, but not strongly enough to produce an impulsive wave. Ending diagonals consist of five waves, labeled 1-2-3-4-5, where each wave subdivides into three legs. Waves 1 and 4 overlap in price, while wave 3 can not be the shortest amongst waves 1, 3 and 5.
The reason why they are so interesting is because they are indicating a reversal, usually a strong one, which can retrace the price back to the starting point of the pattern.
V-pattern

Is ETH Done Dropping?A few days ago, the crypto market experienced another brutal sell-off, leaving most traders in despair.
But historically, whales love to shake people out before pushing prices up.
Looking back at past bull runs, it’s common to see a sharp crash forming a bearish pattern, only for the price to suddenly skyrocket—leaving everyone behind.
Will it happen again this time?
I can’t say for sure.
But based on the overall market structure— BINANCE:BTCUSDT , BINANCE:ETHUSDT , CRYPTOCAP:BTC.D , CRYPTOCAP:OTHERS , CRYPTOCAP:TOTAL3 —the bull market still seems intact.
Now, let’s talk about ETH.
The recent crash completely invalidated the inverse head-and-shoulders pattern, and that massive wick just happened to hit the weekly M-top target (light blue line).
Zooming out, the massive symmetrical triangle (yellow lines) from 2022 is still holding.
It looks like the whales intentionally broke below the triangle to create a bearish illusion and scare people into selling.
They did the same thing last August to November—three months of shaking out weak hands at the lower edge of the triangle.
At the time, many turned bearish.
Then, whales pumped ETH back into the triangle and even broke the upper boundary.
So right now, we see similar bearish traps :
An M-top that didn’t break the neckline.
A fake breakdown below the triangle’s lower edge without follow-through.
To me, this seems like another deliberate move to clean up weak hands.
Short-term, we’ve probably already hit the bottom.
From here, we’ll watch how the chart develops.
If you’re looking to enter, now seems like a reasonable time—but make sure you set a strict stop-loss.
🔴 for more future script "guesses" like this!

NASDAQ Long1. There is a pattern on M5
2. This trade is with with the H4 Trend
3. Good risk to reward of 1:2.5
4. Stop loss of 70 pips
5. Quick trade as this is likely to come back down so take half profit at M15 Overbought

BTC, time to prepare for the range breakout!Hello everyone,
I detected some interesting patterns in the current Bitcoin daily chart.
The first range boundary was set mid of November 24, the upper range boundary on Dezember 17. The retest of the lower boundary was at January 13. Maybe you realise the time between the price events is very similiar, so I would expect to see a breakout to happen around the 10th of February (+/- 5 days) . This aligns very well with the seasonal pattern (February is the strongest month for BTC in historical data).
Also we are printing higher lows and are back in the upper part of the range, which is a good position to get ready for the breakout. Targets in the region of 120k are very likely within the next weeks. This aligns very well with the wave count I follow for a while now. You can see the bigger picture in other ideas I published.

Crude Oil Analysis near resistance areaAs the market continues to react to various economic indicators and geopolitical developments, Crude Oil prices are currently at a pivotal point.
Below are two potential scenarios based on the current market conditions.
Current Analysis: Crude Oil is currently facing a critical resistance zone between $71.5 and $72.8. Based on the price action and market sentiment, I foresee two potential scenarios:
Scenario 1: Bearish Reversal
Resistance Strength: The resistance at $71.5 and $72.8 is strong.
Expected Movement: If the price fails to break through this resistance, I anticipate a rebound, leading to a decline towards the $68-$69 area.
Action Plan:
Entry Signal: Monitor for bearish price action signals, such as a Shooting Star or a Bearish Engulfing Pattern, indicating a potential reversal.
Entry Point: Enter a short position upon confirmation of the bearish signal.
Target: Set a target at the $68-$69 range.
Stop Loss: Place a stop loss at $72.8 to manage risk effectively.
Scenario 2: Bullish Breakout
Resistance Strength: The resistance at $71.5 and $72.8 is weak.
Expected Movement: If the price successfully breaks above this resistance, I expect it to rally towards the $77-$77.5 area.
Action Plan:
Entry Signal: Wait for a confirmed close above $72.8, ideally accompanied by a strong bullish candle (preferably a long green candle) to validate the breakout.
Entry Point: Enter a long position upon confirmation of the breakout.
Target: Set a target in the $78-$79 range.
Stop Loss: Place a stop loss at $71.5 to protect against potential reversals.
Summary
The key levels to watch are $71.5 and $72.8 for potential reversals or breakouts. I will wait for confirmation through price action signals befare takeing a decision.

DOW Upside 47600 OR Downside 40024 Technical AnalysisResistance from Channel
Election Rally Over
Strict Sanctions and Reciprocations

what is happening to BTC right now ?! 🐺 "Hello, KIUCOIN family . I hope you're doing well. 🐺
In this analysis, I've decided to explain what's likely to happen to the BTC price in the immediate short term and the long term. Be sure to stay tuned with me until the end, as it's going to be mind-blowing." 🤯
"First of all, let's examine the monthly chart. In my opinion, this is one of the best timeframes, especially for this analysis, because it reveals extraordinary price targets. Let's dive into it :
As you can see on the monthly chart , BTC is between two uptrend curves that have acted as support and resistance since 2015 . These curves are fairly strong, justifying their classification as strong support and resistance lines on the monthly timeframe.
As you may already know, the higher the timeframe we examine, the more accurate results we can achieve. Therefore, the patterns on the monthly timeframe are much more accurate than those formed on the daily or even the weekly timeframe. In this case, we have a clear and perfect bullish flag pattern . This is a bullish pattern, and its main target, which aligns with our resistance line, is around $165,000. 🔥🐺🚀
So let's reveals more details for you dear 🐺KIUCOIN🐺 family :
In the chart above, on the weekly timeframe, we have a clear AB=CD pattern . This is a well-known pattern in harmonic trading and, in my opinion, is quite accurate. Seven out of ten times, these patterns reach their targets, making them a valuable tool for traders .
So I think there is another secret reason for us to pay attention to it :
BTC.D
As you can see in the chart above, BTC.D is currently within a symmetrical triangle, which could also be considered an ascending triangle in this case. It appears to be on the verge of breaking out. In my opinion, if BTC.D breaks through this resistance level, it could be incredibly beneficial for the BTC price , potentially leading to a significant rally up to $165,000. However, this could also be challenging for altcoins and ETH . While they might also experience pumps alongside BTC, these pumps are likely to be less substantial. After such a BTC-led rally, we could expect a massive altcoin and ETH season. So, stay tuned with me until that time, as we could potentially make life-changing money together during this market cycle.
Now finally it's time to take look at the lower time frame :
As you can see on the daily timeframe , if BTC breaks through the orange resistance line , we could consider entering a long position with a target of the previous all-time high. You could also take some profits at a predetermined level and set your stop at the entry point to protect your initial investment. The remaining position could then potentially continue to generate profits, leading to a higher target of $165,000.
I hope you enjoy this idea dear KIUCOIN family , also always remember :
🐺 Discipline is rarely enjoyable , But almost always profitable 🐺

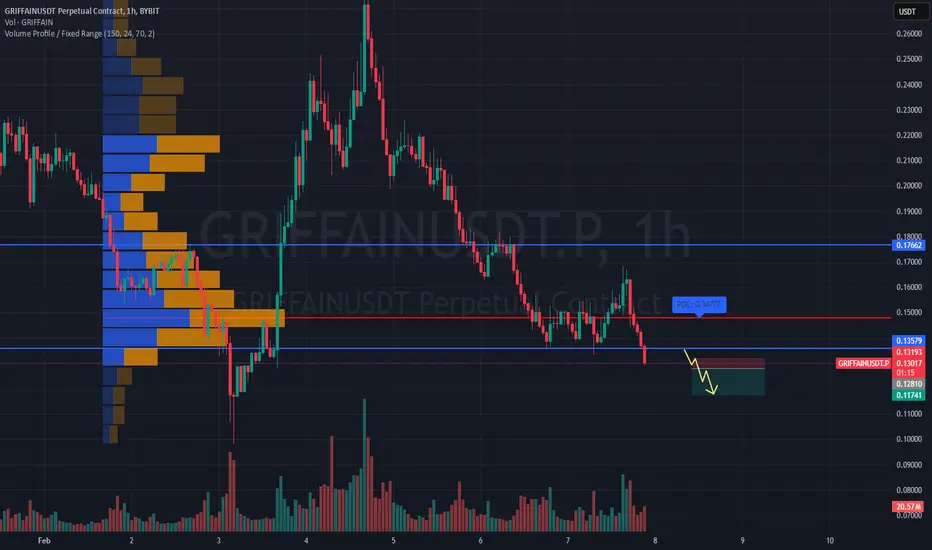
SHORT #GRIFFAINUSDT expecting further downside📉 SHORT BYBIT:GRIFFAINUSDT.P from $0.12810
🛡 Stop loss $0.13193
⏱ Timeframe: 1H
✅ Overview:
➡️ BYBIT:GRIFFAINUSDT.P is showing weakness after reaching a local high, rejecting from a resistance zone.
➡️ POC (Point of Control) at 0.13193 acts as a key volume area with significant trading activity.
➡️ Price action suggests seller dominance, indicating a potential continuation of the downtrend.
➡️ If the 0.12810 support level breaks, expect an increase in bearish momentum.
⚡ Plan:
➡️ Short entry upon confirmation of a breakdown below 0.12810.
➡️ Increased selling volume will confirm the continuation of the bearish trend.
➡️ Holding the position with dynamic monitoring until the first Take Profit level.
🎯 TP Targets:
💎 TP 1: 0.11741 – first target based on the nearest support level.
📢 BYBIT:GRIFFAINUSDT.P is showing bearish signs, but volume and pullback dynamics should be monitored.
📢 A break below 0.12810 could trigger a deeper decline.
📢 If buyers show strength, watch 0.13193 as a possible reversal point.
🚀 BYBIT:GRIFFAINUSDT.P maintains bearish momentum — expecting further downside!
BTC & ALTCOINSIn this chart we can see Bitcoin historical Highs , lows , halving years (green->green) and halvings ... we can see some patterns here , not price patterns but sessionality patterns .. for example .. strong probabilty next btc HIGH will be in November/December this year , or we can also see on chart of BTC.D .. we are close to date when BTC.D breaks and fall as much as alts shine .. But all of this was history what about today ? What if , in this one cycle is something different , for example players ... Old good BTC and Crypto OG players now have less power as manipulators , we have some guys from wallstreet also here , Trump and much more .. Macroeconomic was totaly changed ... so what do you think guys ?

nifty50NSE:NIFTY
ONE SHOULD WAIT FOR FURTHER Breakout ON WEEKLY BASIS.
Note :
1. One should go long with a Stop Loss, below the Trendline or the Previous Swing Low.
2. Risk :Reward ratio should be minimum 1:2.
3. Plan your trade as per the Money Management and Risk Appetite.
Disclaimer :
>You are responsible for your profits and loss.
>The idea shared here is purely for Educational purpose.
>Follow back, for more ideas and their notifications on your email.
>Support and Like incase the idea works for you.

WALL STREET LONGAll timeframes are oversold and there is a lot of divergnece
There is no pattern but this is with the trend
100 pip stop loss
entered at 43895
Take half at M15 overbought

GER30 Long There is no pattern to go long but this is at target 2 of a short pattern above
This is with the H4 trend and there is a lot of support at this level
After the fast drop this tends to bounce back up
stop loss of 100 pips

TURBO IS STILL ON TRACK FOR TAKE OFF !!! (PACK YOUR BAGS) If you have been following my trade trends on Turbo, from the Beginning "TRIPPLE BULL FLAG ON TURBO", well since then we have had both TRUMP coin and DEEP SEEK remove Liquidity from the entire market and pushing the trend into a descending bear flag, Scary times!
But our friend TURBO refused to postpone take off for too long, having broken the bear flag is now heading back into position for TAKE OFF ! ..
TIME FRAME IS LISTED BELOW ! PACK YOUR BAGS ! NEXT STOP 1.5-2 Cents !
I am not a professional trader, I just enjoy technical analysis if you understand the charts than hopefully you can see the same pattern emerging.
TURBO to 1.4 - 2.2 cents by FEBUARY 16th 2025 <---- MY PREDICTION

29.01.25 Morning ForecastPairs on Watch -
FX:GBPNZD
FX:EURGBP
FX:AUDUSD
FX:EURUSD
A short overview of the instruments I am looking at for today, multi-timeframe analysis down to what I will be looking at for an entry. Enjoy!

BTC - Steady... steady... almost there!BTC in the short term is looking very much like a WXYXZ is forming. We should therefore see a low, which could temporarily breach the lower trend line. In fact, it'd make for a bullish signal if it did - so watch this carefully. If we see it ping back within the channel, then the formation will likely complete. Next thing we'll need to look for us the breakthrough of the upper trend line. This would then lead to higher higher and the completion of wave 5 of 1 which we have long been looking for. I'm not going to take any actions here until either trend line is decisively broken leading to a trend change. Looks good though, follow for more.

BRITANNIANSE:BRITANNIA
Note :
1. One should go long with a Stop Loss, below the Trendline or the Previous Swing Low.
2. Risk :Reward ratio should be minimum 1:2.
3. Plan your trade as per the Money Mangement and Risk Appetite.
Disclamier : You are responsible for your profits and loss.
The idea shared here is purely for Educational purpose.
Follow back, for more ideas and their notifications on your email.
Support and Like incase the idea works for you.

AWLNSE:AWL
Note :
1. One should go long with a Stop Loss, below the Trendline or the Previous Swing Low.
2. Risk :Reward ratio should be minimum 1:2.
3. Plan your trade as per the Money Mangement and Risk Appetite.
Disclamier : You are responsible for your profits and loss.
The idea shared here is purely for Educational purpose.
Follow back, for more ideas and their notifications on your email.
Support and Like incase the idea works for you.

ETH copying pattern? Potential drop below $3,000?CRYPTOCAP:ETH seems to be repeating an old pattern—I’ve marked it with an arrow. I first noticed this about 10 days ago, and as time goes on, it’s looking more and more like the left shoulder of a classic head-and-shoulders bottom. Interestingly, the #MACD is perfectly mirroring the same movement too.
If #ETH is indeed forming the right shoulder, we could see a pullback of around 31%, dropping it below 3000 to roughly 2800. This move makes sense, as key players often target psychological levels like 3000, where a lot of stop-loss orders are placed, potentially triggering larger price shifts.
What’s even more intriguing is that a drop to 2800 would push ETH below the lower edge of the symmetrical triangle, which could seriously dent market confidence.
What do you think? Does this match your analysis, or are you seeing it play out differently?
---
Let me know if you'd like further tweaks!

Bitcoin - New All time high incomingAs you can see, Bitcoin is about to close a weekly candle over the previous VSA resistance. $TRUMP token has also pushed bullish narrative onto public therefore I think that this correction is over.
Next stop is around 127k and after that we should reconsider whether there will be continuation or that's it.

MAZDANSE:MAZDA
Note :
1. One should go long with a Stop Loss, below the Trendline or the Previous Swing Low.
2. Risk :Reward ratio should be minimum 1:2.
3. Plan your trade as per the Money Mangement and Risk Appetite.
Disclamier : You are responsible for your profits and loss.
The idea shared here is purely for Educational purpose.
Follow back, for more ideas and their notifications on your email.
Support and Like incase the idea works for you.

Ethereumhello friends
We came with Ethereum analysis.
You can see that after the heavy fall in the specified support area, the price made a good return.
Now, with the defeat of the resistance zone, we can enter into purchase transactions and move to the specified goals with capital management.
*Trade safely with us*

Bitcoin long awaited correctionIf you look at previous years, January has always been bearish. January 2025 is no different. After a long bull run since the latest halving Bitcoin required a correction to gain more liquidity and shake out margin longs. After that it should follow somewhat similar continuation pattern.
Long term prediction stays the same

14.01.25 Morning ForecastPairs on Watch -
FX:GBPAUD
FX:NZDCAD
OANDA:XAGUSD
A short overview of the instruments I am looking at for today, multi-timeframe analysis down to what I will be looking at for an entry. Enjoy!
