RIPPLE (XRP/USD) - Breakout Confirmed = BUYThe Ripple price has made a breakout and it got confirmed after a Daily candle close inside the green area:
1. Break above the light blue trendline since April 2018
2. Break above the triangle - which is also a short-term counter trendline.
3. Break above the previously worked resistance level - orange price zone.
4. Plus, we have a Golden Cross between 100 & 200 EMA's on the Daily timeframe! It should give a bit more momentum from buyers.
If today's candle stays like it is right now then we should have a pretty nice breakout setup - breakout and buy after the retest. At the moment, the retest has been pretty clean and currently, there is the needed rejection. So, technically it should be ready to climb into the higher levels.
To be more secure, then wait for today's candle close and if it stays as it is right now or on higher levels, then this trade is valid.
"Do the best you can to pay yourself at reasonable profit levels when the market makes the money available."
– Mark Douglas
Do your own research and if this matching with mine then you are ready to go!
Please, take a second and support my idea post by hitting the "LIKE" button, it is my only fee from You!
Best regards,
Vaido
Vaidoveek

BITCOIN - 11 Reasons To Take Profit or Sell BTC!Hi all,
If in my idea posts have been some areas, where we need a candlestick pattern confirmation to act before we can go into the high probability trade then right now there could be an immediate trade opportunity if the price reaches into the certain price levels!
To be said, here, under my account ideas, you can find short-term trading ideas. I don't post those "stupid" to the moon charts (if I want to collect more followers then probably I should make those but don't worry, I don't), I search high probability trading setups. Currently, I can't give you any buy signals (it was on my previous post after the breakout) because we don't have enough data to make high probability breakout trades, but what we have is a really strong resistance just above the current price which should give us a SELL opportunity. Multiple price action criteria are pointed exactly into this area and if you are on the long side then consider to take some mid-term profit and if you looking BTC Short opportunities then this area should be a pretty great area where you can make it.
Take profit/SELL area between $11,500 - $12,000, marked as a blue zone and the criteria:
1. 50% Fibonacci retracement level - pulled from ATH to the 2018 low
2. 62% Fibonacci retracement level - pulled from January 6. high ($17,100) to the 2018 low. If some Fibonacci retracement levels matching each other which have pulled from different tops then they make each other a bit stronger. Both should act as resistance levels!
3. Fibonacci Extension 161%
4. Fibonacci Extension 200%
5. AB=CD - The AB is starting from the 2018 bottom to the 26. May high, the CD should end exactly in the blue area, C point is 17. May low
6. AB=CD - The AB is starting from the 25. April low to the 30. May high, the CD should end exactly into the blue area, C point is 4. June low.
7. The entire blue price zone is previously worked resistance level, which can act easily again. The major downtrend started exactly after the last rejection from this level in March 2018.
8. Historically, the blue price zone has printed three Monthly highs, which will be an indication that this area can provide reversals.
9. In the Weekly timeframe, this level has shown incredible strength. Only two Weekly candles have managed to break it, one is upwards one is downwards, and this level has printed multiple rejections!
10. On the Daily, we have a pretty nice RSI Divergence, the price makes higher highs but RSI indicator makes lower highs.
11. The semi-round numbers should play also a role in this area. The $11,500 & $12,000 are located in the zone but yes, not so significant but still, on the list and on my criteria list.
Weekend Quotes:
- Anything can happen.
- You don’t need to know what is going to happen next in order to make money.
- There is a random distribution between wins and losses for any given set of variables that define an edge.
- An edge is nothing more than an indication of a higher probability of one thing happening over another.
- Every moment in the market is unique.
Mark Douglas
Do your own research and if this matching with mine then you are ready to go!
Please, take a second and support my idea post by hitting the "LIKE" button, it is my only fee from You!
Best regards,
Vaido

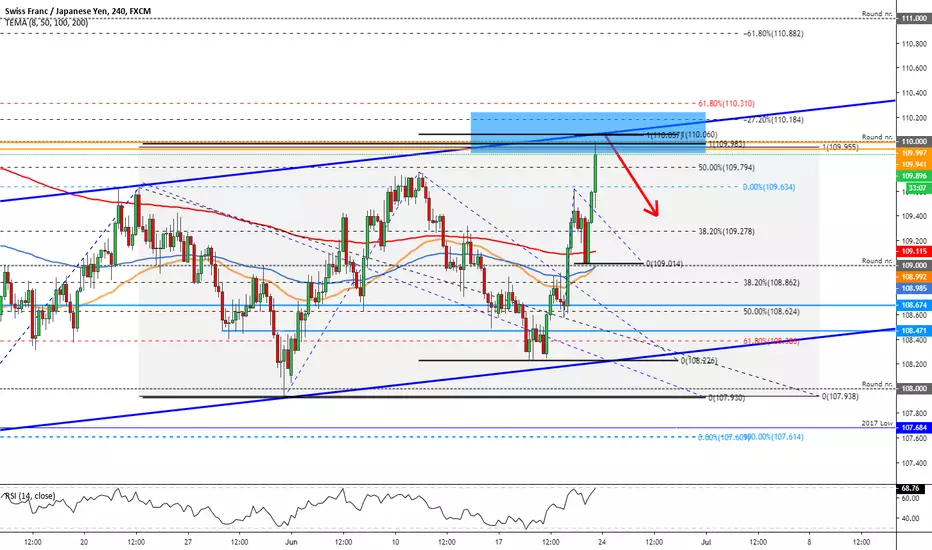
CHFJPY - SellDo your own research and if this matching with mine then you are ready to go!
Sorry for the mess and sorry for the short description, a quick post! ;)
Please, take a second and support my idea post by hitting the "LIKE" button, it is my only fee from You!
Best regards,
Vaido
OIL - A Little Throwback?!Oil tanker explosions, Iran admitted shooting down a US drone, crude inventories decrease - those are probably the major reasons why USOIL has made a pretty solid climb upwards.
It has climbed into a pretty interesting area where we can make a short-term SELL:
1. Previously worked support levels has become resistance.
2. Fibonacci Extensions
3. Fibonacci Retracements
4. 2006 Low (not so significant but still, one yearly low has been in this area)
5. AB=CD - D point is on the marked blue box.
6. The price has got a rejection from those levels and the rejection has ended with a bearish candlestick pattern called Evening Star, not a perfect because the previous two candles have been a bit tiny ones but the idea remains still the same.
On the top, we have also a Shooting Star and after that, the selloff has been pretty decent.
Do your own research and if this matching with mine then you are ready to go!
Please, take a second and support my idea post by hitting the "LIKE" button, it is my only fee from You!
Best regards,
Vaido

BITCOIN [$9,500-$9,650] Keep an Eye On It!Hi,
Hopefully, it starts to become a habit but again, followers (already a huge number) and other TradingView users, it still looks and it still feels amazing to be TOP 1 analyst and TOP 1 post author on TradingView, thank You and You and You.
I have been quite quiet because the Bitcoin price has stopped between the $9,000-$9,300. Yesterday, it made breakout from the triangle and it followed my arrow which was on my last update post.
In the last idea post, I mentioned that there is an area where I search some bearish candlestick patterns on the Daily timeframe to short BTC for short-term. To be said, this is still on my mind but currently, we have collected some data (after the last post) from the current levels and I want to share with you a little bit more precise overview, where and what can happen on certain levels. The area I am about to describe is not a specific signal, I'm not sure about. Maybe it is too early to post it but I get a lot of requests and hopefully, you can find something useful from here.
The short-term rejection area
It stays between $9,500 - $9,650 (There are pictures below of this post for phone users, it should be better). It is the first area where the short-term reversal criteria matching each other in one price zone and those are:
1. The 38% Fibonacci retracement level ($9,531) from ATH (fat dotted black line). This level is a momentum level. If the downtrend or uptrend is very sharp then those levels usually should work very well. If the market drops/increase fastly then the market is like a human, if it breaths in then it has to breathe out, at least for a while, and very often this 38% level is enough for breathe out ;) Currently, we have been in this downtrend more than 1.5 years so, let's see how this level reacts if the price makes the first touch.
2. Smaller channel upper trendline should act as short-term resistance. It is pulled from points where it has a maximum wick touches.
3. Bigger channel upper trendline (thin blue line) should still act as a resistance. This channel starts from $7,000 having pretty clean and understandable touches.
4. There is also a Fibonacci Extension level 127%, which should act as a resistance.
5. The round number $9,500. Historically it has made some reversals and it has played a pretty important role on the bounces. Currently, it matching with our other short-term reversal criteria, so, pretty reasonable to count it also into the resistance list.
6. Hmmm...I don't even know how I start to call it because the Elliott guys are quickly notifying it. To be said, I don't like Elliott Wave theory at all, yes, maybe it is helpful for further growth/drop if you are already in the trade but to make precise entries with Elliott is almost impossible because it is SO subjective. No offense, this is IMHO ;)
I don't want to dig deeper and let's call it AB=CD and the D point is exactly on the blue box to stop that current wave. Look at the picture below, the purple arrows should give you a better overview of what I mean.
7. The red lines. The area which stays between the red lines is important. Previously when the BTC price was around $9,500 was April-May in 2018 and this area between the red line is a "Strong Area". Strong area - only strong candles have managed to crack it. Historically, multiple rejections and only strong and powerful candles have managed to break above of it or have managed to break below of it. Currently, this area matching exactly with our 38% Fibo retracement level which should act as a resistance, perfect match!
Here is also important to point this out that we need a clear rejection from the shorter timeframes and from the marked blue box. In the picture below you can see, if at least 1H candle can break above the blue box then the trend can continue to the upside (into the trend direction) to another resistance areas which can stop the price but currently, wait for a rejection from the light blue box!
Bullish confirmation is pretty clear, the strong candle breakthrough, the exact candle is on the picture ;)
Setup:
Do your own research and if this matching with mine then you are ready to go!
Please, take a second and support my idea post by hitting the "LIKE" button, it is my only fee from You!
Best regards,
Vaido

RIPPLE (XRP/USD) - Confirmation Area For Further Growth!Ripple has a pretty clean and simple confirmation area for further growth, it stays between $0.465 - $0,481 and the upwards move gets confirmed after a Daily candle close inside the green area, a Daily candle close is needed!
After the needed confirmation:
-- Then we have a breakout above the historical trendline (light blue). The trendline is pulled from April 2018 wick to wick and the second touch has been on September 2018. It is interesting that we have still some historical down-trendline on XRP chart, BTC has left those behind for a while ago! So, a breakout above the last down-trendline can easily release some bullish momentum.
-- Then the price has managed to break above the light orange area. This area is the strong resistance zone where it has multiple rejections downwards. Breakout will be a confirmation that in the future, this level starts to work as a support and the price has reached above of it.
-- Then we have a breakout above the counter trendline. This black trendline from the current top is a slight down-trendline which is also a counter trendline for mid-term trend.
If the Daily candle gets a close inside the green area then we have a breakout from those pretty bullish criteria. If the breakout occurs as soon as possible then currently, we have a really nice breakout confirmation for further growth - EMA 100 & 200 Golden Cross on the Daily timeframe ! The Golden Cross is a great confirmation for further growth IF the breakout has occurred and confirmed!
Golden Cross:
As said, the breakout confirmation area is pretty simple and clean, why? Because the resistance around $0,45 is heavy as hell!
Can't give the SELL signal inside the orange area, around the trendlines crossing area but we might get it if the BTC reaches into the $9,500 - $10,000 and it shows some bearish signs inside of that range, definitely if this happens I make an update!
Do your own research and if this matching with mine then you are ready to go!
Please, take a second and support my idea post by hitting the "LIKE" button, it is my only fee from You!
Best regards,
Vaido

USDCHF - Sell Opportunity, Confirmation Needed!Keep an eye on this level:
1. Fibonacci Golden ratio 62% from smaller tip
2. Fibonacci retracement level 38% from the recent highs.
3. The trendline
4. The equal waves endpoint
5. Most powerful round number 1.00000
6. Previously worked support level becomes resistance
7. Different timeframe EMA's
Really nice setup BUT definitely wait for a bearish candlestick pattern around the blue box which is the mentioned confirmation!
Fundamentally - Interest Rate Decision is on Wednesday which is highly volatile news, if the price is not moved lower than the marked level then this setup is invalid, because the volume can ruin it easily.
The setup looks great! To be more secure, as said, wait for a bearish candlestick pattern, at least on the 4H timeframe!
"Putting on a winning trade or even a series of winning trades requires absolutely no skill. On
the other hand, creating consistent results and being able to keep what we’ve created does
require a skill. Making money consistently is a by-product of acquiring and mastering mental skills."
– Mark Douglas
Feel free to support my effort by hitting the "LIKE", it is my only fee from You!
Best regards,
Vaido

EURNZD - Huge Bearish Sign From Daily TFYesterday, Super Mario (Mario Draghi) made Euro weaker and a lot of EURxxx pairs dropped.
EURNZD, Daily chart, candlestick pattern Evening Star (the most powerful candlestick pattern):
If we look at those two last, green and red candles, then there is even 2in1. Evening Star and those two last ones form a bearish Engulfing.
Yesterday's candle close completed those candlestick patterns and it also confirms rejections from multiple price levels. The price bounced back and closed below:
1. Fibonacci retracement golden ratio 62%
2. Round number 1.73000
3. 2013 High
4. 2016 High
5. Another round number 1.72000
6. 2010 Low
All those levels got cracked yesterday and it got confirmed after the Evening Star has formed which is also a huge bearish sign.
Wait for a pullback, do your own research and if this matching with mine then you are ready to go!
Please, take a second and support my idea post by hitting the "LIKE" button, it is my only fee from You!
Best regards,
Vaido
Yesterday's EURNZD Short:

BITCOIN - An Important Sign From ATH!Hi,
First of all, followers and other TradingView users, I'd like to thank you for the support, it looks and it feels awesome to be TOP 1 analyst (author) and TOP 1 post owner on TradingView, so, thank you very much for that!
Now, let's take a look at the current Bitcoin chart.
After my call to buy BTC at $7930, the price has broken above my prementioned resistance levels and the mid-term bearish bias has postponed because the price has made a new higher high which is now $9,388!
To be said, I was looking at this chart for a while and currently, there are not any significant trading ideas but I'd like to point out one very strong resistance area where we might get it. This resistance area is pretty wide but definitely, it is strong and it should work as a profit-taking area if you are in a mid-term long position.
The Green Box | $9,500 - ~$10,000
The area where you should take out some long position stays into the green box. There are some minor reversal criteria and one significant criterion.
Let's start to count those criteria which stays into the green box and which should work as resistances:
1. If the price has taken some direction into a specific direction, currently upwards, then very often it moves in the parallel channels and as you see, currently the Bitcoin price is on the upwards channel. Channel trendlines are pretty wide but no problem, the channel upper trendline should act as a resistance area (light-blue "line")
2. There are two Fibonacci Extension 127% levels at $9,754 & $10,033. They should work as resistance levels and they are usually great places where to take out some profits.
3. The movements consist of waves and pretty often those waves are on equal size. Into the green box, I have pointed out two Equal waves C points. Blue starts from 25. April low and the C point is at $10,000. Orange starts from 17. May low. and the C point is at $9,913. They should work also as reversal criteria.
4. The psychological number $10,000 should act as a strong resistance level.
5. The semi-round number $9,500 is also in this area but this should play a more important role in the selling opportunity if we get some nice bearish candlestick patterns in this box (more about those below of this post).
6. There is previously worked resistance level, really strongly worked resistance level on 5. May 2018
Now, the most important criterion...
7. Fibonacci retracement 38% ($9,532), PULLED FROM ATH at $19,891 (all-time high) to the 2018 low at $3,128.
This is the first important Fibonacci retracement level after the ATH and 2018 low. It matching almost perfectly with the other short-term reversal criteria.
So, a pretty strong price zone and that's why this green box has to be your partial (at least) take profit area.
If the price stays there for a while and if it doesn't fly higher than this then we might pick up short-term sell trades because the area is very strong. We need only one confirmation and it is a Daily candlestick pattern on the green area (in some cases the 4H candlestick pattern would be also great confirmation).
Hopefully, this analysis was helpful, now you know where my eyes are pointed and let's wait for our opportunities around the mentioned level, be patient!
Feel free to support my effort by hitting the "LIKE", it is my only fee from You!
Best regards,
Vaido - Analysts for Swipex

EURNZD - A Possible Short-Term SELL OpportunityI have started to observe that marked blue box, inside of it I start to search confirmations.
First of all, the blue box consists of:
1. Fibonacci Golden ratio 62%
2. Parallel channel projection
3. Equal waves
4. Fibonacci Extensions 127% & 161%
5. Round number 1.73000
6.* 2013 and 2016 yearly highs
The confirmation (bearish candlestick pattern) has to come from the 4H chart or from the Daily chart.
A perfect scenario/confirmation would be a rejection from the blue box and a Daily candle close below those yearly highs.
Do your own research and if this matching with my marked area then you are ready to go ;)
Please, take a second and support my idea post by hitting the "LIKE" button, it is my only fee from You!
Best regards!

AUDJPY - Wait For a Breakout!Short-term trade!
Wait for a breakout from the bullish chart pattern called Falling Wedge.
At least 1H candle has to close above the upper trendline. The bounce came from pretty nice crossing area:
- Fibonacci golden ratio
- Old support level (red line)
- Trendline (blue)
- Pattern bottom trendline
The trade should be triggered after the breakout, at least 1H candle close above the Falling Wedge (above the orange line)!
Feel free to support my effort by hitting the "LIKE", it is my only fee from You!
Best regards!

CADCHF - Selling Area, Wait For a Confirmation!Wait for a confirmation from 1H or 4H or even Daily. And the confirmation is a bearish candlestick pattern: Bearish Engulfing, Evening Star, Shooting Star, Bearish Railway Tracks, Spinning Top
Some criteria matching each other in one area:
- Trendline
- Fibonacci levels
- Previously worked resistance level
- Different timeframe EMA's
-* The gap: 80-90% of the time market fill those gaps. Currently, there is a gap after Monday's open which will be a slight indication that the market want's to go down.
-* The trend is your friend: currently we have nice short-term lower highs and lower lows
Feel free to support my effort by hitting the "LIKE", it is my only fee from You!
Best regards,
Vaido - Analysts for Swipex

GBPJPY - Buy OpportunityBullish Engulfing on the previous support area and RSI Divergence should work as a momentum indicator for a short-term bounce!
Feel free to support my effort by hitting the "LIKE", it is my only fee from You!
Best regards!

USDCAD - Sell OpportunityKeep an eye on this area, a lot of reversal criteria in one area (blue box):
- Fibonacci levels
- Fibonacci Extension
- ABC Wave C point
- Trendline retest after the breakout
- Daily and 4H EMA 100
- Previously worked support levels are now resistances
- A bit sloppy channel upper trendline
Definitely, wait for a bearish candlestick formation because the USD looks pretty strong, at the moment!
Feel free to support my effort by hitting the "LIKE", it is my only fee from You!
Have a great weekend!

GOLD (XAUUSD) - Strong ResistanceA possible Sell opportunity:
- yearly levels (2017 high)
- trendline
- strong area
Wait for a rejection from smaller timeframes. If possible then wait for a confirmation from bearish candlestick patterns.
Feel free to support my effort by hitting the "LIKE", it is my only fee from You!
Best regards

BITCOIN - Key Price Levels!I have struggled with further scenarios, after the bounce from my mentioned level at $7,930, because there are two, almost equal, resistance levels which can play an important role in the next movements.
To be said, I'm still with mid-term bearish bias because of the Weekly bearish candlestick pattern Evening Star. The price can make another $150-$300 leg upwards but still, it doesn't hurt my bias. My bias starts to change after the price has climbed above the $8,700 and the Weekly candle gets a close around that level - the green "box". So, because of my mid-term bearish bias a search selling areas/opportunities.
At the moment, the price moves between $8,200 - $8,300 and this area is also our first resistance area - the lower gray "box".
There are:
- Fibonacci retracement levels 50% & 62% pulled from different tops
- Fibonacci extensions 127%
- The minor trendline (light blue) which is the upper trendline from the bearish chart pattern called Rising Wedge
- The area itself is a significant level. This price level has worked as resistance on mid of the May, beginning of the July it worked as a support and now it should act as a resistance level.
Now, the mentioned struggle - we have some bearish price action on the current levels (bearish candlestick patterns on the 4H and on the 1H), the level is pretty strong to short BTC from here, from the first gray area but Still, there is something which doesn't allow to do it, I don't know why it doesn't feel right to short it here but probably it is the buyers consistency from $7,500, steady grind upwards is usually pretty bullish for BTC price! So, that's why I'll wait for a further confirmation, if the price still starts to fall lower from the current level then another confirmation comes after the breakout from the bearish chart pattern Rising Wedge - a candle close below the lower light blue trendline and a candle close below the red price level ($8,110)will be a bearish confirmation and you should get at least 1H candle close below that level.
The second selling area stays around $8,500, this area was also the target 2. on my previous post. There are some price action criteria and they should act as resistance levels:
- Fibonacci golden ratio 62% and minor the Fibonacci level 78%
- Fibonacci Extensions 162%
- The round number $8,500 should act as a resistance.
- Depends on the price action but the minor trendline (Rising Wedge upper trendline) may act also as a resistance. It depends when it reaches into the higher gray area.
This level is just a little bit more favorable because of the Fibonacci level and visually it looks also better but if it starts to go right away then this area becomes also a bit riskier because then the price is cracked this minor light blue trendline and it can find a momentum to push it through the higher gray box. So, to be more secure then the bearish candlestick pattern is needed on the upper gray area and only valid patterns are bearish Engulfing, Evening Star, bearish Railway Tracks (if you don't know them, google helps you out).
SUMMARY: Pretty simple guidelines - the first area (lower gray zone) gives us a confirmed movement after the breakout from the chart pattern called Rising Wedge and the second area (higher gray zone) can give us a reversal trade opportunity after the bearish candlestick formations! Sell orders, because my bias is bearish because of the Weekly timeframe price action and this can "easily" change and it changes after the BTC price has climbed above the $8,700!
Feel free to support my effort by hitting the "LIKE", it is my only fee from You!
Best regards,
Vaido - Analysts for Swipex

BITCOIN - A Possible BUY Opportunity!Two day's ago we had a higher high candle close (the candle which got a close above $8,000), a few hours ago we got a higher high candle close on the 1H.
This 1H candle was pretty powerful and the buyers pushed it straight through the blue counter trendline (down-trendline). Yesterday, I said that those two blue trendlines make a Triangle chart pattern. Triangle chart pattern has breakout opportunities to either direction and currently, we have upwards breakout confirmed on the 1H and on the 4H timeframes.
That's why I think we might see a small push upwards. I said small push because of the higher timeframe bearish sign, remember my last idea post, the last Weekly candle close gave us a really powerful bearish candlestick pattern called Evening Star but currently, we have a pretty good short-term buy setup.
If the market makers don't start to ruin some current action then we might see something like this:
The trade criteria:
1. Some hidden higher high candle closes on different timeframes.
2. The blue counter trendline got cracked with a powerful candle. It shows that there is a lot of buyers and they together managed to push it above.
3. The blue counter trendline worked previously as a resistance, the strong candle breakthrough gives us an indication that this trendline should start to act as a support.
4. As you see on the 15 min. chart then there is previously worked resistance level which now becomes support.
5. 1H EMA200 should act as a support level.
6. Altcoins area on the recovery mode.
7. The tiny short-term trend is upwards
8. Golden crosses between different EMA's
The trade becomes invalid if the price starts to fall below the lower blue trendline.
The first target area should stay around $8,200
The second target should stay around $8,500
Do your own research and if it matches with mine idea post then you should be ready to go!
Feel free to support my effort by hitting the "LIKE", it is my only fee from You!
Best regards,
Vaido - Analysts for Swipex

BITCOIN - Big Bearish Signs (Mid-, Short-term)!My last movements predictions have been quite perfect. The bounce areas and the breakout areas were nicely exploited and we had some nice movements.
At the moment there are some big bearish signs from the higher timeframe, reversal area is not so perfectly identified but don't worry, we should catch some breakout trades. Let's start a bit deeper analysis:
The last Weekly candle close gave us a really strong bearish sign, one of the most powerful bearish candlestick pattern Evening Star (on the Weekly chart, which is a higher timeframe and candlestick patterns working much better in the higher timeframes)
Evening Star will be an indication that higher success rate would be on SELL trades. To bring here some statistics then, do you remember that title "BITCOIN - 66% Probability For Further Growth!". This was said because of the Weekly candles which got a close above the 8k, we had a small sample size (three), two times after the close above the $8,000 it was made a climb into the higher levels and one was a fakeout and to remind you that history then the probability % guided the BTC price into the higher levels((8k to 9k). Currently, we have another 66% probability but for the further price decrease!
Again, we have three samples:
1. Weekly candle close below $8,000 on March 2018 ($6,816) - this was the mentioned fakeout, two weeks and the price was again above the $8,000.
2. Weekly candle close below $8,000 on May 2018 ($7,346- Small stop on the next week price action and after that, the fall continues to the well-known level $6,000
3. Weekly candle close below $8,000 on July 2018 ($7,030) - again, the fall continues to the well-known support area $6,000.
So, three samples, two have guided the price into the lower levels and we have one fakeout. After some heavy math, we have a 66% probability (again) but as said, now we have a 66% probability for further fall but there are more signs to confirm that.
Probably you noticed it already but those two falls have occurred after the Weekly candle close $7,xxx, fakeout was lowest at $6,816. The last Weekly candle close was also $7,xxx ($7,634) AND it formed a bearish candlestick pattern Evening Star (which should be the most powerful bearish candlestick pattern). So, the math supporting further fall and the price action supporting that further fall.
Let's dig into the smaller timeframes for searching confirmations.
As you see on the image the price is still on the Descending Channel.
I add a picture for phone users, it should be better to watch:
The Bitcoin price has confirmed Lower Low (LL) and a new Lower High (LH) which is downtrend indications. If the price starts to make a breakout upwards from the Descending Channel (the area between orange trendlines) then as said, there is pretty hard to identify the reversal area, reversal criteria don't match perfectly. Example: if there is a good resistance area with some great criteria inside of it then there is also a breakout from the bullish chart pattern and etc. It is not easy and if the reversal area is not easy to identify then usually they don't work as strong as they should be especially when we have really strong bearish sings from the higher timeframes, BUT I would like to give you a price level which is my observation, the area stays around $8,200-$8,450. If this is not a reversal area then it should be partial profit taking area for longs holders.
The trend is your friend and currently, we have indications through the LL & LH that the current short-term trend is downwards and the higher timeframe analysis confirms that. So, at the moment the only clear trading idea would be a breakout trade into the short-term downwards trend direction. There is a red line and if the 4H candle gets a close below of it then we might see a $350 to $800 price fall.
After the 4H candle close below the red line the price has cracked some important support levels:
1. EMA200 - it has held us three times around the current area
2. The semi-round number $7,500 - same story as EMA200
3. New Lower Low confirmation area
Some other indications:
4. From the Weekly chart a bearish candlestick pattern called Evening Star, really strong bearish candlestick pattern
5. Math is supporting current fall, 66% probability for further fall
6. We are on the Descending Channel.
7. The trend is your friend
Wait for a 4H candle close below the red line, below $7,400 and the target should stay $6,700-$7,050.
If the price starts to approach that higher gray box which can be the mentioned reversal area then I will make constant updates because we need some bearish price action inside the box. This is a risky area because of the mixed signs!
Feel free to support my effort by hitting the "LIKE", it is my only fee from You!
Best regards,
Vaido

BITCOIN - Double Bottom, Wait For a Breakout!!Possibly, the price has printed a bullish chart pattern called Double Bottom on the $7,500.
Possibly? Because the pattern gets triggered after the neckline break. Currently, the neckline is around $7,860 and if the 1H candle gets a close above the neckline then the chart pattern is valid. At the moment when I write this, the price is above the neckline BUT we need a candle CLOSE!
Yesterday, the price made a breakout downwards from the Ascending Triangle and currently it has started to print something similar which is just a little bit bigger but whatever it is the resistance stays still into the same area - $7,860. To make those patterns valid then we need at least a 1H candle close above the mentioned resistance level and as always, more secure would be a 4H candle close confirmation.
Because we have lower lows and lower highs then the next selling area should stay between $8,115-$8,350. Wait for bearish price action from the gray box. Price action = smaller timeframes chart pattern breakouts, bearish candlestick patterns on the 1H+ timeframes and here is definitely the saying - bigger is better.
In the gray selling area are some other criteria which will end this wave:
1. Fibonacci levels 50% & 62%
2. The trendline should act as a resistance level
3. Previously worked support and resistance area
4. Strong area (areas without candle close inside of it)
5. Double Bottom chart pattern target.
If the price reaches into the mentioned selling area then I make updates and notify about the bearish price actions.
The double bottom has formed around $7,500 because there are some pretty important price action criteria and also there is currently the 4H chart EMA200:
If the price can't break above the resistance at $7,860 then there could be a pretty good selling opportunity after the 4H candle close below the $7,500, below the 200EMA.
Feel free to support my effort by hitting the "LIKE", it is my only fee from You!
Best regards!

RIPPLE (XRP) - Several Trading Opportunities!Ripple has made an important breakout. The trendline since 10. May has broken on 4. June. It could be a sign that the current bull run, which has happened after the XRP Coinbase listing, starting to become over.
The price action and some certain levels offer us several trading opportunities. There are reversal trades, there are breakout trade possibilities but enough for this small talk let's jump into the action!
REVERSAL TRADES
1. A new Lower High around $0.44
This movement matching almost exactly with the Bitcoin movements. The black area around $0.44 is a pretty solid resistance which consists of several criteria:
- Descending Channel upper trendline should work as a resistance
- The black trendline which worked previously as a support level becomes now resistance, a classical retest situation after the breakout
- The Fibonacci golden ratio - 62% retracement level, it is perfectly on the crossing area inside the black box.
- Let's count this $0,44000... as a round number, ok semi-round number because $0.400.., $0,500... works usually better than those.
Pretty nice area where it might do a new Lower High (LH). Sure, it depends on the BTC, if BTC finds resistance from $8,200 then you can be almost sure that XRP finds it at $0.44
2. A new Lower High around $0.36
The correction may guide us into another reversal area which should stay around $0.36. The criteria are:
- Previously worked support level
- The Fibonacci golden ratio - 62% retracement level
- The Fibonacci Extension 127%
- Descending Channel bottom trendline should act as a support level
- Daily EMA 100 & 200, they are BOTH inside the gray box and they should work as supporters.
So, another pretty good area where you should look at least for a short-term bounce!
BREAKOUT TRADE
Currently, there is only one, if the time goes by then I will make another idea post or an update but currently, there is one breakout trade possibility. It stays pretty high but it is what it is.
I can't put this green breakout confirmation area lower because of the trendline which is pulled from wicks and the starting point is from 18. April 2018.
If the price makes a breakout from the Descending Channel, which could be easily a Bull Flag, then the take profit area should stay just before the dotted trendline and the area between those is so tiny, then there is no point to do that.
I don't think this gonna happen in near future but just in case, the full bullish breakout confirmation should come after the 4H candle close above the black dotted trendline!
SUMMARY : You should get action from the mentioned levels, especially from those reversal trades. Set alerts into the named areas, do your own analysis, if they match then you are ready to go! ;)
Feel free to support my effort by hitting the "LIKE", it is my only fee from You!
Best regards,
Vaido

BITCOIN - One of The Possible Scenarios!The Bitcoin price has pushed the new Lower Low (LL) a bit lower into my mentioned (last idea post) support area at $7,500. The bounce has occurred, as slightly expected, and here we can start to see some interesting similarities compared with the movements on the top.
Usually, I don't like to search those similarities but currently, they start to match perfectly with other technical analysis criteria.
The drop which was happened from $9,000 to my first mentioned support area at $7,500 has started to match with the price action which has occurred after the trendline breakout!
On the left chart, you can see that blue price shadows, copy/paste to the right chart and you see that after the breakout from the trendline those moves have been extremely similar!
Here comes the conclusion which is REALLY subjective. I still wait for that major support area which stays between $6,500-$7,000 but I like to show a possible roadmap how it may go into this area.
Currently, the $7,500 has held the price nicely, altcoins are on the pullback which also will be a slight indication that the market goes higher. Now the similarity, the similarity projection shows us that the BTC price can climb into a strong area, around $8,200. There are also Fibonacci Golden ratio 62% and descending channel upper trendline. So, pretty nice crossing area and strong resistance, it can be our new Lower High (LH) and the blue "similar movement" has pointed also exactly into this area!
As said in my previous post, my bias is bearish because of the Lower Low which has been a rare case since February 2019 and that's why I think that this new Lower High seams to be in the right place.
Now the most important criterion, the blue price projection is pointed exactly into my major support area at $6,500-$7,000. To remind you of those other criteria:
The major support area $6,500-$7,000
Yes, a pretty wide range but it is what it is, here are the criteria:
1. Fibonacci retracement 50% ~$7,000
2. Fibonacci retracement 62% ~$6,540, both are pulled from 25. April low to the 30. May high.
3. Fibonacci retracement 38% ~$6,820, pulled from 15. Dec. 2018 low (from the bottom) to the 30. May high.
4. The round number $7,000 and even $6,500
5. Daily EMA 50 should act as a support level.
6. The known strong price level at $6,700
7. Previously worked support and the area where may have a lot of buyers.
8. Chart pattern Rising Wedge breakout target is pointed exactly into the lower blue box.
9. Historically, some Monthly lows and highs have been in this area.
Now, there is also:
10. Similarity projection (similar price action) between the drop from $9,000 and drop after the breakout from the trendline (breakout from the bearish chart pattern Rising Wedge)
11. Descending channel bottom trendline, which should act as a support
12. ABC Equal Waves C point.
SUMMARY: It may drop sooner than expected because the $8,000 can be a psychological level but I just had to share it with You, actually it looks awesome :D
Feel free to support my effort by hitting the "LIKE", it is my only fee from You!
Best regards!
Previous analysis:

BITCOIN - New LOWER LOW (LL)The price has made a first Lower Low (LL) since February 2019!
Yes, this constant growing without any significant lower lows has been going on for so long.
I hope that you saw my yesterday's post where I warned you that this may occur. The first sign was a Lower High (LH) and the final warning came after the 1H candle got a close below the trendline. This trendline was a part of the chart pattern called Rising Wedge. Rising Wedge is a bearish chart pattern and it has started to work after the breakout and it supports my correction bias.
The Daily candle still managed to close above the $8,000. It can be a little hope for the bullish bias owners because at the moment the price is in the bounce area. Around $7,800 matching some reversal criteria but not so significant. In Forex, those criteria are probably solid to enter into the trade but in Crypto, we have to consider one of the most important factor - the panic.
A high count of traders waited for a correction and here are the first bigger steps into it.
A said before, the Lower Low (LL) has confirmed and it is confirmed on the 4H chart - candle close below the $8,000 and it is lower than the previous HL (logical). The 4H chart confirmation, a breakout from the bearish chart pattern are enough to say that the short-, mid-term bias is bearish.
I said that this could be a bounce area but still, I can't say it surely because below the current price is much more reliable rejection areas for short-term trades perspective.
The minor support area around $7,500
- Previous support area, which has played a role on the trendline (Rising Wedge bottom line) touches.
- The psychological number $7,500 should act as a support level. Not so significant as the full round numbers but still worth to mention it.
- 4H EMA 200 acts as a support level.
- Fibonacci retracement 38%, pulled from 25. April low to the 30. May high.
- Fibonacci retracement 62%, pulled from 17. May low to the 30. May high.
As mentioned, a minor bounce area. Some of the criteria matching in this first/higher blue area but the waves from the top don't visually look very good and logical that this can hold the price. A bullish candlestick pattern would be perfect, other ways I don't rely on this level.
The major support area $6,500-$7,000
Yes, a pretty wide range but it is what it is, here are the criteria:
1. Fibonacci retracement 50% ~$7,000
2. Fibonacci retracement 62% ~$6,540, both are pulled from 25. April low to the 30. May high.
3. Fibonacci retracement 38% ~$6,820, pulled from 15. Dec. 2018 low (from the bottom) to the 30. May high.
4. The round number $7,000 and even $6,500
5. Daily EMA 50 should act as a support level.
6. The known strong price level at $6,700
7. Previously worked support and the area where may have a lot of buyers.
8. Chart pattern Rising Wedge breakout target is pointed exactly into the lower blue box.
9. Historically, some Monthly lows and highs have been in this area.
-* Some sloppy curve trendlines are also in this area which gives a little support but nothing significant.
SUMMARY : At the moment, before today's candle close, before data collecting from the current levels, etc., I can say that the major support area stays around $6,500-$7,000. Before that, I will be really cautious and I recommend it to you also. We might get a bounce here at $7,800 but for me, the short-, mid-term bias has changed into a bearish because of the breakout from the bearish chart pattern Rising Wedge and because of the Lower Low which has been unique since February. If there is something strange going on than I will warn you!
Feel free to support my effort by hitting the "LIKE", it is my only fee from You!
Best regards!
Previous analysis:

GOLD - Bearish Price Action on The Strong ResistanceSeveral rejections from the orange lines which have printed some bearish candlestick pattern:
- Evening Star
- Gravestone Doji (Shooting Star)
- Railway Tracks
All those have formed in the 4H chart and all those have formed around a pretty strong price level: multiple Monthly lows and Monthly highs have been in the orange area.
A great bearish price action but still, be a bit cautious because the price increase has been very sharp which can make this area vulnerable!
Feel free to support my effort by hitting the "LIKE", it is my only fee from You and it means a lot to me!
Best regards!
