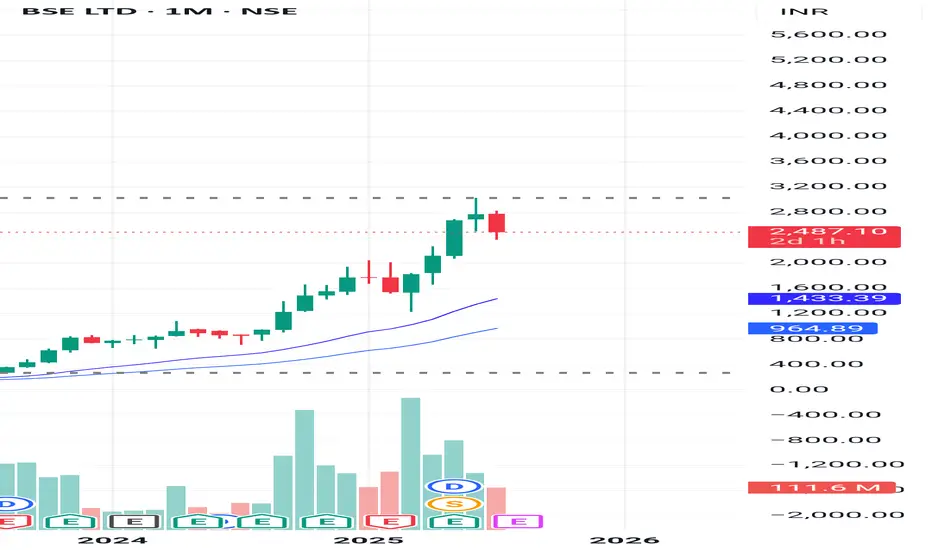
DCF VALUATION ANALYSIS OF BSEConclusion: OVERVALUED
:-OVERVIEW
BSE Limited has shown strong financial growth in recent years. Its revenue jumped from ₹924.84 crore in FY23 to ₹1,592.50 crore in FY24 (a 72% increase), and further surged to ₹3,212 crore in FY25, doubling year-on-year. EBITDA grew impressively to ₹1,779 crore in FY25 with a 60% increase, and EBIT reached ₹1,670 crore, up 56%. Net profit also rose significantly to ₹1,112 crore, with earnings per share increasing to ₹81. Dividend per share improved to ₹23, reflecting healthy returns
DCF:
-The valuation was performed using a Discounted Cash Flow (DCF) approach based purely on verified financial data and market risk parameters without relying on user-specific growth assumptions.
-The cost of equity was calculated using an adjusted risk-free rate plus equity risk premium multiplied by beta, resulting in a discount rate of approximately 13.58%. The terminal growth rate was conservatively taken as 4%. Using these reliable inputs and actual EBIT cash flows, the intrinsic enterprise value was estimated at around ₹36,839 crore, translating to an intrinsic value per share of approximately ₹1,364.
-Currently, BSE’s market price is around ₹2,480 per share, which is substantially higher than the intrinsic value derived from fundamentals, indicating the stock is trading at a significant premium. This valuation is grounded in audited company financials and globally accepted valuation methodologies, providing a trustworthy reference point for investors.
Value
INTC: Intel turnaround will take timeAs we have Intel earnings report released on Thursday, it miss on on EPS, but beat on revenue.
as Intel lag the industry, we still waiting some confirmations of positive turnaround, once we get it, we may get it long from this competitive level since P/B below $1.
Disclaimer: This content is NOT a financial advise, it is for educational purpose only.

Dollar General | DG | Long at $90.00Dollar General NYSE:DG took a massive hit this morning after revising their future earnings guidance. The economy is showing many signs of a recession, and this is a clear warning. From a technical analysis perspective, it has retouched my "crash" simple moving average and may dip further into the $80's in the near-term. But, like many overall strong companies that suddenly plummet, I view this as a future opportunity given the strength of NYSE:DG as a business (holistically). Dollar General is the only grocery and home goods store around in many rural locations. So, while there is doom and gloom in the near-term, Dollar General is in a personal buy zone at $90.00. I view this as a starter position, though, with the potential for future declines/opportunities for additional share accumulation in the near-term.
Target #1 = $100.00
Target #2 = $122.00
Target #3 = $200.00+ (very-long term outlook...)

GE Healthcare Technology | GEHC | Long at $62.25GE Healthcare Technology $NASDAQ:GEHC. An aging and unhealthy population will only create an increased need for healthcare imaging services. Add AI to the diagnostic mix, and imaging will be imperative for routine health maintenance and screening. With a P/E of 15x, debt-to equity of 1x, earnings forecast growth of 8.36% per year, and bullish analyst ratings, this could be a good value play for the patient.
Thus, at $62.25, NASDAQ:GEHC is in a personal buy zone. Further drops are possible if trade wars make imaging materials/technology difficult to obtain, but that general statement applies to the whole market at this time...
Targets:
$70.00
$78.00

Sharplink Bets Big on ETH as It Breaks $3,900Ethereum has surged past the $3,900 mark, propelled in part by news that Sharplink has acquired 77,200 ETH — a transaction worth over $300 million at current market value. For BBDelta, this move is not just market noise — it’s a concrete example of how institutional-grade Ethereum strategies can drive both asset growth and consistent income.
Sharplink, originally focused on gaming and Web3 infrastructure, has recently pivoted toward an asset-heavy Ethereum strategy. This latest acquisition positions the firm among the top ETH holders globally — and, more importantly, signals a clear roadmap to profit generation within the Ethereum ecosystem.
BBDelta analysts believe Sharplink isn’t buying ETH for speculative purposes. Rather, the company is likely deploying a multifaceted revenue model using its holdings. That includes high-yield staking via Ethereum’s proof-of-stake protocol, engagement with DeFi lending platforms, and participation in liquidity pools. These strategies, when executed correctly, can yield between 4% and 8% annually — paid directly in ETH or stablecoins.
In addition to yield generation, Sharplink could be utilizing ETH to collateralize derivatives positions, fund tokenized infrastructure, or support its presence in NFT ecosystems. Ethereum, as a platform, offers an incredibly diverse set of use cases — making it more than just a crypto asset, but a cornerstone of digital finance.
The breakout past $3,900 further strengthens this strategy. BBDelta’s technical analysis shows increased open interest in ETH futures and options, indicating rising institutional demand and the likelihood of continued volatility — a prime environment for experienced players to profit from both price movement and structure-based yields.
Sharplink’s timing also reflects sound macroeconomic thinking. As fiat currencies continue to face inflationary pressure and traditional interest rates plateau, ETH-based strategies offer both protection and performance. BBDelta believes this dual value proposition — yield + appreciation — is driving renewed interest in Ethereum as a strategic reserve asset.
At BBDelta, we empower clients to capitalize on these same dynamics. Whether it’s through ETH staking, DeFi revenue models, or structured derivatives, we offer the tools and advisory frameworks that allow investors to turn ETH holdings into active profit centers — with proper risk management in place.
Ethereum’s $3,900 milestone is not a peak — it’s a gateway to next-level opportunity. For those with the infrastructure, insights, and risk controls in place, the digital economy is not just a bet — it’s a business.

“Biggest Trade Deal Ever” — 5 Things to Know in Bitcoin This WeeAs Bitcoin enters the final trading week of July 2025, global markets are responding to what many are calling the “biggest trade deal ever”—a multilateral digital finance agreement between the United States, the European Union, and five Asia-Pacific countries. While the implications are far-reaching for global payments, the spotlight remains squarely on Bitcoin, which has now firmly reclaimed the $120,000 level.
Here are five key developments shaping Bitcoin’s trajectory this week:
1. Digital Trade Pact Signals Institutional Legitimacy
The newly signed agreement includes provisions for cross-border tokenized settlement, streamlined regulations for digital asset custodians, and recognition of Bitcoin as a “monetizable asset class” in interbank systems. While CBDCs and stablecoins will be used in formal settlements, the framework opens the door for Bitcoin to function as reserve collateral.
“This is the first time sovereign regulators have embedded Bitcoin into a multilateral economic framework,” said Janice Harlow, senior strategist at Beacon Global.
2. ETF Inflows Return After Brief Slowdown
After a two-week lull, Bitcoin spot ETFs have seen renewed demand, with $850 million in net inflows over the past five trading sessions. The iShares Bitcoin Trust (IBIT) and Fidelity’s FBTC led inflows, signaling re-accumulation by institutional buyers.
Derivatives data from CME suggests traders are positioning for upside, with call options volume outpacing puts at a 2.3:1 ratio.
3. Hash Rate Hits All-Time High
Bitcoin’s hash rate has climbed to a new record high, exceeding 640 EH/s, indicating miner confidence and long-term investment in infrastructure. This surge comes despite the recent halving, which slashed block rewards and pressured weaker miners.
The increasing energy commitment suggests miners are betting on future price appreciation and institutional demand stability.
4. Whale Activity Accelerates
On-chain analytics from Glassnode show a sharp uptick in accumulation by wallets holding over 10,000 BTC. Approximately $2.1 billion in BTC has been withdrawn from exchanges in the past week, pointing to strong conviction among whales and high-net-worth investors.
“This looks less like speculation and more like positioning ahead of structural shifts,” noted Rishi Kulkarni, managing partner at TitanBay Capital.
5. Technical Indicators Flash Bullish
Bitcoin has reclaimed its 50-day and 200-day moving averages, and RSI (Relative Strength Index) remains in neutral territory at 56—suggesting room for further upside without overheating.
With the $128,000 resistance level in sight, many analysts believe a breakout to $140,000 is plausible in August, barring macroeconomic shocks.
Final Thoughts
With regulatory breakthroughs, strong on-chain data, institutional accumulation, and miner alignment, this week’s developments may mark a turning point in Bitcoin’s evolution from speculative asset to globally integrated infrastructure.
Whether the “biggest trade deal ever” delivers on its promise remains to be seen—but for Bitcoin, the direction appears clear: up and institutional.

Titanwhale: XRP as a Bridge Currency Ushers in a New EraAs global financial markets rapidly digitize, the need for instant, low-cost, and scalable cross-border payments is becoming more urgent. One of the key contenders redefining the cross-border payments landscape is XRP, the digital asset developed by Ripple Labs. It is increasingly recognized as a bridge currency capable of transforming international settlements.
According to analysts at Titanwhale, XRP offers a fundamentally different liquidity model—allowing institutions to bypass legacy correspondent banking networks and eliminate the inefficiencies of currency conversion and settlement delays.
XRP as Financial Infrastructure
Instead of converting fiat currencies directly—which requires liquidity and multiple intermediaries—banks and payment providers can leverage XRP as a neutral bridge asset. This model, known as On-Demand Liquidity (ODL), is already live in several key corridors, including the U.S.–Mexico, Japan–Philippines, and Europe–Southeast Asia.
Internal research from Titanwhale shows ODL volumes grew 57% year-over-year, with over $2.8 billion in XRP processed through RippleNet in Q2 alone.
“XRP is solving a real-world liquidity problem that traditional banking has struggled with for decades,” said Mia Chen, Head of Payments Analysis at Titanwhale. “And it’s doing so in real time—without intermediaries.”
Regulatory Clarity Boosts Adoption
The XRP ecosystem also benefited from a major legal milestone in 2023, when a U.S. federal court ruled that XRP is not a security when traded on public exchanges. This ruling lifted a significant cloud of regulatory uncertainty and paved the way for wider institutional participation.
Since the ruling, Ripple has announced CBDC partnerships with central banks, positioning the XRP Ledger as a politically neutral and interoperable infrastructure for next-generation digital currencies.
Titanwhale’s Strategic View
At Titanwhale, XRP is not viewed as a speculative asset, but as a cornerstone of the emerging global payment architecture. Its decentralized structure, instant settlement capability, and scalability make it uniquely suited to serve as a universal bridge asset in a fragmented currency landscape.
With growing institutional engagement and technical maturity, Titanwhale considers XRP a strategic allocation within diversified crypto portfolios over a 3–5 year horizon.

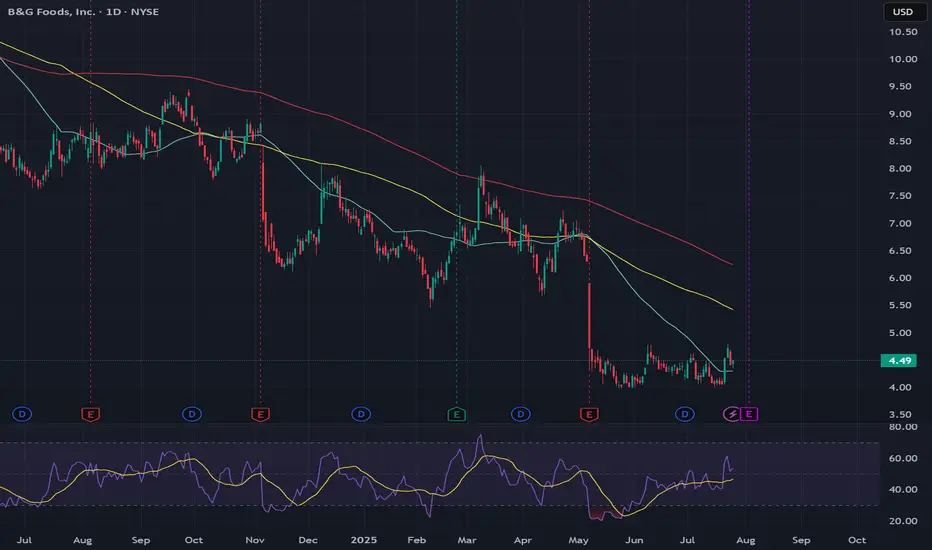
Tarriff help BGS has built a base at $4. U.S. tariffs = pricier Mexican imports. U.S. producers may gain
less competition, ability to raise prices, potential for better margins and more demand from buyers shifting away from imports. Call flow has seen some interest recently with a 20.47 short float I added JAN 5C at .40. Overall, insiders bought 219,570 shares for $1.7 million and sold 8,000 shares for $67,000 in the last 12 months, indicating net buying activity. These transactions reflect confidence from insiders, particularly Sherrill, whose purchases were significant and pre-arranged under Rule 10b5-1 plans
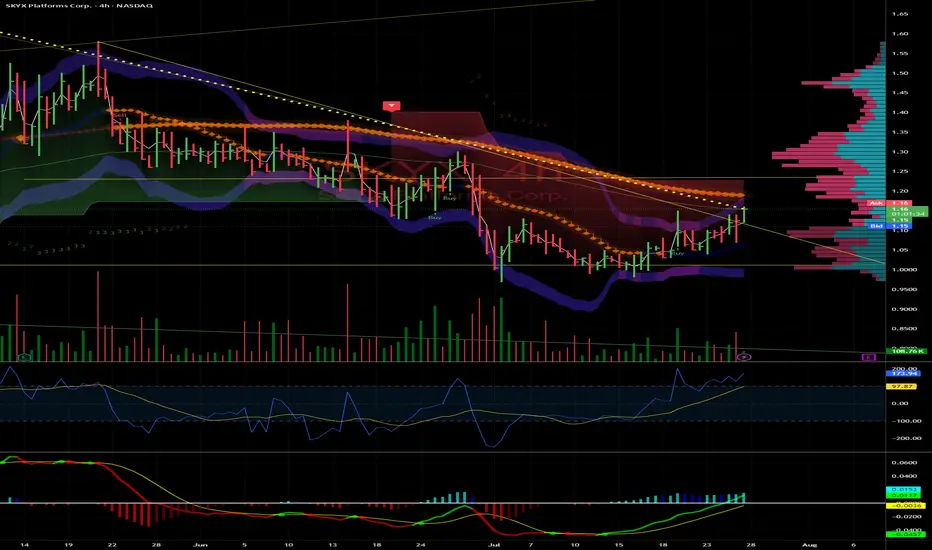
SKYX: Breakout to $1.58 and Potential Triple on Small-Cap Surge
SKYX Platforms Corp. (NASDAQ: SKYX) is primed for a run to $1.58 and could triple to $3.30 by year-end, driven by small-cap strength, e-commerce demand, and strong fundamentals. Here’s why SKYX is a must-watch.
Technicals: Clear Shot to $1.58
Trading at $1.10 , SKYX is coiling for a breakout. Resistance at $1.25 (psychological) and $1.40 (prior high) should fall easily with rising volume and a bullish MACD crossover. $1.58 is achievable by August, with $3.30 (200%+ gain) in sight if momentum holds.
Fundamentals: Smart Home Leader
With 97 patents and 60+ e-commerce websites, SKYX’s plug-and-play smart home platform is gaining traction. Their $3B Miami smart city deal (500,000+ units) and Profab Electronics partnership signal scalability . E-commerce sales, projected to hit $8T globally by 2027 , fuel SKYX’s growth.
Market Tailwind
The Russell 2000, which SKYX joined in June 2025, is breaking out, up 10% YTD . TNA’s 30% spikes amplify this . With a $138.61M market cap and 38 institutions adding shares (e.g., Susquehanna, 478,024 shares) , SKYX is set to ride this wave.
Risks
SKYX isn’t cash flow positive until H2 2025, and Q1 revenue missed ($20.1M vs. $21.15M). Small-cap volatility is a factor, but 12.4% YOY growth and the Russell breakout mitigate risks.The Play
SKYX hits $1.58 soon, clearing $1.25 and $1.40, then triples to $3.30+ by December on e-commerce, smart city deals, and small-cap momentum. I’m buying—thoughts, board?
Summary: Targets: $1.58 near-term, $3.30+ year-end.
Resistances: $1.25, $1.40.
Catalysts: Russell 2000/TNA breakout, e-commerce, smart city deal.
Risks: Cash flow, revenue misses, volatility.
Disclaimer: Not financial advice. Do your own DD. Stocks are volatile.
~Sherwood Coast's Group
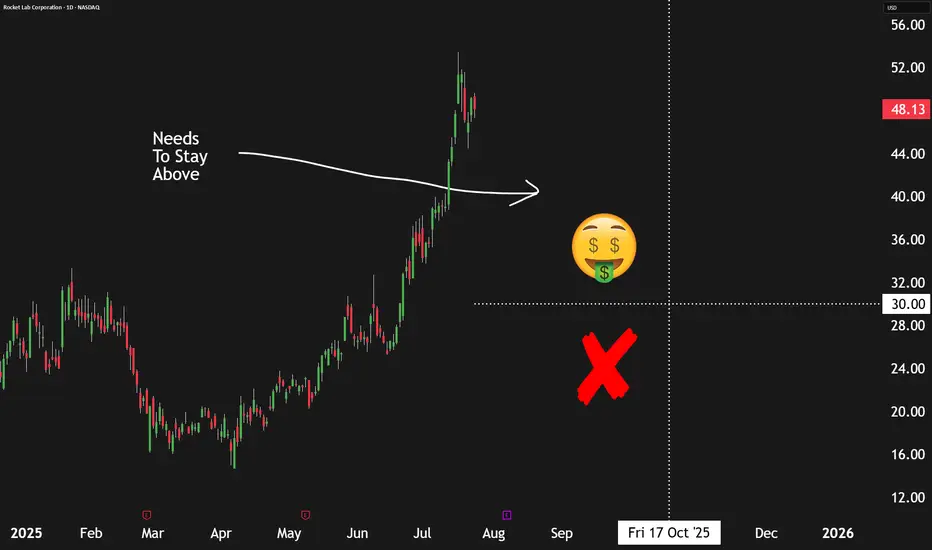
How We're Earning A 13%+ Yield Selling Puts On Rocket LabThe commercial space sector is booming, and Rocket Lab NASDAQ:RKLB stands out as one of the most promising players—not just another speculative startup or space tourism hype. But while the company is making strong operational strides, its stock valuation appears stretched, prompting a more strategic approach to investing.
📈 Strong Execution, Growing Opportunity
Rocket Lab continues to hit meaningful milestones. In Q1, the company:
Secured a U.S. Space Force contract for its upcoming Neutron heavy-lift rocket.
Won hypersonic-related contracts with the U.S. Air Force and the U.K. Ministry of Defense.
Successfully completed five Electron rocket launches and booked eight more.
Made a strategic acquisition for developing "Flatellites," enhancing vertical integration.
Revenue rose 32% year-over-year, with gross margins in the mid-30% range. Importantly, Rocket Lab has a $1 billion+ revenue backlog, with over half expected to convert in the next year, and a healthy mix of government and commercial clients across both its Launch and Space Systems divisions.
💰 Valuation: Big Potential, Bigger Price Tag
Rocket Lab's business is solid, but its valuation raises red flags. With a price-to-sales ratio near 55x (compared to SpaceX's ~14x), investors are paying a steep premium for future success. The company is still unprofitable, and the high valuation leaves little room for error. Simply put, the market may be rewarding Rocket Lab too early.
📊 The Smarter Move: Sell Put Options
Instead of buying shares at inflated levels, the better approach is to sell put options—a strategy that earns upfront cash and offers the opportunity to buy shares at a discount if the stock drops.
Recommended trade:
Sell October 17th $30 strike put options
Premium: ~$96 per contract
Required buying power: ~$2,904
Implied return: ~3.3% over 90 days, or ~13.4% annualized
This provides income now, while still giving investors potential exposure to Rocket Lab at a 40% discount to current prices.
⚠️ Risks to Consider
This isn’t risk-free. If Rocket Lab’s execution falters—especially with Neutron—shares could drop sharply. Selling puts means you may still be forced to buy at $30, even if the stock falls much lower. This strategy works best for investors comfortable owning RKLB long term at a lower entry price.
✅ Bottom Line
Rocket Lab is a strong business, but the stock looks overheated. Selling put options offers a more balanced way to participate in its growth story—earning income now while positioning to buy the stock later at a better value.
Rating: Buy (via options strategy)
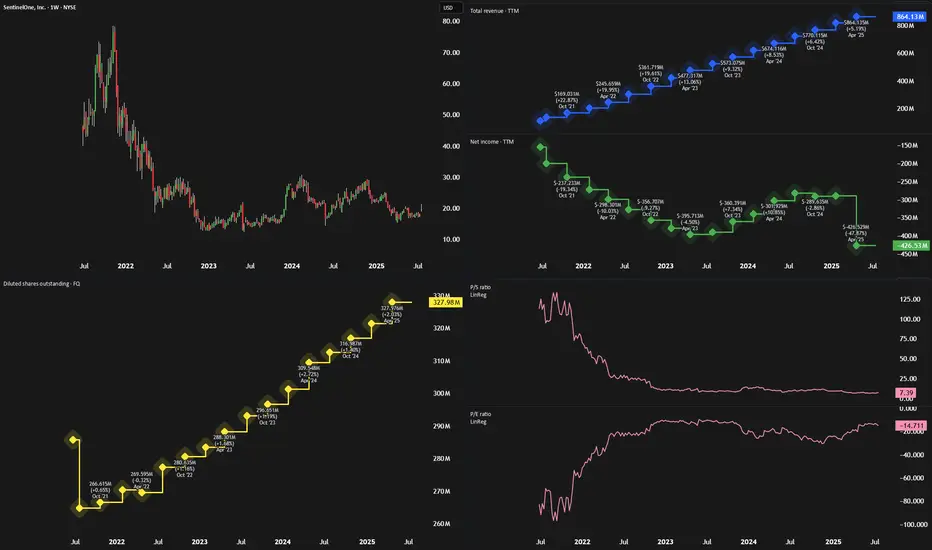
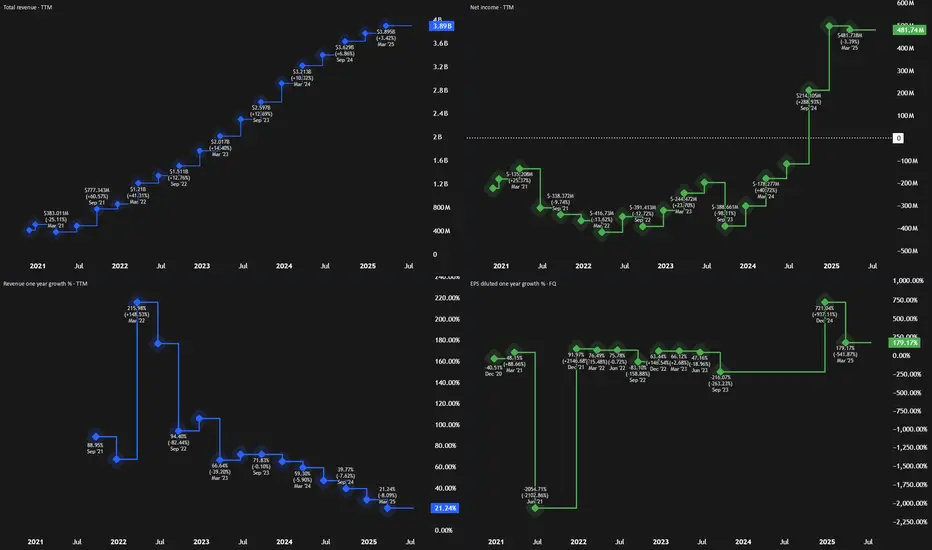
SentinelOne Looks Like Palantir Before The BreakoutIn every market cycle, some high-growth companies are misunderstood—until they aren’t. Palantir (PLTR) was one such stock, dismissed early for its lack of profitability and complex model, only to soar when its AI tools gained traction. Now, SentinelOne (NYSE: S) may be next in line.
🧠 What SentinelOne Does
SentinelOne is a top-tier cybersecurity firm offering an AI-powered endpoint protection platform called Singularity. Like Palantir, SentinelOne has faced criticism for:
Persistent losses
High stock-based compensation (SBC)
A misunderstood business model
Despite this, its technology is sticky, deeply embedded in client IT systems, and well-positioned to ride macro trends in AI and cybersecurity.
📈 Financials: Turning a Corner
While the stock hasn’t moved much in two years, trading around $18, SentinelOne’s fundamentals are improving:
Revenue Growth: Double-digit YoY revenue growth (23%+ in each of the last 10 quarters)
Free Cash Flow: $214 million in the past 12 months (~25% FCF margin)
Gross Margins: High and improving
Operating Expenses: Slowing, creating operating leverage
Adjusted Earnings: Near breakeven, signaling profitability is in reach
These trends mirror Palantir’s path before its breakout, particularly the shift from high OpEx to better margins and rising free cash flow.
💰 Valuation: Still Underrated
SentinelOne is trading at only 6x sales and 27x free cash flow, despite:
Strong 20%+ expected revenue growth
Analyst EPS estimates of ~$0.50 by 2028
A market cap under $6 billion
It’s significantly cheaper than peers like CrowdStrike and Palo Alto Networks—despite having similar growth and margin profiles.
⚠️ Risks to Consider
Fierce Competition: Cybersecurity is a crowded field. SentinelOne will have to keep innovating to stay relevant.
Market Sentiment: As a high-growth name, it may be hit hard in downturns.
Limited TAM vs. PLTR: The cybersecurity market isn’t as vast as AI data platforms.
🚀 Final Take
With strong recurring revenue, improving profitability, and an attractive valuation, SentinelOne looks poised for a re-rating. While it may not match Palantir’s scale or splash, the setup is strikingly similar.
Rating: Strong Buy
Why We See 100%+ Upside In SoFi Over The Next 3 YearsAfter soaring to nearly $28 per share during the SPAC-fueled fintech boom in 2021, SoFi Technologies (SOFI) crashed back to earth, trading under $5 as rising interest rates, regulatory headwinds, and lack of profitability dimmed investor optimism. But the tide has turned.
Over the past year, SoFi has reshaped its business and posted significant growth. Shares are now up 247% since our previous bullish call at $6. With the company now profitable and diversifying revenue, we'd argue there’s still upside ahead.
💼 A Stronger, Diversified Business
SoFi has evolved from a student loan-focused lender into a full-spectrum fintech platform. It now operates across:
Lending: $413M in Q1 revenue
Financial Services (consumer banking): $303M
Technology Platform (B2B): $103M
While lending still makes up the majority, the tech and services segments are growing fast—especially financial services, which doubled revenue YoY and tripled profit. SoFi's white-label platform also gives it a SaaS-like recurring revenue profile.
Q1 results showed:
Revenue: $770M (+33% YoY)
EPS: $0.06, with a $31M revenue beat
This business mix gives SoFi more stability and better scalability than many traditional financial firms.
💰 Valuation: Pricey vs. Banks, Cheap vs. Fintech
Critics point to SoFi’s rich valuation—trading at over 8x sales—as a concern. But when compared to other fintechs like NuBank (12x sales) and Robinhood (28x), SoFi looks much more reasonably priced.
On a forward earnings basis, SoFi trades at ~32x GAAP EPS, and if growth continues, this could drop below 30x. That’s appealing for a company expected to grow:
Revenue: ~25% annually
Net income: ~33% annually
By 2027, analysts project $1B in operating income, double today’s figure. If SoFi maintains current valuation multiples, this alone could double the stock in 3 years.
⚠️ Risks to Watch
Regulatory scrutiny in the financial sector
Cyclicality of consumer lending
Intense competition from firms like Robinhood, Chime, and Coinbase
Despite these challenges, SoFi’s expanding ecosystem and growing brand strength position it well.
✅ Final Take: Still a 'Strong Buy'
With accelerating revenue, expanding margins, and a scalable business model, SoFi has moved beyond its hype-fueled origins and is now a real fintech contender. Even after its rally, its valuation still leaves room for meaningful upside.
Rating: Strong Buy
The Markets, the Rabbi and the Goat...It’s funny how sometimes markets react like people in old jokes…
They scream when things get bad, then cheer wildly when things return to how they were — as if something amazing just happened.
Let me tell you one of those jokes.
It’s about a house, a rabbi… and a goat.
A man goes to the Rabbi:
“Rabbi, my house is too small. The kids are screaming, my wife’s yelling, I’m losing my mind!”
The Rabbi calmly replies:
“Bring in the chicken.”
Two days later:
“Rabbi, it’s worse!”
Rabbi:
“Now bring in the duck.
Then the pig.
And finally… the goat."
Now the house is in complete chaos. Smell, noise, no space to move or breathe.
The man returns, ready to break down:
“Rabbi, this is hell!”
The Rabbi smiles:
“Now take them all out.”
A few days later, the man comes back glowing:
“Rabbi… it’s incredible! So much space! So quiet! So fresh!”
📉 Now, 2025 markets
In April, Trump imposed tariffs.
Markets fall sharply. Analysts scream recession. Headlines go full drama.
Recently, “brand new deals” have been announced.
Markets explode to new all-time highs.
Applause. Celebration. “Stability is back.”
But if you read the fine print…
The deal is basically the same old deal. Renegotiated. Repackaged.
Just without the goat.

What the Market Is Telling Us About Altcoin Season in 2025Altcoin season is that highly anticipated market phase where alternative cryptocurrencies outperform Bitcoin and dominate trading activity. As we move through 2025, several key signals suggest we may be entering just such a phase—and investors are paying close attention.
Key Market Indicators
Bitcoin dominance is falling below 50–52%, historically a sign of capital rotation into altcoins.
Trading volumes are spiking in Ethereum, Solana, Chainlink, Toncoin, and others.
Sector-specific excitement is building around Web3, AI tokens, and decentralized physical infrastructure (DePIN).
While this might be just the early stage of the altcoin cycle, the smart money is already positioning.
Investor Considerations
Focus on projects with real fundamentals. Ethereum, Avalanche, Cosmos, and Chainlink remain top infrastructure bets.
Utility is key. Projects with real-world application, strong developer activity, and growing user bases are best positioned for long-term growth.
Track sentiment. Watch for social buzz, news momentum, and open interest increases—often the earliest signs of breakout moves.
Bottom Line
Altcoin season doesn’t happen overnight. What we’re seeing now is the accumulation phase—an ideal time for data-driven investors to build high-upside portfolios. But caution is critical. Not every pump is sustainable, and smart risk management remains non-negotiable.
For those who prepare wisely, the 2025 altcoin season could unlock some of the most lucrative opportunities in the crypto space.

Hyperliquid AI Trading Launches to Revolutionize Crypto in 2025The launch of Hyperliquid AI Trading marks a major milestone in the evolution of digital markets. Positioned as an AI-native, fully on-chain trading platform, Hyperliquid is designed to offer high-speed, adaptive, and transparent execution — directly competing with centralized exchanges in efficiency and intelligence.
Within its first week, Hyperliquid processed over $3.7 billion in trading volume, highlighting early market interest. It leverages a proprietary AI engine that integrates real-time sentiment analysis, macroeconomic signals, and on-chain data to continuously optimize trading decisions.
“Hyperliquid arrives at the intersection of AI maturity and DeFi demand,”
says Lina Torres, Senior Analyst at Valtrix Group.
Key Features
AI-Driven Order Execution: Predicts slippage and market impact to route trades efficiently.
Sentiment-Aware Strategy Engine: Adjusts trading logic based on financial news and social signals.
Fully On-Chain Infrastructure: Offers transparency and verifiability for institutional-grade trust.
Self-Learning Models: Improves performance through continuous feedback.
Strategic Context
2025 has seen accelerating DEX adoption and a surge in institutional interest in DeFi. With the rise of spot crypto ETFs and maturing regulations, the market is ready for intelligent, decentralized infrastructure.
Valtrix Group forecasts that platforms like Hyperliquid could capture 8–12% of total DEX volume by Q4 2025, driven by algorithmic and high-frequency trading firms seeking smarter execution layers.
“This is not just faster DeFi — it’s smarter DeFi,”
notes Mark Evans, Chief Strategist, Valtrix Group.
Conclusion
Hyperliquid AI Trading signals a new era in crypto: one where artificial intelligence is fully embedded into decentralized finance. Its launch may set a precedent for the next generation of algorithmic trading infrastructure — agile, data-driven, and fully transparent.

OVERSOLDLooking for back over 300 quickly CEO just $2.44 million strong Q2 revenue growth of 14.3% year-over-year to $49.42 billion, revenue is as good as it was at 500$ but expenses have been high. Institutions are loading here, good long-term hold if we need to continue DCA.
EUR/USD – Smart Money Playbook | 1H Analysis🔹 Current Price: 1.1735
🔹 Session Range: Day High 1.1760 | Day Low 1.1679
📊 Market Structure:
Clean bullish structure after breaking the previous range high.
Liquidity grab above Buy Side Liquidity (BSL) and forming a bear flag near premium zone.
🔍 Smart Money Concept Flow:
✅ Premium OB tapped → Distribution in progress
✅ Bear Flag forming → Potential break to downside
🔹 Re-accumulation zone aligned with 1H Order Block (OB)
🎯 If price retraces to 1.1680–1.1700 OB zone and holds → Bullish continuation likely
📈 Trade Idea:
Wait for pullback into 1H Bullish OB zone
Confirm entry via bullish reaction / iMS / FVG
Target: Sweep of Day High + Mitigation of upper OB (1.1780 zone)
⚠️ Risk Note:
This idea is based on smart money concepts (liquidity, structure, and OB logic). Always use proper risk management and confirmation before entries.

LMT: Lookheed Martin Dropped on Earnings 23-07-2025The dividends now is around 3% which is good for a strong company like Lookheed Martin. But as we are seeing a drop in company profits & Equity, and the stock price is near to a support level, we have to monitor the stock for the next few days or weeks. If all is ok, I will consider buying it.
Disclaimer: This content is NOT a financial advise, it is for educational purpose only.

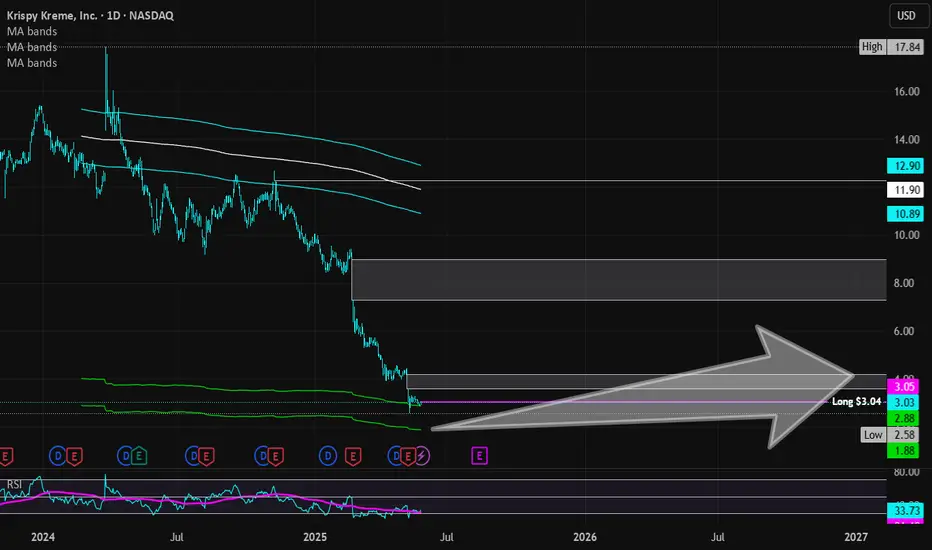
Krispy Kreme | DNUT | Long at $3.04Krispy Kreme NASDAQ:DNUT has entered and slightly exited my simple moving average "crash" indicator. More often than not, this zone (currently between $1.88 and $2.88) is a bottom indicator. However, this means there is a still a probability that stock could drop to a value less than $2 in the near future (and I wouldn't be surprised if it gets there). But predicting a "true" bottom is a fool's game. Building a position using data-driven decisions is the best strategy.
Fundamentally, NASDAQ:DNUT has many economic headwinds and a relatively high probably of bankruptcy in the next 24 months. It brought in $1.6 billion in revenue in 2024 and is a great target for takeover, but that requires a crystal ball. Earnings are anticipated to become positive by 2026, but growth is slow. The dividend yield, currently around 4.8%, may get cut in the near-term to help the company financially (again, crystal ball needed). Short interest is 30% with a float of 78 million... Debt to Equity = 0.90x. Essentially, if it can get through 2025, the company predicts it can turn things around into 2026 and beyond.
So, is this a good investment? Fundamentally, many better options are out there. From a technical analysis perspective, a potential opportunity. Thus, a gamble. I'm not betting the farm here, but at $3.04, NASDAQ:DNUT is in a buy zone - with a warning for potentially better entries to emerge in the near future in the $1-$2 range.
Targets:
$3.60
$4.20
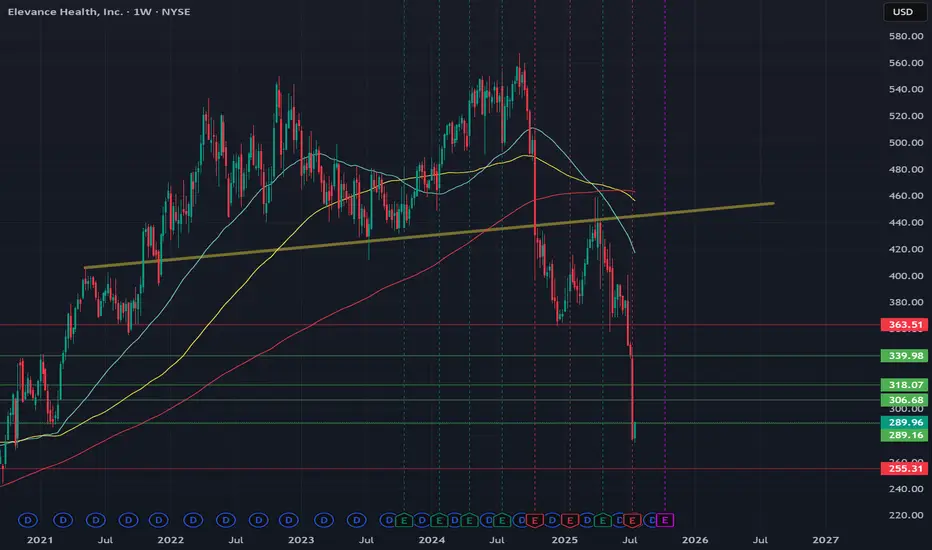
Molina Healthcare | MOH | Long at $181.69Healthcare providers and services are at a major discount right now: and may be discounted even more this year. I am personally buying and long-term holding the fear, knowing the baby boom generation is going to utilize our healthcare system at a rate unseen in modern times. While the price discounts are valid "right now" given the current political administration's cuts, long-term it is far from valid... The strategy I am using with healthcare stocks ( NYSE:MOH , NYSE:CNC , NYSE:UNH , NYSE:ELV , etc) is cost averaging: not buying one single large position in an effort to predict bottom but buying smaller positions over time to create a cost average "near" bottom. If you are a day trader or want a quick swing in healthcare, I don't think it's going to happen for a bit. But those not entering in the coming months / year will likely miss out on a very large healthcare boom - especially when AI truly enters the picture in this sector...
Fundamentally, Molina Healthcare NYSE:MOH is a very strong company. Low debt-to-equity (.9x), P/E of 8.8x, quick ratio of 1.7x, $41 billion in revenue in 2024. Yes, there will be issues in the near-term due to Medicaid and other funding cuts. But long-term, this sector is primed to benefit from an aging population.
So, while NYSE:MOH is in a personal buy zone at $181.69, I don't think this is necessarily bottom. I anticipate this stock to drop even further, eventually closing the daily price gap at $135.00. My next buys are in the $150's and $130's, thus cost averaging into a larger position. For true value investors, those prices and anything below is a steal. Today's negative healthcare sector noise is loud, but it does not represent the future.
Targets into 2028:
$226.00 (+24.3%)
$290.00 (+59.6%)

VZ: Verizon stock update after earningsVerizon jumped on positive results, which aligned with my bullish view on it.
Tomorrow will have its competitors T-Mobile & AT&T earnings result, this will update us on the industry as well. Most probably that I will go long on it in the next 24Hr.
Disclaimer: This content is NOT a financial advise, it is for educational purpose only.

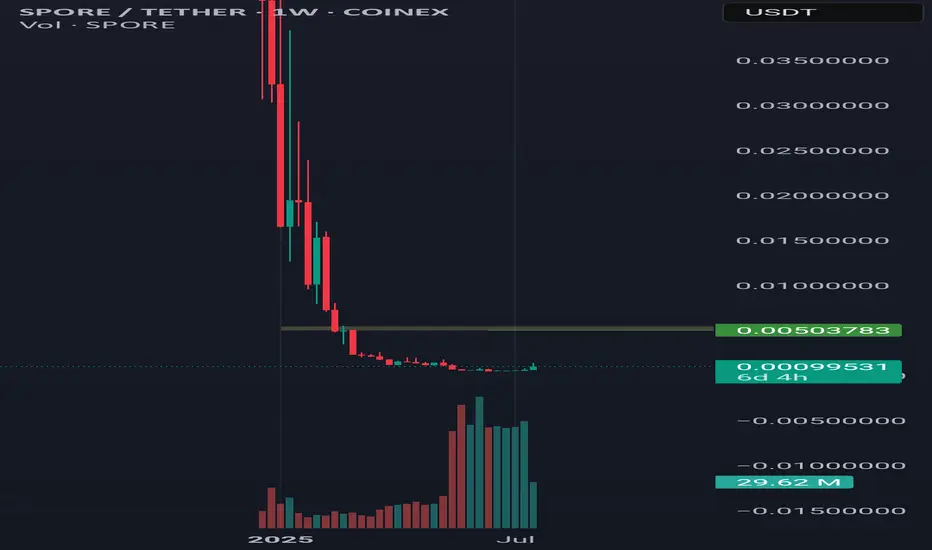
Spore is longI analyze the Spore currency for your loved ones. I think there is a lot of potential for growth. The first goal can be reacted to the Ardeh Block in the range of 0.005, given the many volumes that are purchased from this currency I recommend that I have some in your basket even Targets $ 1.3 And $ 14 in the long run by some analysts for this forecasted currency hope your next millionaire be yours.🤑
Comment and like plz🇮🇷
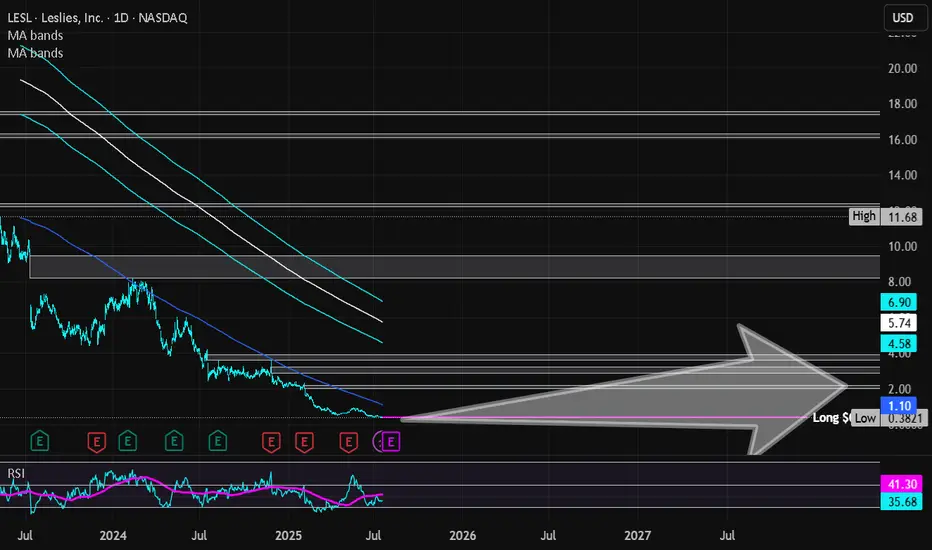
Leslies Inc | LESL | Long at $0.41**VERY risky trade - 25% or more risk of bankruptcy**
Leslies NASDAQ:LESL is a direct-to-consumer pool and spa care brand in the U.S., selling chemicals, equipment, and services. The stock dropped 88.86% last year due to weak demand, flat revenue, shrinking gross margins from stock write-downs, higher rent, shipping costs, and an earnings miss (-$0.25 vs. -$0.244). High debt, market share losses to e-commerce, and a competitive pool supply market also contributed.
On a positive note, the company generated $1.33 billion in revenue for fiscal year 2024. New leadership has entered the picture, cost-cutting is starting to happen, and summer season may boost pool sales. While 2025 is still projected to be a rough year, revenue is forecasted to grow 6.4% in 2026 and 2027 and earnings are likely to turn positive (based on company statements). While this is a *highly risky* play and there are absolutely better companies out there, I think there is a chance this ticker may get some steam in the near future. 7% short interest, 176 million float.
Thus, at $0.41, NASDAQ:LESL is in a personal buy zone.
Targets into 2027:
$1.00 (+143.9%)
$2.00 (+387.8%)