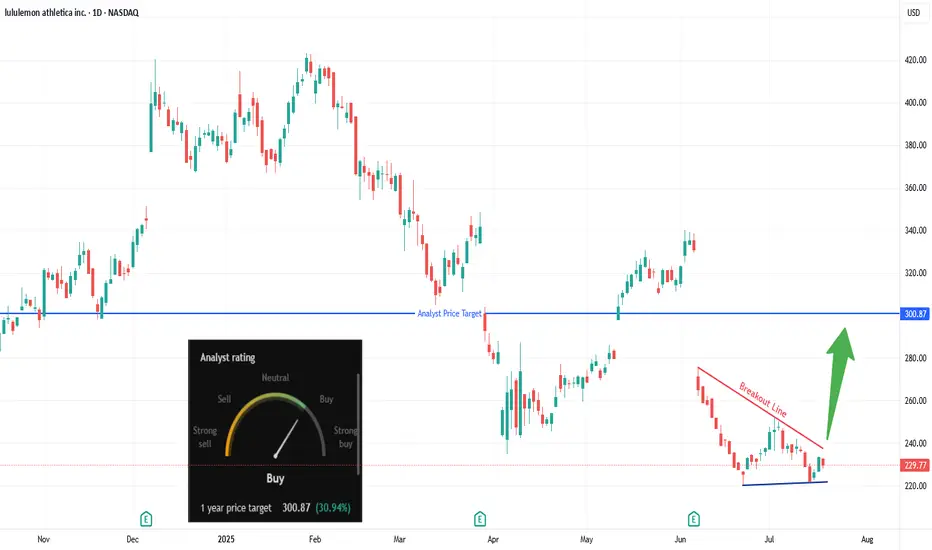
Are Bulls Quietly Loading Up on LULU?Trade Summary 📝
Setup: Descending wedge forming after sharp drop; price testing breakout line.
Entry: Above $240.
Stop‑loss: Below $220 swing low/support.
Targets: $260 , $293–$301 (analyst target).
Risk/Reward: ~3:1 (tight stop, multi-level upside).
Technical Rationale 🔍
Key Signal #1: Descending wedge/bullish reversal pattern; oversold bounce.
Key Signal #2: Bullish divergence forming on recent lows; higher low established.
Context: Daily chart; aggressive sellers losing momentum as wedge tightens.
Catalysts & Context 🚦
Recent gap down created potential “magnet” for gap fill upside.
Surge in unusual OTM call buying last week hints at speculative bullish positioning.
Analyst 1-year target: $300.87 (+30% upside); rating upgraded to Buy.
Watching for sector rotation into consumer discretionary/retail names.
Trade Management Plan 📈
Entry: Only on daily close above $240 breakout line.
Stop‑loss: Initial below $220; trail to breakeven if $260 target hits.
Scaling: Trim at $260, hold partial for $293–$301 extension.
What’s your view? Are you watching LULU? Comment below or vote:
🔼 Bullish
🔽 Bearish
🔄 Waiting for confirmation
*** Follow us now to ensure you don't miss the next big setup ***
Disclaimer ⚠️: Not financial advice. Trade at your own risk.
Value
SLB: Schlumberger updateIt seems SLB is at good valuation now, but a risk in dropping international revenue still need to be figured out.
if this can be solved, then SLB is good to go.
Disclaimer: This content is NOT a financial advise, it is for educational purpose only.

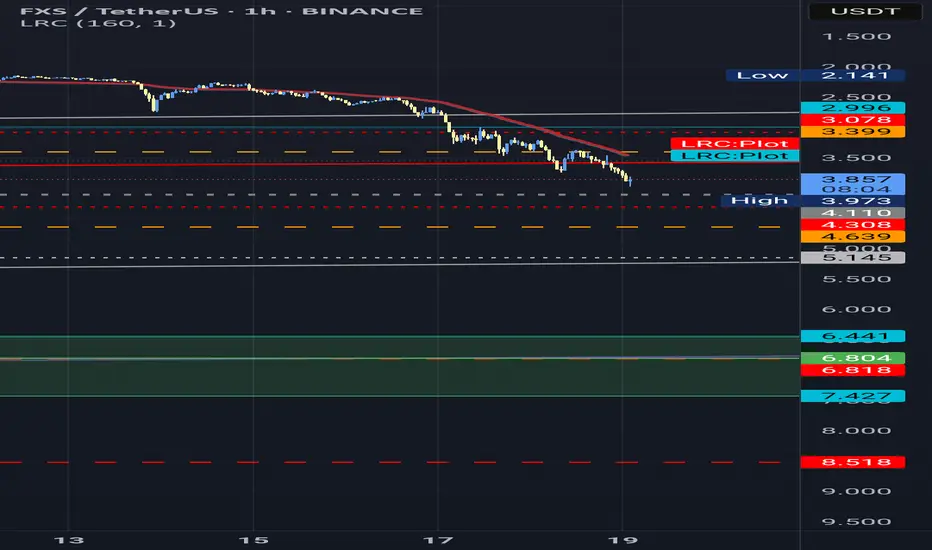
Bumpy road to 13$ (4$ - 5$ - 6$ - 7$)According to the information available about #fxs and, market's overall situation which experienced knows about; the real worth for FXS is higher than these prices.
The value increase for FXS will happen one way or another; but, the real question is... if it will be able to hold on to that price level or not? And, the answer to that lies on it's developers and, wether they'll be able to constantly improve this project and resolve future and remaining challenges and obstacles in this project and, develope it's potential to attract more investment, and keep their current investors.
Elevance Health | ELV | Long at $286.00What are seeing in the healthcare and health insurance provider industry right now is destruction before a once-in-a-lifetime boom. The baby boomer generation is between 60 and 79 right now and the amount of healthcare service that will be needed to serve that population is staggering. Institutions are crushing them to get in - it's just near-term noise, in my opinion. My personal strategy is buy and hold every healthcare opportunity (i.e. NYSE:CNC , NYSE:UNH , NYSE:HUM etc).
Elevance Health NYSE:ELV just dropped heavily due to lower-than-expected Q2 2025 earnings, a cut in full-year profit guidance from $34.15-$34.85 to ~$30 EPS, and elevated medical costs in Medicaid and ACA plans. It's near-term pain (may last 1-2 years) which will highly likely lead to long-term growth. The price has touched my historical simple moving average "crash" band. I would not be shocked to see the price drop further into the $260s before a rise. However, the near-term doom could go further into the year. I am anticipating another drop to the "major crash" simple moving average band into the $190s and $220s to close out the remaining price gaps on the daily chart that occurred during the COVID crash. Not to say it will absolutely reach that area, but it's locations on the chart I have for additional buys.
Thus, at $286.00, NYSE:ELV is in a personal buy zone (starter position) with more opportunities to gather shares likely near $260 before a bounce. However, if the market or healthcare industry really turns, additional buys planned for $245 and $212 for a long-term hold.
Targets into 2028:
$335.00 (+17.1%)
$386.00 (+35.0%)

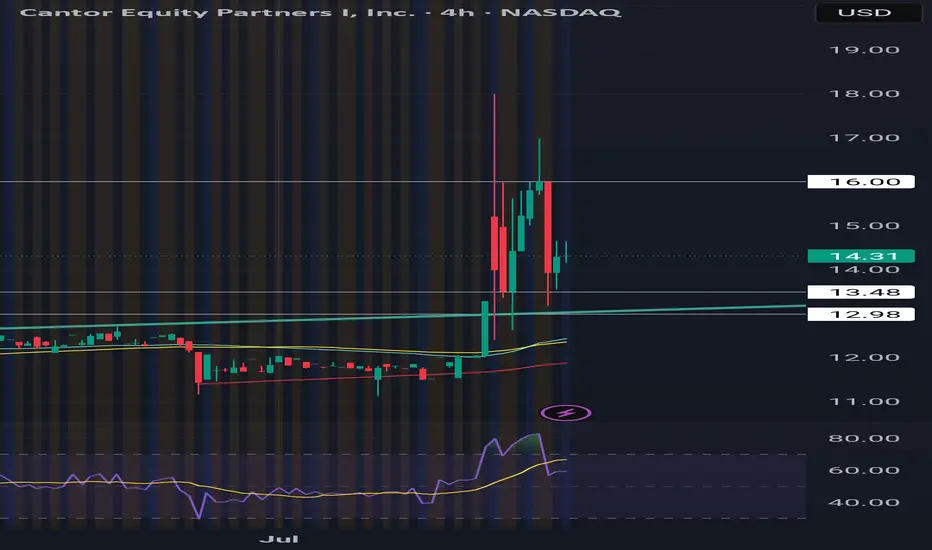
BTC TREASURY Adam Back, a satoshi era OG, is launching Bitcoin Standard Treasury Company (BSTR), which plans to go public through a merger with Cantor Equity Partners I (CEPO), a special-purpose acquisition company. BSTR will debut with 30,021 BTC, valued at approximately $3.5 billion, making it the fourth-largest public Bitcoin treasury. The company has secured $1.5 billion in private investment in public equity (PIPE) financing, the largest for a Bitcoin treasury SPAC merger, with CEPO contributing up to $200 million, subject to shareholder redemptions. The merger, expected to close in Q4 2025, aims to maximize Bitcoin ownership per share and accelerate adoption through Bitcoin-native financial products and advisory services. Ill be loading shares tommorrow and continuing to dca. Btc price swings will influence this heavily wind direction is currently North!
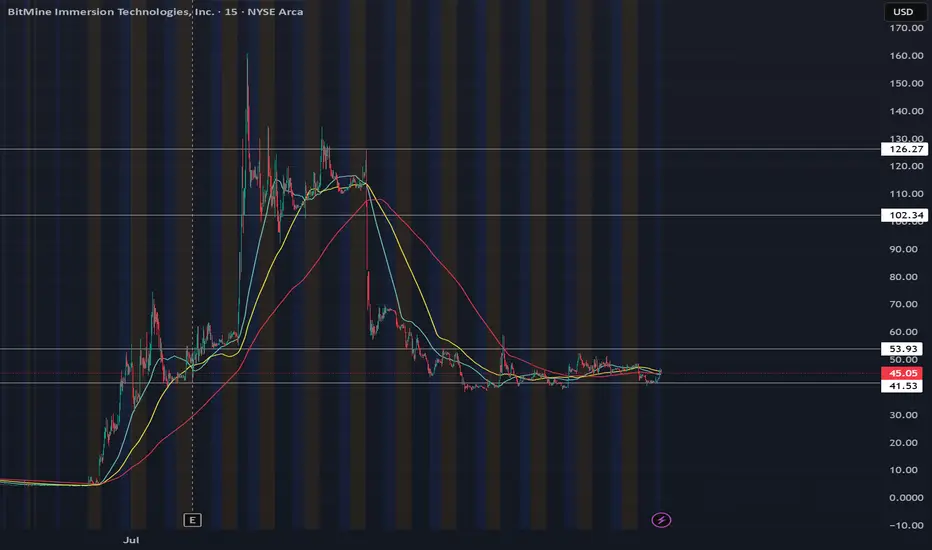
BACK TO 100Bought shares today at close new legislation is going to send this sky high. BMNR just may actually be the MSTR of ETH with the players they have. SBET BTBT COIN all will do great, but BMNR currently holds the lead for largest ETH treasury. Maybe more chop to average shares but this will be going SOON. As long as the daily RSI is above 50, we should be holding local support until breakout of this is accumulation zone.
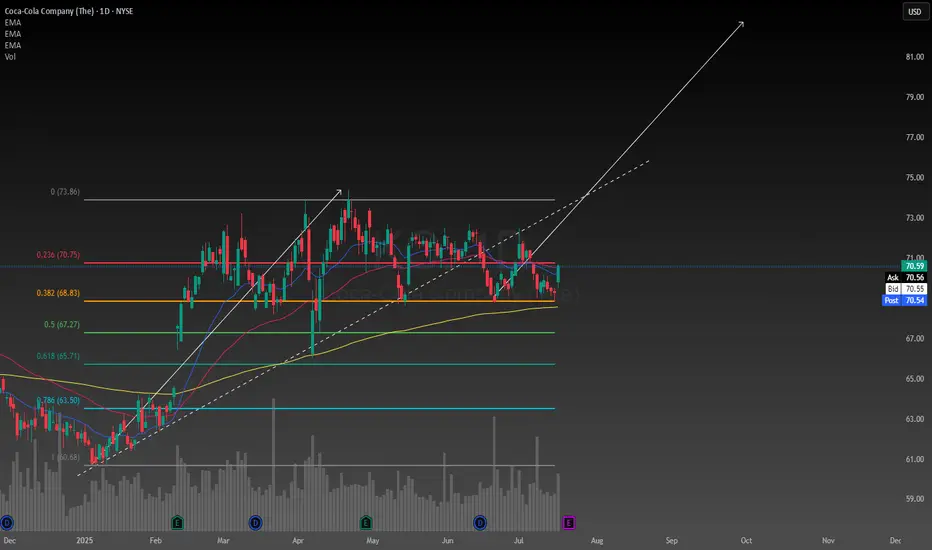
Coca Cola to protect my portfolio and help it growOne of the most important things we must try to determine as investors is what company is the best at what they do in their field. In my opinion Coca Cola is and has always been the number one soft drink manufacturer, always finding new yet subtle ways to stay ahead of their competition.
The reason I have allocated a decent amount of my portfolio to Coca Cola is a combination between their reliable track record of creating value, and paying dividends. People love junk food so it gives me high conviction to hold the stock long term. The company also demonstrates consistent, and reliable methods of generating organic revenue, and constantly finding new ways to cut costs and improve their profit margins.
Despite what some other critics may claim about the stock being over valued, the intrinsic value of the stock happens to be $77 with a range between $48-$180. According to technical analysis it is over valued. I have too much respect for Coca Cola to trust technical analysis in my decision to hold the stock, I am rely solely on fundamentals. According to my perspective on the company it is in fact undervalued.
Another positive catalyst I have noticed was when President Trump said he thinks Coca Cola should be made with cane sugar in the US, I think that would be a great idea, not only would it be healthier the soda would also taste better. Coca Cola looks like its going to stay ahead of the game for the foreseeable future.
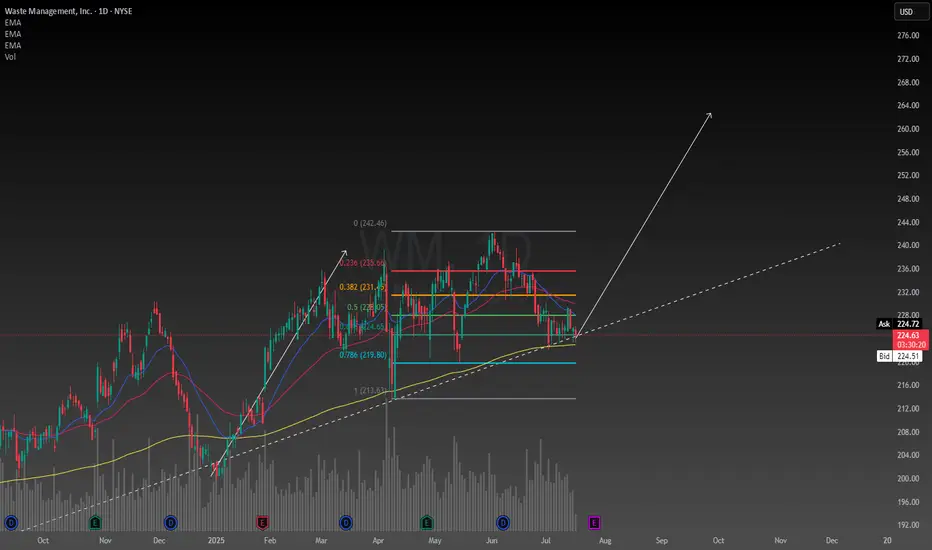
Waste Management confluencesFirst of all fundamentally the company is basically essential to our survival so I have no reason to believe they will go out of business any time soon. Earnings report soon should bring about some volatility. I was foolish enough to buy the top a couple months ago and deciding today I will add the the position because I like this price. Even though I bought the top, it was still below the intrinsic value at the time so it was a reasonable decision.
With my simple trendline and rudimentary use of a Fibonacci I am able to set a price target of $260 depicted by my drawing of a potential new leg up. This is backed up by the absolutely fundamental usage of a calculation of the intrinsic value, which by my calculation is $280, and has a range between $170-$640 however these numbers may need to be adjusted after the earnings report. The value is now well below the intrinsic value so I am seeing this stock as a really good deal now.
Despite any uncertainty in the economy Waste Management has seemed to outperform during these times so it is in my portfolio defensively. This stock is strong when it needs to be, which is why I like it.
MicroCap Rare Earth Play in CanadaToo much to say about this other than more cash than market cap, Offtake Agreements and Collaboration with Teck Resources and Tanco Mine with Rising Metal Prices including huge reserves of Cesium, Lithium, PGM, Nickel, Copper... everything needed for electrification and AI transition in North America. Will be acquired in the next 12 Months IMO.

Ethereum's Road to $7500 – Strategic Entries & Profit Optimizati🔵 Entry Zone: My first position is placed at $2225.5, aligning with a strong support level, while a secondary entry at $1857.5 serves as an additional safeguard against unexpected market swings—lowering my average purchase price and protecting capital.
💰 Profit-Taking Strategy: For low-risk traders, securing a 40% profit from the first entry is a prudent move to lock in gains early. However, my long-term target remains ambitious.
🚀 Main Target: Based on valuation models and fundamental news, Ethereum’s upside potential points toward $7500. However, I personally plan to secure 90% of my holdings at $6000, ensuring strong profit realization while leaving room for further upside.
This setup balances risk management, smart positioning, and strategic profit optimization. Let’s see how ETH’s trajectory unfolds!
Entry1: 2225.5
Entry 2: 1857.5
If your second entry is successful, you are required to withdraw 50 to 70 percent of your capital to maintain your capital. I will definitely update this setup.

Rising into big selling volumeIf it holds .60 seems bullish due to selling be absorbed, otherwise looking for it to dip to high volume node at .40 and rise on fundamentals.


KALV FDA approval rallyKALV received FDA approval this week for a new drug, has $220mln in cash, and just bounced off the daily 21EMA (overlayed on this 4H chart).
Recently rejected off the monthly 100ema two times (overlayed on this 4H chart). Breakout beyond the monthly 100ema and first target is $20. Numerous price target increases, most notably, one at $27 and another increased from $32 to $40.

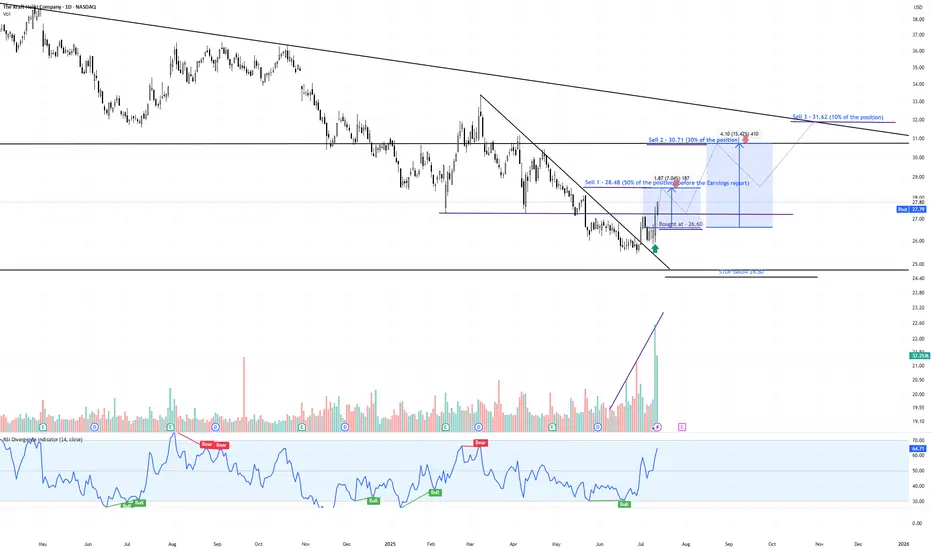
KHC – Momentum Reversal with Volume Surge & Tactical Exit Plan📈 Ticker: NASDAQ:KHC (The Kraft Heinz Company – NASDAQ)
📆 Timeframe: 1D (Daily)
💵 Current Price: $27.80
📊 Pattern: Falling Wedge Breakout + Volume & RSI Divergence
📌 Trade Setup:
✅ Our Entry: $26.60
⛔ Stop-Loss: Below $24.80
🔰 Confirmation Signals:
Bullish volume divergence: Selling pressure diminished while price made lower lows
Explosive green volume bar on breakout — strongest in 12+ months
RSI breakout above 60, confirming strong momentum and trend shift
💰 Profit-Taking Strategy:
📍Sell Zone Price Level % of Position Rationale
🥇 Sell 1 $28.48 50% Pre-earnings resistance – lock early profit
🥈 Sell 2 $30.71 30% Next strong resistance area
🥉 Sell 3 $31.62 10% Long-term descending trendline — potential reversal point
🔄 Remaining 10%: Optional trail with stop-loss raised, if momentum continues
📊 Technical Confidence & Probabilities:
🧠 Pattern: Falling Wedge
Bulkowski probability of breakout upward: ~68%
Average gain post-breakout: ~38%, though current targets are more conservative (15–19%)
📈 Volume breakout + prior divergence = strong institutional signal
📉 Risk clearly defined with stop at $24.80
📈 Target Gains vs Entry ($26.60):
🎯 Target Price Gain from Entry
Target 1 $28.48 +7.06%
Target 2 $30.71 +15.47%
Target 3 $31.62 +18.89%
🧾 Summary:
This is a high-probability breakout play, combining:
✅ Bulkowski-validated falling wedge
✅ Volume-based confirmation
✅ Clear stop and tiered exit strategy
✅ Strong risk/reward profile
“Our Entry Price: $26.60 – Breakout Backed by Big Money”
#KHC #TargetTraders #VolumeSpike #BreakoutTrade #TechnicalAnalysis #Bulkowski #StockMarket #Investing
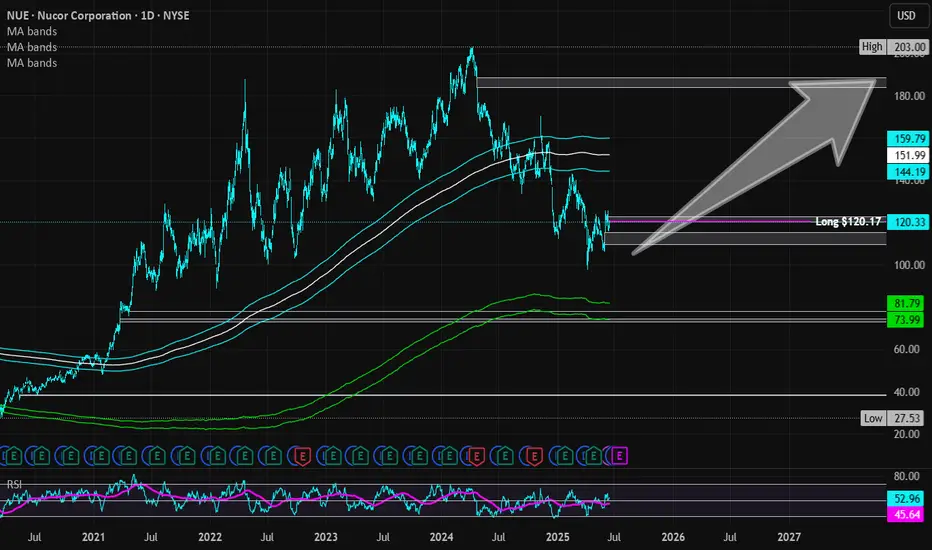
Nucor | NUE | Long at $120.17Nucor NYSE:NUE , a US manufacture of steel and steel products, will likely capitalize on reduced foreign competition as tariffs become reality. The CEO also recently stated that the steelmaker's order backlog is the largest in its history and is increasing prices. So, while there is a potential for short-term downside as tariff "unknowns" are negotiated, the longer-term upside may be there for those who are patient... but time will tell.
Basic Fundamentals:
Current P/E: 21x
Forward P/E: 15-16x
Earnings are forecast to grow 29.6% per year
Projected Revenue in 2025: $32.3 billion
[*} Projected Revenue in 2028: $39.4 billion
Debt-to-Equity: 0.4x (healthy)
Dividend Yield: 1.8%
Technical Analysis:
Riding below the historical simple moving average and there is risk the daily price gap near $109 will close before moving higher. If there is a "crash" in price, $70s is absolutely possible which will be a "steel" if fundamentals do not change.
Targets in 2027:
$142.00 (+18.2%)
$187.00 (+55.6%)
Green Plains | GPRE | Long at $4.18Green Plains NASDAQ:GPRE , a company involved in the production of fuel-grade ethanol and corn oil, and grain handling/storage has seen a significant decline in stock price since 2023. Analyzing the company's historical stock performance shows it is highly cyclical and goes through "boom and bust" cycles every 4-8 years - whereby during booms the price has typically 10x'ed from the lows. History may not repeat, though.
From a pure technical analysis perspective, the company has already entered and slightly exited by "crash" simple moving average zone (green lines). While the lows may not be in yet, this zone (currently between $1.20 and $3.30) typically represents a longer-term bounce area or price consolidation.
Fundamentally, the company is currently unprofitable but expected to become profitable in 2026 and beyond. Debt-to-equity = 0.72x (low/moderate). Price-to-book = 0.31x. During the most recent earnings call, Chief Legal and Administration Officer at Green Plains noted the company’s past performance has not met expectations, but stressed “that is changing.” This includes exiting non-core operations and launching the sale of non-strategic assets in a commitment to achieve $50 million in cost reductions. The company is on track to meet that goal and has already achieved $30 million in annualized cost savings.
It's a speculative play that could go to $0. But at $4.18, NASDAQ:GPRE is in a personal buy zone based on technical analysis as well as future fundamental predictions (which could be BS...).
Targets:
$6.00
$8.00

ITS TIMEGME coiled on the 4hr RSI break 50 were launching from the POC area to 24.50 to next MA. Overall target after taking 26 is VAH around 27.58. The drop down was profit taking/ overextended /sell the news after all the hype leading into the btc purchase announcement they didn't disclose purchase price either from what I know. But btc is at ATH the 500M is now in decent profit and last quarter rev and earnings were good. Last time gme broke out was 17% on a overall stock market correction day, seems like thats going to be the case again for now im in the Aug 1 25 calls for .6 looking to close these in profit and roll to higher further out strike like the jan 26 35. cheers, here kitty kitty.

Oxford Industries | OXM | Long at $38.10Oxford Industries NYSE:OXM is an apparel company that designs, sources, markets, and distributes lifestyle brands like Tommy Bahama, Lilly Pulitzer, and Southern Tide. While I am not super bullish on the retail sector given the blaring recession signals, I also don't think this is the end of life as we know it... the anticipated downside is already priced-in for many retail brands.
From a technical analysis perspective, NYSE:OXM has entered my "crash" simple moving average zone. Typically, but not always, this is an area where value investors accumulate shares in anticipation of a future rise in share price. While the price is likely to dip near $28-$30 in the near-term, the last open price gap on the daily chart since the COVID-19 pandemic was closed today. Also, last week, an NYSE:OXM Officer and the CEO bought just over $600,000 in shares near $40 and the stock is currently trading at book value.
Fundamentals:
P/E = 7.4x (apparel sector average = 22.4x)
Forward P/E = 11.4x
Dividend = 7.25%
Debt-to-equity = .2x (healthy)
Regardless of some strong fundamentals, persistent macro volatility, consumer caution, and tariff pressures may delay recovery. Analysts expect flat to declining sales in 2025, with limited organic growth. Like I mentioned above, while there is likely short-term pain here, the fundamentals are there to potentially weather the storm.
Thus, at $38.10, NYSE:OXM is in a personal buy zone with the further decline between $28-$30 likely (where additional share accumulation will occur as long as the fundamentals do not change).
Targets into 2027
$45.00 (+18.0%)
$50.00 (+31.2%)

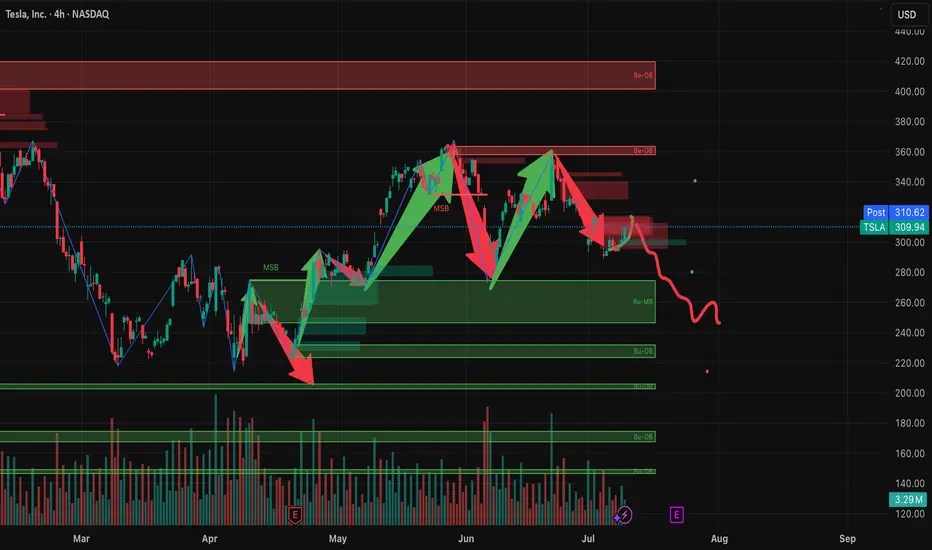
Why TSLA will Crash based On Copper TarrifsHere’s why that bearish outlook is gaining traction:
Copper costs are surging: Tesla uses over 180 pounds of copper per vehicle. With prices spiking 13% in a single day and a 50% tariff looming, production costs are rising fast.
Analysts are cutting price targets: UBS, JPMorgan, and Bank of America have all lowered their forecasts for Tesla, citing margin pressure and weakening demand3.
Brand sentiment is shaky: Tesla’s recent delivery miss and political controversies around Elon Musk have added to investor unease.
Tariff ripple effects: The broader trade war is expected to disrupt supply chains and inflate costs across the EV sector5.
That said, some analysts still see long-term upside if Tesla can pivot quickly—especially with its AI and autonomous driving ambitions. But for now, the market is reacting to the immediate risks.
Overall Enter Short for Gains of 3-5 percent.
Cable One | CABO | Long at $130.82Cable One NYSE:CABO is a leading broadband communications provider under the Sparklight brand, offering high-speed internet, cable TV, and phone services across 24 U.S. states.
Book Value: $315.50.
Positive:
Strong liquidity: Quick ratio 1.47 (above industry avg ~1.0).
Undervalued vs. industry (1.91x).
Large customer base: ~1.1M customers, 2.8M data subscribers.
Stable revenue: Broadband focus in non-metropolitan markets.
Insiders buying over $1 million in share recently while also being awarded options.
Recent change in leadership.
Negatives:
Medium-high bankruptcy risk: Altman Z-Score 1.36 (below industry ~2.5).
High leverage: D/E 1.78 (above industry ~1.0).
Weak earnings: Negative margins, declining profitability.
Suspended dividend.
Classify this one as a risky investment, but it is very undervalued at this price and the upcoming decline in interest rates may have a very positive effect on the company's stock (at least short-term: 5 million float, 19% short interest). Regardless, not one to put your life savings into. From a technical analysis perspective, I foresee a potential drop between $115 and $120 in the near-term and rise from there. It all depends on the upcoming earnings, so label this one a "gamble" with high bankruptcy risk.
Regardless of bottom predictions, NYSE:CABO is in a personal buy zone at $130.82 for a swing trade.
Targets into 2027:
$190.00 (+45.2%)
$250.00 (+91.1%)

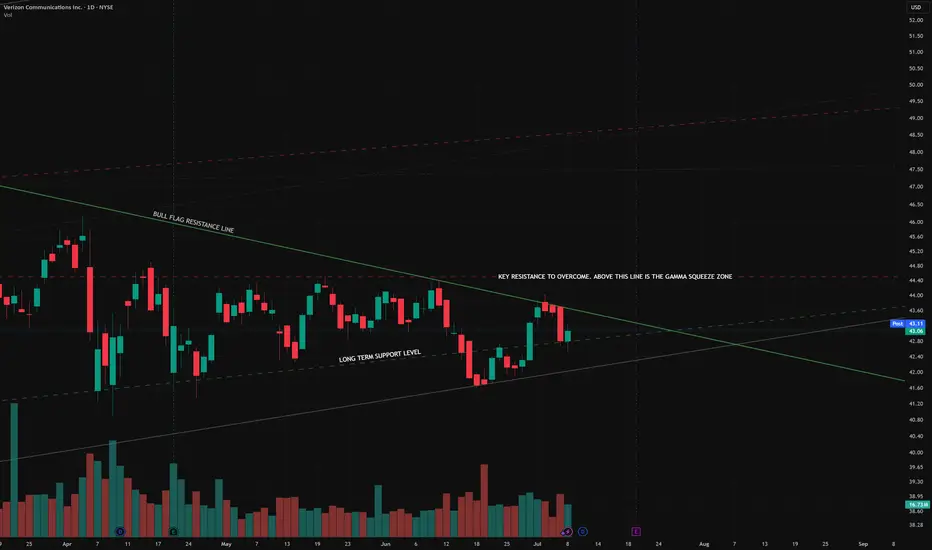
Where is Verizon headed next?Some quick points about the slight dip Verizon experienced over the past 5 trading days. Did bears step in and reject higher prices for VZ? Is the potential for a rally over?
In my opinion. No. But why you ask?
This stock trades relatively inverse to 10 year treasury yields. The 4 down days recently coincided exactly with 4 green days for 10 year yields. This is because if treasury prices fall, and thus yields go up, it makes Verizon theoretically less appealing because though you will generate less yield from treasuries, they are backed by the US government.
So in order for Verizon's yield to be more competitive with treasuries, naturally the price declines. When treasury yields drop, VZ can naturally rise, because the dividend can decline relative to price, and it's still appealing. This wasn't investors souring on Verizon, or the bears rejecting a rally, it was investors worrying about US debt repayment, and demanding higher interest payments from the government.
So why did yields spike for 4 days? The Big Beautiful Bill. Basically if the government borrows a bunch of money, and investors think that maybe there is a risk that they won't be able to pay them back, they demand a higher yield (treasury prices fall, and yields go up).
But if you ask me, that yield spike may already be over. The market tends to over-react to big news like this, and there are a few things happening right now that favor VZ going higher, I will list them below :
10 year yields have been trending down for months, they spiked, but only touched the top of the downtrend channel before retreating. They look poised to continue the downtrend for the second half of the week. Remember, the trend is your friend. Until yields break this channel convincingly and create an uptrend, you can assume they will continue downwards.
When tech stocks fall, yields tend to fall even faster, because investors seek the safety of treasuries to preserve capital and wait out the dip, which pushes bond prices up, and drives yields down (good for high dividend stocks like VZ).
Most tech stocks, and the QQQ ETF are looking very overbought. Earnings season is coming, but it looks like all of that action has already been priced in. There are bearish divergences appearing all over the place in tech stock RSI charts, I personally started closing out some positions already.
I'm still bullish on tech into the end of the year, but right now there is a lot of risk chasing the big names higher IMO. This is the longest stretch of days in 3 years without a 5-10% correction, which is already a red flag in itself. I won't be surprised to see some of the big names start to pull back as early as tomorrow, some of them have already begun to pull back. At least a minor correction looks highly probable, a deeper correction within the next few weeks.
10 Year Bond futures bounced and started climbing today (albeit, just a little, but in the right direction).
The market seems to be forgetting that US Treasury Sec. Scott Bessent's former job was literally selling US debt (driving yields down). He has made a career out of pushing yields down, and has stated it's his major goal with this administration. And like Elon said "if you are betting against the bond market, I think you are on the wrong side of that bet." (in short, this is a bullish theme for dividend stocks which are sensitive to yield fluctuations).
All in all, my thesis from previous posts remains. VZ is going higher, so long as 10 year yields don't rocket to all-time highs and stay there forever, and there is no apocalyptic earnings report, I see no reason why it won't.
I don't think this will be left in the past...Well well well, Walgreen's is definitely going to try and redo there entire business model in order to save it.
There are some weird and unbalanced volume levels left behind that I think we will see again this year.
Target is $12 and depending on this earnings, I don't know when it will hit. Shares only.

Bitcoin is bullish in world of War or Peace Simple and easy it is like Gold but better version and limited edition one.
Both(BTC & XAU) are bullish most of the time because future is not for Paper Tokens like Dollar or Yuan or Ruble or Euro or ..
Currency of strong countries seems interesting But soon with more laws and Taxes and Rules against each other Economic which USA start it, more and more Trades and things are going to take place in Crypto where the money is still non Trackable or it is tax free.
Also in a world of War as i mentioned in previous Analysis too, more Buys and Sells are going to take place via Crypto instead of countries currency.
Some countries Now are buying and selling weapons from their enemies even and it is possible in Crypto which no one judge or find the transactions.
interesting things which can not all written here are now need Crypto more than ever.
These prices are like a joke and soon maybe with or without some stop loss hunting to the downside and kicking out buyers with leverage market of Crypto will face another Huge gain.
DISCLAIMER: ((trade based on your own decision))
<<press like👍 if you enjoy💚
