Charter Communications (Revised) | CHTR | Long at $269.50 **This is a revised analysis from December 26, 2024: . My stop was triggered in that original trade after the recent price drop (some gains were taken at 13%, as noted).**
Charter Communications NASDAQ:CHTR stock recently dropped due to a disappointing Q2 2025 earnings report, with earnings per share of $9.18 missing estimates of $9.58 and a larger-than-expected loss of 111,000 residential internet customers. Despite the recent subscriber losses and increased competition, the following factors suggest long-term growth potential:
Network Expansion: Launch of 2x1 Gbps service in eight markets in 2025, boosting competitiveness.
Rural Growth: Rural revenue projected to reach 10–15% of total revenue by 2025.
Cox Acquisition: $34.5B merger expected to close by mid-2026, yielding $500M in annual cost savings by 2028 and enhancing market share.
Mobile and AI Strategies: Strong mobile growth and AI-driven customer service tools to improve retention and efficiency.
Lower Interest Rates: Reduced bowering costs to help with profit margins.
Charter's President/CEO recently grabbed $2.5 million in shares under $300. From a technical analysis perspective, there is an open price gap near $195 that could be of concern in the near-term. I foresee that being closed if the whole market flips or more bad news for the company arises. But, with a P/E of 7x and the industry average being near 13x, I believe NASDAQ:CHTR is a good value at the moment.
Thus, at $269.50, NASDAQ:CHTR is in a personal buy zone with a note of "risk" of a drop near $195 (a second personal entry point if it hits that level before targets are reached).
Targets into 2028:
$330.00 (+22.4%)
$375.00 (+39.1%)
Valueinvesting

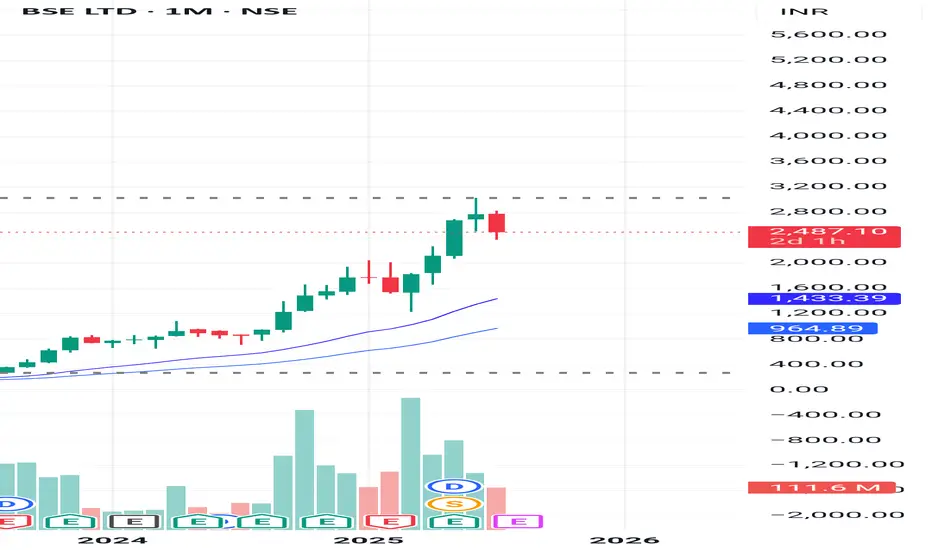
DCF VALUATION ANALYSIS OF BSEConclusion: OVERVALUED
:-OVERVIEW
BSE Limited has shown strong financial growth in recent years. Its revenue jumped from ₹924.84 crore in FY23 to ₹1,592.50 crore in FY24 (a 72% increase), and further surged to ₹3,212 crore in FY25, doubling year-on-year. EBITDA grew impressively to ₹1,779 crore in FY25 with a 60% increase, and EBIT reached ₹1,670 crore, up 56%. Net profit also rose significantly to ₹1,112 crore, with earnings per share increasing to ₹81. Dividend per share improved to ₹23, reflecting healthy returns
DCF:
-The valuation was performed using a Discounted Cash Flow (DCF) approach based purely on verified financial data and market risk parameters without relying on user-specific growth assumptions.
-The cost of equity was calculated using an adjusted risk-free rate plus equity risk premium multiplied by beta, resulting in a discount rate of approximately 13.58%. The terminal growth rate was conservatively taken as 4%. Using these reliable inputs and actual EBIT cash flows, the intrinsic enterprise value was estimated at around ₹36,839 crore, translating to an intrinsic value per share of approximately ₹1,364.
-Currently, BSE’s market price is around ₹2,480 per share, which is substantially higher than the intrinsic value derived from fundamentals, indicating the stock is trading at a significant premium. This valuation is grounded in audited company financials and globally accepted valuation methodologies, providing a trustworthy reference point for investors.
Dollar General | DG | Long at $90.00Dollar General NYSE:DG took a massive hit this morning after revising their future earnings guidance. The economy is showing many signs of a recession, and this is a clear warning. From a technical analysis perspective, it has retouched my "crash" simple moving average and may dip further into the $80's in the near-term. But, like many overall strong companies that suddenly plummet, I view this as a future opportunity given the strength of NYSE:DG as a business (holistically). Dollar General is the only grocery and home goods store around in many rural locations. So, while there is doom and gloom in the near-term, Dollar General is in a personal buy zone at $90.00. I view this as a starter position, though, with the potential for future declines/opportunities for additional share accumulation in the near-term.
Target #1 = $100.00
Target #2 = $122.00
Target #3 = $200.00+ (very-long term outlook...)

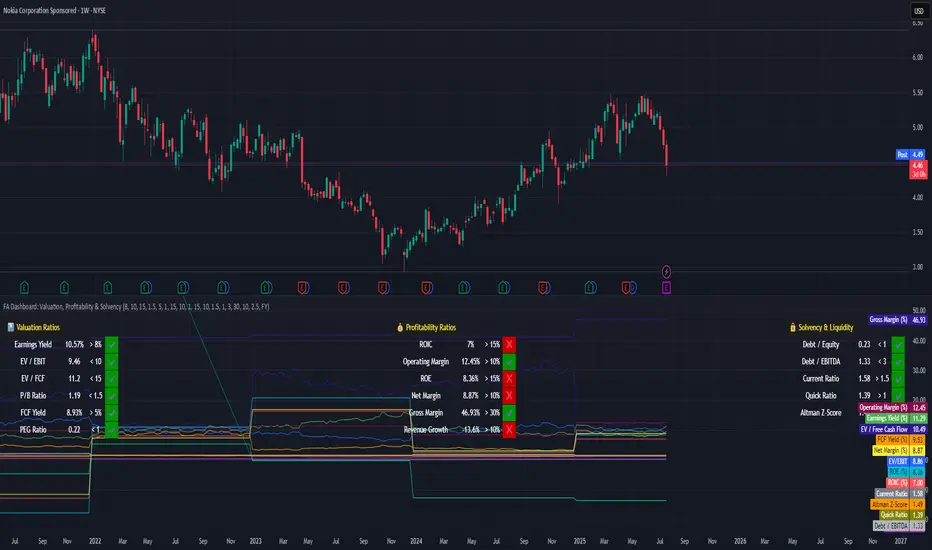
How to Evaluate Companies with a Fundamental Dashboard**Tutorial: How to Evaluate Companies with a Fundamental Dashboard (Example: Nokia)**
This tutorial explains how to use a custom-built dashboard in TradingView to evaluate companies based on key financial dimensions: **Valuation**, **Profitability**, and **Solvency & Liquidity**.
---
🛠 **How to Use This Tool**
This dashboard is meant to be an educational visual filter for fundamental analysis. Here’s how you can use it:
1. Add the script to any stock chart in TradingView.
2. Choose your preferred data period: annual (FY) or quarterly (FQ).
3. Adjust the thresholds in the script settings to reflect your investment approach.
4. The dashboard displays 17 key financial ratios grouped into three categories.
5. Each metric is evaluated visually with ✔️ (meets threshold) or ❌ (falls short).
6. Use this dashboard to identify companies worth deeper analysis — not to make automatic decisions.
---
📊 **Understanding the Dashboard Sections**
### 🔹 Valuation Metrics
Used to assess whether a stock appears undervalued based on price-to-value fundamentals:
- Earnings Yield
- EV/EBIT, EV/FCF
- P/B Ratio
- Free Cash Flow Yield
- PEG Ratio
### 💰 Profitability Metrics
Evaluate how efficiently the company turns revenue into profit:
- ROIC, ROE
- Operating, Net, and Gross Margins
- Revenue Growth
### 🔒 Solvency & Liquidity
Assess financial strength and balance sheet resilience:
- Debt/Equity, Debt/EBITDA
- Current Ratio, Quick Ratio
- Altman Z-Score
---
📍 **Case Study: Nokia (Ticker: NOK)**
This tutorial applies the dashboard to Nokia to demonstrate how to interpret results:
- ✅ **Valuation is strong**: Most metrics meet or exceed typical value thresholds.
- ⚠️ **Profitability shows weaknesses**: ROIC and revenue growth fall below expectations.
- 💪 **Solvency is healthy**: Debt is under control, though Altman Z-Score signals some risk.
This example helps show how the tool highlights strengths and red flags at a glance.
---
🎯 **Key Takeaway**
This dashboard is not a signal generator — it’s a thinking aid.
Its purpose is to help investors explore company fundamentals visually and consistently. The thresholds are customizable, and the tool encourages deeper due diligence.
---
⚠️ **Educational Disclaimer**
This tutorial is for educational purposes only. It does **not** provide investment advice or recommendations.
It is intended to demonstrate how to use a script to organize and interpret fundamental financial data.
Always do your own research and exercise independent judgment before making any financial decisions.
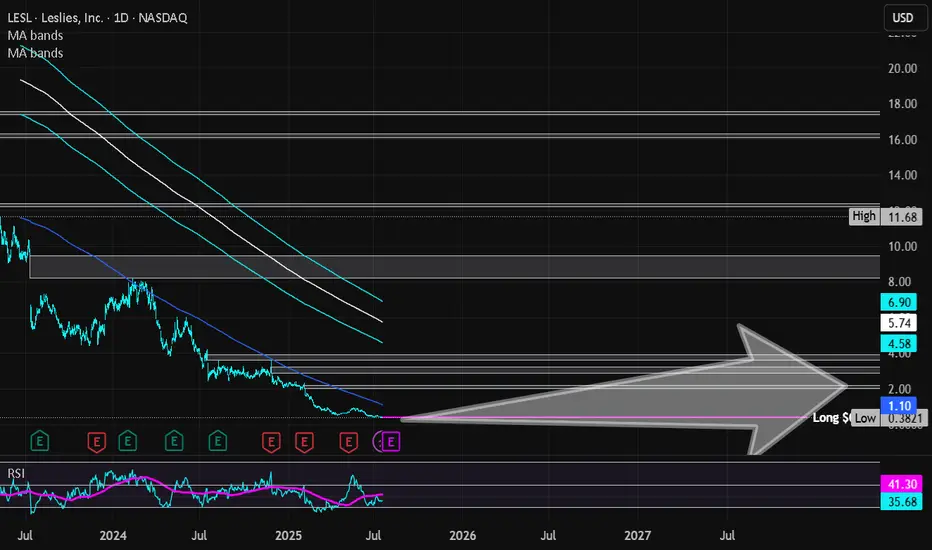
Leslies Inc | LESL | Long at $0.41**VERY risky trade - 25% or more risk of bankruptcy**
Leslies NASDAQ:LESL is a direct-to-consumer pool and spa care brand in the U.S., selling chemicals, equipment, and services. The stock dropped 88.86% last year due to weak demand, flat revenue, shrinking gross margins from stock write-downs, higher rent, shipping costs, and an earnings miss (-$0.25 vs. -$0.244). High debt, market share losses to e-commerce, and a competitive pool supply market also contributed.
On a positive note, the company generated $1.33 billion in revenue for fiscal year 2024. New leadership has entered the picture, cost-cutting is starting to happen, and summer season may boost pool sales. While 2025 is still projected to be a rough year, revenue is forecasted to grow 6.4% in 2026 and 2027 and earnings are likely to turn positive (based on company statements). While this is a *highly risky* play and there are absolutely better companies out there, I think there is a chance this ticker may get some steam in the near future. 7% short interest, 176 million float.
Thus, at $0.41, NASDAQ:LESL is in a personal buy zone.
Targets into 2027:
$1.00 (+143.9%)
$2.00 (+387.8%)
Cable One | CABO | Long at $130.82Cable One NYSE:CABO is a leading broadband communications provider under the Sparklight brand, offering high-speed internet, cable TV, and phone services across 24 U.S. states.
Book Value: $315.50.
Positive:
Strong liquidity: Quick ratio 1.47 (above industry avg ~1.0).
Undervalued vs. industry (1.91x).
Large customer base: ~1.1M customers, 2.8M data subscribers.
Stable revenue: Broadband focus in non-metropolitan markets.
Insiders buying over $1 million in share recently while also being awarded options.
Recent change in leadership.
Negatives:
Medium-high bankruptcy risk: Altman Z-Score 1.36 (below industry ~2.5).
High leverage: D/E 1.78 (above industry ~1.0).
Weak earnings: Negative margins, declining profitability.
Suspended dividend.
Classify this one as a risky investment, but it is very undervalued at this price and the upcoming decline in interest rates may have a very positive effect on the company's stock (at least short-term: 5 million float, 19% short interest). Regardless, not one to put your life savings into. From a technical analysis perspective, I foresee a potential drop between $115 and $120 in the near-term and rise from there. It all depends on the upcoming earnings, so label this one a "gamble" with high bankruptcy risk.
Regardless of bottom predictions, NYSE:CABO is in a personal buy zone at $130.82 for a swing trade.
Targets into 2027:
$190.00 (+45.2%)
$250.00 (+91.1%)

Alibaba | BABA | Long at $108.84Like Amazon, I suspect AI and robotics will enhance Alibaba's NYSE:BABA e-commerce, logistics, and cloud computing operations. There is some risk here, like other Chinese stocks, that they could be delisted from the US market if trade/war tensions rise. But I just don't think that is likely (no matter the threats) due to the importance of worldwide trade and investment. I could be way wrong, though...
NYSE:BABA has a current P/E of 14.2x and a forward P/E of 2x, which indicates strong earnings growth ahead. The company is very healthy, with a debt-to-equity of 0.2x, Altmans Z Score of 3.3, and a Quick Ratio of 1.5. If this were a US stock, investors would have piled in long ago at the current price.
From a technical analysis perspective, the historical simple moving average (SMA) band has started to reverse trend (now upward), indicating a high potential for continued (overall) price movement up. It is possible, however, that the price may reenter the SMA band in the near-term - the $80s aren't out of the question - as tariff threats arise. But that area is another personal entry zone if fundamentals hold.
Thus, while it could be a bumpy ride and the risk is there for delisting, NYSE:BABA is in a personal buy zone at $108.84 (with known risk of drop to the $80s in the near-term).
Targets into 2028:
$125.00 (+14.8%)
$160.00 (+47.0%)

B&G Foods | BGS | Long at $4.45B&G Foods NYSE:BGS , owner of over 50 food brands including Green Giant, Ortega, Cream of Wheat, Mrs. Dash, and Crisco, has dropped nearly 92% in price since its high in 2021. Currently trading at $4.43 and with a book value of $6.43, NYSE:BGS may have some running room in the next 1-2 years for a forward P/E of 10x (currently negative, so there is anticipated growth, though small). This is another company that would greatly benefit from lowered interest rates due to its high debt-to-equity (4x).
So, while debt and consumer spending declines may pose a threat to NYSE:BGS , I believe it is currently undervalued. If the stock drops due to poor earnings (which could drop to under $2.00), I will be entering another position unless fundamental / outlook truly change.
Thus, at $4.45, NYSE:BGS is in a personal buy zone.
Targets into 2027:
$5.25
$6.25

Diageo | DEO | Long at $101.15Diego NYSE:DEO is the owner of alcohol brands such as Johnnie Walker, Crown Royal, Smirnoff, Baileys, Guinness, Tanqueray, Don Julio, Cîroc, and Captain Morgan. The stock has fallen significantly since 2021 due to several factors, such as: post-COVID recovery slowdown; retail/travel disruptions hurting high-margin segments; inflationary pressures raising costs for materials like glass and agave, squeezing margins; consumer downtrading to cheaper alternatives; and macroeconomic headwinds. While tariffs may prolong overall recovery, I do not think it's the end for this company by any means.
Factors likely to drive NYSE:DEO stock higher include:
Interest Rate Cuts : Expected U.S. rate cuts in 2025 could boost consumer confidence and spending, benefiting premium brands. Lower rates may also reduce debt costs, easing pressure on its debt load.
Productivity Initiatives : NYSE:DEO $2B savings program (2025-2027) aims to improve efficiency, margins, and cash flow, potentially restoring investor confidence.
Undervaluation : Trading at 17.5x forward earnings (below historical 21x), the stock may attract value investors.
From a technical analysis perspective, NYSE:DEO has been riding my "crash" simple moving average zone. While the momentum has a strong downtrend, entry into this "crash" zone typically only happens a few times before a trend reversal. But there is a good probability, that my "major crash" zone (currently in the $80s) is possible before a true reversal. Regardless, without a crystal ball, I am starting to form a position and plan to add more if the "major crash" happens with this stock.
Thus, at $101.15, NYSE:DEO is in a personal buy zone with the noted potential for a drop into the $80s due to projected earnings revisions, etc.
Targets into 2027:
$120.00 (+18.6%)
$140.00 (+38.4%)

Amazing breakout on WEEKLY Timeframe - ACMESOLARCheckout an amazing breakout happened in the stock in Weekly timeframe, macroscopically seen in Daily timeframe. Having a great favor that the stock might be bullish expecting a staggering returns of minimum 25% TGT. IMPORTANT BREAKOUT LEVELS ARE ALWAYS RESPECTED!
NOTE for learners: Place the breakout levels as per the chart shared and track it yourself to get amazed!!
#No complicated chart patterns
#No big big indicators
#No Excel sheet or number magics
TRADE IDEA: WAIT FOR THE STOCK TO BREAKOUT IN WEEKLY TIMEFRAME ABOVE THIS LEVEL.
Checkout an amazing breakout happened in the stock in Weekly timeframe.
Breakouts happening in longer timeframe is way more powerful than the breakouts seen in Daily timeframe. You can blindly invest once the weekly candle closes above the breakout line and stay invested forever. Also these stocks breakouts are lifelong predictions, it means technically these breakouts happen giving more returns in the longer runs. Hence, even when the scrip makes a loss of 10% / 20% / 30% / 50%, the stock will regain and turn around. Once they again enter the same breakout level, they will flyyyyyyyyyyyy like a ROCKET if held in the portfolio in the longer run.
Time makes money, GREEDY & EGO will not make money.
Also, magically these breakouts tend to prove that the companies turn around and fundamentally becoming strong. Also the magic happens when more diversification is done in various sectors under various scripts with equal money invested in each N500 scripts.
The real deal is when to purchase and where to purchase the stock. That is where Breakout study comes into play.
Check this stock which has made an all time low and high chances that it makes a "V" shaped recovery.
> Taking support at last years support or breakout level
> High chances that it reverses from this point.
> Volume dried up badly in last few months / days.
> Very high suspicion based analysis and not based on chart patterns / candle patterns deeply.
> VALUABLE STOCK AVAILABLE AT A DISCOUNTED PRICE
> OPPURTUNITY TO ACCUMULATE ADEQUATE QUANTITY
> MARKET AFTER A CORRECTION / PANIC FALL TO MAKE GOOD INVESTMENT
DISCLAIMER : This is just for educational purpose. This type of analysis is equivalent to catching a falling knife. If you are a warrior, you throw all the knives back else you will be sorrow if it hits SL. Make sure to do your analysis well. This type of analysis only suits high risks investor and whose is willing to throw all the knives above irrespective of any sectoral rotation. BE VERY CAUTIOUS AS IT IS EXTREME BOTTOM FISHING.
HOWEVER, THIS IS HOW MULTIBAGGERS ARE CAUGHT !
STOCK IS AT RIGHT PE / RIGHT EVALUATION / MORE ROAD TO GROW / CORRECTED IV / EXCELLENT BOOKS / USING MARKET CRASH AS AN OPPURTUNITY / EPS AT SKY.
LET'S PUMP IN SOME MONEY AND REVOLUTIONIZE THE NATION'S ECONOMY!

Integra LifeSciences Holdings | IART | Long at $12.39Integra LifeSciences Holdings Corp NASDAQ:IART manufactures and sells surgical instruments, neurosurgical products, and wound care solutions for neurosurgery, neurocritical care, otolaryngology, orthopedics, and general surgery. The stock has fallen over the past few years due to earnings misses / lowered earnings per share guidance, slow revenue growth, and operational challenges / recalls. But the company has been around since 1989 (endured many ups and downs during that time), has over 4,000 employees, a book value near $20 (undervalued), a forward price-to-earnings between 6x-9x (depending on the source), and revenue growth beyond 2025 and into 2028. Debt is slightly high with a debt-to-equity ratio of 1.2x and a quick ratio near 0.8x (company may have difficulty meeting its short-term obligations with its most liquid assets), it is thus a risky play. But the valuation and potential turnaround should get some attention.
From a technical analysis perspective, the stock price has entered and exited my "crash" simple moving average area 3 times now (see green lines). While I think $10 is likely in the near-term, it appears the stock *may* be forming a bottom - especially given the book value is more than 60% from the current price. But, as always, medical device stocks are always a major investment risk, so due diligence is needed.
Thus, at $12.39, NASDAQ:IART is in a buy zone with a note regarding the potential for a dip near $10 before a move up. Targets will be kept low for a swing trade.
Targets:
$15.00 (+21.0%)
$16.50 (+33.2%)

Ironwood Pharmaceuticals | IRWD | Long at $0.61Ironwood Pharma NASDAQ:IRWD stock dropped ~89% in the past year due to disappointing Phase 3 Apraglutide trial results, FDA requiring an additional trial, weak Q1 2025 earnings (-$0.14 EPS vs. -$0.04 expected), high debt ($599.48M), and analyst downgrades. So why would I be interested in swing trading this company? The chart. The price has entered my "crash" simple moving average zone, which often results in a reversal - even if temporary. Also, Linzess (GI drug) revenue is steady, and I thoroughly believe that alone pushes the fair value near $0.95, if not higher. Thus, at $0.61, NASDAQ:IRWD is in a personal buy zone with the potential for additional declines before future rise.
Target:
$0.95 (+55.7%)

Amazing breakout on WEEKLY Timeframe - FORTISCheckout an amazing breakout happened in the stock in Weekly timeframe, macroscopically seen in Daily timeframe. Having a great favor that the stock might be bullish expecting a staggering returns of minimum 25% TGT. IMPORTANT BREAKOUT LEVELS ARE ALWAYS RESPECTED!
NOTE for learners: Place the breakout levels as per the chart shared and track it yourself to get amazed!!
#No complicated chart patterns
#No big big indicators
#No Excel sheet or number magics
TRADE IDEA: WAIT FOR THE STOCK TO BREAKOUT IN WEEKLY TIMEFRAME ABOVE THIS LEVEL.
Checkout an amazing breakout happened in the stock in Weekly timeframe.
Breakouts happening in longer timeframe is way more powerful than the breakouts seen in Daily timeframe. You can blindly invest once the weekly candle closes above the breakout line and stay invested forever. Also these stocks breakouts are lifelong predictions, it means technically these breakouts happen giving more returns in the longer runs. Hence, even when the scrip makes a loss of 10% / 20% / 30% / 50%, the stock will regain and turn around. Once they again enter the same breakout level, they will flyyyyyyyyyyyy like a ROCKET if held in the portfolio in the longer run.
Time makes money, GREEDY & EGO will not make money.
Also, magically these breakouts tend to prove that the companies turn around and fundamentally becoming strong. Also the magic happens when more diversification is done in various sectors under various scripts with equal money invested in each N500 scripts.
The real deal is when to purchase and where to purchase the stock. That is where Breakout study comes into play.
Check this stock which has made an all time low and high chances that it makes a "V" shaped recovery.
> Taking support at last years support or breakout level
> High chances that it reverses from this point.
> Volume dried up badly in last few months / days.
> Very high suspicion based analysis and not based on chart patterns / candle patterns deeply.
> VALUABLE STOCK AVAILABLE AT A DISCOUNTED PRICE
> OPPURTUNITY TO ACCUMULATE ADEQUATE QUANTITY
> MARKET AFTER A CORRECTION / PANIC FALL TO MAKE GOOD INVESTMENT
DISCLAIMER : This is just for educational purpose. This type of analysis is equivalent to catching a falling knife. If you are a warrior, you throw all the knives back else you will be sorrow if it hits SL. Make sure to do your analysis well. This type of analysis only suits high risks investor and whose is willing to throw all the knives above irrespective of any sectoral rotation. BE VERY CAUTIOUS AS IT IS EXTREME BOTTOM FISHING.
HOWEVER, THIS IS HOW MULTIBAGGERS ARE CAUGHT !
STOCK IS AT RIGHT PE / RIGHT EVALUATION / MORE ROAD TO GROW / CORRECTED IV / EXCELLENT BOOKS / USING MARKET CRASH AS AN OPPURTUNITY / EPS AT SKY.
LET'S PUMP IN SOME MONEY AND REVOLUTIONIZE THE NATION'S ECONOMY!

Warren Buffett's Approach to Long-Term Wealth BuildingUnderstanding Value Investing: Warren Buffett's Educational Approach to Long-Term Wealth Building
Learn the educational principles behind value investing and dollar-cost averaging strategies, based on historical market data and Warren Buffett's documented investment philosophy.
---
Introduction: The Million-Dollar Question Every Investor Asks
Warren Buffett—the Oracle of Omaha—has consistently advocated that index fund investing provides a simple, educational approach to long-term wealth building for most investors.
His famous 2007 bet against hedge funds proved this principle in dramatic fashion: Buffett wagered $1 million that a basic S&P 500 index fund would outperform a collection of hedge funds over 10 years. He crushed them. The S&P 500 returned 7.1% annually while the hedge funds averaged just 2.2%.
Today, we'll explore the educational principles behind this approach—examining historical data, mathematical concepts, and implementation strategies for learning purposes.
---
Part 1: Understanding Value Investing for Modern Markets
Value investing isn't about finding the next GameStop or Tesla. It's about buying quality assets at attractive prices and holding them for compound growth .
For beginners, this translates to:
Broad Market Exposure: Own a cross-section of businesses through low-cost index funds
Long-term Perspective: Think decades, not months
Disciplined Approach: Systematic investing regardless of market noise
"Time is the friend of the wonderful business, the enemy of the mediocre." - Warren Buffett
Real-World Application:
Instead of trying to pick between NASDAQ:AAPL , NASDAQ:MSFT , or NASDAQ:GOOGL , you simply buy AMEX:SPY (SPDR S&P 500 ETF) and own pieces of all 500 companies automatically.
---
Part 2: Dollar-Cost Averaging - Your Secret Weapon Against Market Timing
The Problem: Everyone tries to time the market. Studies show that even professional investors get this wrong 70% of the time.
The Solution: Dollar-Cost Averaging (DCA) eliminates timing risk entirely.
How DCA Works:
Decide on your total investment amount (e.g., $24,000)
Split it into equal parts (e.g., 12 months = $2,000/month)
Invest the same amount on the same day each month
Ignore market fluctuations completely
DCA in Action - Real Example:
Let's say you started DCA into AMEX:SPY in January 2022 (right before the bear market):
January 2022: AMEX:SPY at $450 → You buy $1,000 worth (2.22 shares)
June 2022: AMEX:SPY at $380 → You buy $1,000 worth (2.63 shares)
December 2022: AMEX:SPY at $385 → You buy $1,000 worth (2.60 shares)
Result: Your average cost per share was $405, significantly better than the $450 you would have paid with a lump sum in January.
---
Part 3: The Mathematics of Wealth Creation
Here's where value investing gets exciting. Let's run the actual numbers using historical S&P 500 returns:
Historical Performance:
- Average Annual Return: 10.3% (1957-2023)
- Inflation-Adjusted: ~6-7% real returns
- Conservative Estimate: 8% for planning purposes
Scenario 1: The $24K Start
Initial Investment: $24,000 | Annual Addition: $2,400 | Return: 8%
Calculation Summary:
- Initial Investment: $24,000
- Annual Contribution: $2,400 ($200/month)
- Expected Return: 8%
- Time Period: 20 years
Results:
- Year 10 Balance: $86,581
- Year 20 Balance: $221,692
- Total Contributed: $72,000
- Investment Gains: $149,692
Scenario 2: The Aggressive Investor
Initial Investment: $60,000 | Annual Addition: $6,000 | Return: 10%
Historical example after 20 years: $747,300
- Total Contributed: $180,000
- Calculated Investment Gains: $567,300
Educational Insight on Compound Returns:
This historical example illustrates how 2% higher returns (10% vs 8%) could dramatically impact long-term outcomes. This is why even small differences in return rates can create life-changing wealth over decades. The mathematics of compound growth are both simple and incredibly powerful.
---
Part 4: Investing vs. Savings - The Shocking Truth
Let's compare the same contributions invested in stocks vs. a high-yield savings account:
20-Year Comparison:
- Stock Investment (8% return): $221,692
- High-Yield Savings (5% return): $143,037
- Difference: $78,655 (55% more wealth!)
"Compound interest is the eighth wonder of the world. He who understands it, earns it... he who doesn't, pays it." - Often attributed to Einstein
Key Insight: That extra 3% annual return created an additional $78,655 over 20 years. Over 30-40 years, this difference becomes truly life-changing.
📍 Global Savings Reality - The Investment Advantage Worldwide:
The power of index fund investing becomes even more dramatic when we examine savings rates around the world. Here's how the same $24K initial + $2,400 annual investment compares globally:
🇯🇵 Japan (0.5% savings):
- Stock Investment: $221,692
- Savings Account: $76,868
- Advantage: $144,824 (188% more wealth)
🇪🇺 Western Europe Average (3% savings):
- Stock Investment: $221,692
- Savings Account: $107,834
- Advantage: $113,858 (106% more wealth)
🇬🇷 Greece/Southern Europe (2% savings):
- Stock Investment: $221,692
- Savings Account: $93,975
- Advantage: $127,717 (136% more wealth)
🇰🇷 South Korea (2.5% savings):
- Stock Investment: $221,692
- Savings Account: $100,634
- Advantage: $121,058 (120% more wealth)
💡 The Global Lesson:
The lower your country's savings rates, the MORE dramatic the advantage of global index fund investing becomes. For investors in countries with minimal savings returns, staying in cash is essentially guaranteed wealth destruction when compared to broad market investing.
This is exactly why Warren Buffett's advice transcends borders - mathematical principles of compound growth work the same whether you're in New York, London, or Athens.
Note: Savings rates shown are approximate regional averages and may vary by institution and current market conditions. Always check current rates in your specific market for precise calculations.
---
Part 5: Building Your Value Investing Portfolio
Core Holdings (80% of portfolio):
AMEX:SPY - S&P 500 ETF (Large-cap US stocks)
AMEX:VTI - Total Stock Market ETF (Broader US exposure)
LSE:VUAA - S&P 500 UCITS Accumulating (Tax-efficient for international investors)
Satellite Holdings (20% of portfolio):
NASDAQ:QQQ - Technology-focused (Higher growth potential)
AMEX:VYM - Dividend-focused (Income generation)
NYSE:BRK.B - Berkshire Hathaway (Value investing & diversification)
---
Part 6: Implementation Strategy - Your Action Plan
Month 1: Foundation
Open a brokerage account (research low-cost brokers available in your region)
Set up automatic transfers from your bank
Buy your first AMEX:SPY shares
💡 Broker Selection Considerations:
Traditional Brokers: Interactive Brokers, Fidelity, Vanguard, Schwab
Digital Platforms: Revolut, Trading 212, eToro (check availability in your country)
Key Factors: Low fees, ETF access, automatic investing features, regulatory protection
Research: Compare costs and features for your specific location/needs
Month 2-12: Execution
Invest the same amount on the same day each month
Ignore market news and volatility
Track your progress in a simple spreadsheet
Year 2+: Optimization
Increase contributions with salary increases
Consider additional core holdings like LSE:VUAA for tax efficiency
Consider tax-loss harvesting opportunities
Visualizing Your DCA Strategy
Understanding DCA concepts is easier when you can visualize the results. TradingView offers various tools to help you understand investment strategies, including DCA tracking indicators like the DCA Investment Tracker Pro which help visualize long-term investment concepts.
🎯 Key Visualization Features:
These types of tools typically help visualize:
Historical Analysis: How your strategy would have performed using real market data
Growth Projections: Educational scenarios showing potential long-term outcomes
Performance Comparison: Comparing actual vs theoretical DCA performance
Volatility Understanding: How different stocks behave with DCA over time
📊 Real-World Examples from Live Users:
Stable Index Investing Success:
AMEX:SPY (S&P 500) Example: $60K initial + $500/month starting 2020. The indicator shows SPY's historical 10%+ returns, demonstrating how consistent broad market investing builds wealth over time. Notice the smooth theoretical growth line vs actual performance tracking.
Value Investing Approach:
NYSE:BRK.B (Berkshire Hathaway): Warren Buffett's legendary performance through DCA lens. The indicator demonstrates how quality value companies compound wealth over decades. Lower volatility = standard CAGR calculations used.
High-Volatility Stock Management:
NASDAQ:NVDA (NVIDIA): Shows smart volatility detection in action. NVIDIA's explosive AI boom creates extreme years that trigger automatic switch to "Median (High Vol): 50%" calculations for conservative projections, protecting against unrealistic future estimates.
Tech Stock Long-Term Analysis:
NASDAQ:META (Meta Platforms): Despite being a tech stock and experiencing the 2022 crash, META's 10-year history shows consistent enough performance (23.98% CAGR) that volatility detection doesn't trigger. Standard CAGR calculations demonstrate stable long-term growth.
⚡ Educational Application:
When using visualization tools on TradingView:
Select Your Asset: Choose the stock/ETF you want to analyze (like AMEX:SPY )
Input Parameters: Enter your investment amounts and time periods
Study Historical Data: See how your strategy would have performed in real markets
Understand Projections: Learn from educational growth scenarios
🎓 Educational Benefits:
This tool helps you understand:
- How compound growth actually works in real markets
- The difference between volatile and stable investment returns
- Why consistent DCA often outperforms timing strategies
- How your current performance compares to historical market patterns
- The visual power of long-term wealth building
As Warren Buffett said: "Someone's sitting in the shade today because someone planted a tree a long time ago." This tool helps you visualize your financial tree growing over time through actual market data and educational projections.
---
Part 7: Common Mistakes to Avoid
The "Perfect Timing" Trap
Waiting for the "perfect" entry point often means missing years of compound growth. Time in the market beats timing the market.
The "Hot Stock" Temptation
Chasing individual stocks like NASDAQ:NVDA or NASDAQ:TSLA might seem exciting, but it introduces unnecessary risk for beginners.
The "Market Crash" Panic
Every bear market feels like "this time is different." Historical data shows that patient investors who continued their DCA through 2008, 2020, and other crashes were handsomely rewarded.
---
Conclusion: Your Path to Financial Freedom
Value investing through broad index funds and dollar-cost averaging isn't glamorous. You won't get rich overnight, and you won't have exciting stories about your latest trade.
But here's what you will have:
Proven strategy backed by decades of data
Peace of mind during market volatility
Compound growth working in your favor 24/7
A realistic path to serious wealth creation
The Bottom Line: Warren Buffett's approach works because it's simple, sustainable, and based on fundamental economic principles. Start today, stay consistent, and let compound growth do the heavy lifting.
"Someone's sitting in the shade today because someone planted a tree a long time ago." - Warren Buffett
Educational Summary:
Understanding these principles provides a foundation for informed decision-making. As Warren Buffett noted: "The best time to plant a tree was 20 years ago. The second-best time is now" - emphasizing the educational value of understanding long-term investment principles early.
---
🙏 Personal Note & Acknowledgment
This article was not entirely my own work, but the result of artificial intelligence in-depth research and information gathering. I fine-tuned and brought it to my own vision and ideas. While working with AI, I found this research so valuable for myself that I could not avoid sharing it with all of you.
I hope this perspective gives you a different approach to long-term investing. It completely changed my style of thinking and my approach to the markets. As a father of 3 kids, I'm always seeking the best investment strategies for our future. While I was aware of the power of compound interest, I could never truly visualize its actual power.
That's exactly why I also created the open-source DCA Investment Tracker Pro indicator - so everyone can see and visualize the benefits of choosing a long, steady investment approach. Being able to see compound growth in action makes all the difference in staying committed to a strategy.
As someone truly said: compound interest is the 8th wonder of the world.
---
Disclaimer: This article is for educational purposes only and does not constitute financial advice. Past performance does not guarantee future results. Always consult with a qualified financial advisor before making investment decisions.

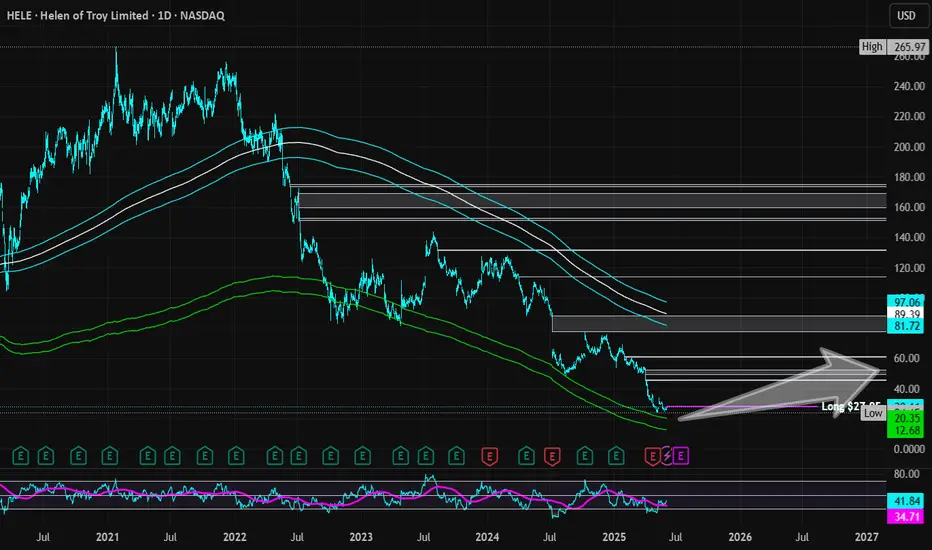
Helen of Troy | HELE | Long at $27.95Helen of Troy NASDAQ:HELE , owner of brands such as OXO, Hydro Flask, Osprey, Vicks, Olive & June, etc, has witnessed an immense decline in share price since its peak in 2021 when it hit just over $265. Now, trading in the $20s... Growth has been a problem for this company (now and future projections) and a major turnaround is needed. However, NASDAQ:HELE is implementing several growth strategies for 2025-2030 under its Elevate for Growth plan and Project Pegasus, so they are very aware of the need to re-inspire investor confidence. They also announced last month the appointment of an interim CEO and CFO. With a 22M float and 12% short interest, this could get interesting.
Excluding the current growth issue, the fundamentals of NASDAQ:HELE are quite strong:
P/E Ratio: 5x (undervalued)
Book Value: ~$70.00 a share (undervalued)
Debt-to-Equity: 0.6x (healthy)
Quick Ratio: Over 1 (healthy)
From a technical analysis perspective, it may have just formed a double-bottom near $24-$25, but a quick drop between $10-$20 is absolutely possible if bad economic news emerges.
At $27.95, NASDAQ:HELE is in a personal buy zone with a caution regarding the US economy and this company's ability to turn things around moving forward.
Targets:
$40.00 (+43.1%)
$52.00 (+86.0%)
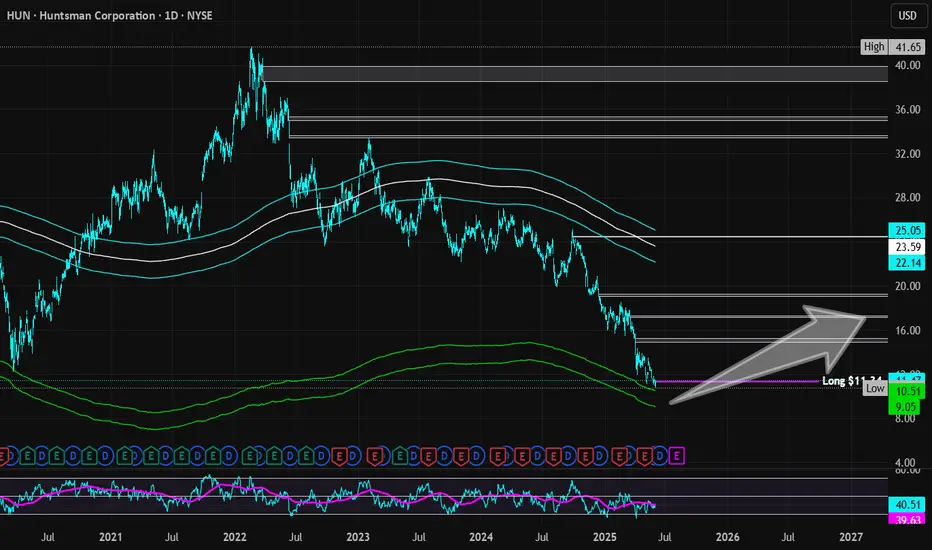
Huntsman Corporation | HUN | Long at $11.34The stock price for Huntsman Corp NYSE:HUN , a manufacturer of organic chemical products, has dropped significantly since its peak in 2022 ($41.65). This was due to lower sales volumes, weak demand in construction and transportation, higher input costs, and European operational challenges, including a $75M hit from closing a German Maleic Anhydride facility. This year (2025) is anticipated to be its worst earnings year, and the stock is priced as such. However, this stock is historically cyclical, and the company expects recovery / growth again in 2026. Moving forward, earnings are forecast to grow and the company is trading at good value compared to peers and the industry. While many headwinds may still exist with tariffs, etc., insider are grabbing shares and large options positions (very bullish). With a book value of $17, debt-to-equity at 0.8x, quick ratio under 1, etc., the company appears healthy.
From a technical analysis perspective, the stock price just barely missed my "crash" simple moving average area (currently between $9.00 and $10.50). It may reach those levels and below in 2025, for which I will add another position as long as fundamentals do not change. This moving average area often signifies "bottom" territory and historically, the stock has rebounded from this area. While my entry at $11.34 may be a little early, predicting true bottoms isn't my trading method and I hope to strengthen the position at lower trading prices.
Targets:
$15.00 (+32.2%)
$17.25 (+49.9%)
Dollar Tree | DLTR | Long at $67.00Dollar Tree NASDAQ:DLTR has taken a massive hit to its stock price as low-income spenders are cutting back (recession red flag, anyone?). It recently touched my selected "crash" simple moving average area (white lines on the chart) and may take many years before true recovery occurs. However, the Director recently bought $150k+ in shares after this recent drop, showing confidence in the company as a whole. I don't think we'll see all-time highs again for some time, but I believe at $67.00 there is a longer-term opportunity into 2026 and beyond. This does not mean I feel the bottom has occurred yet. I wouldn't be surprised if it hits around the $50.00 mark with more bad economic news. No one truly knows. But, I personally choose to position build over time while using charts and fundamental information. At $67.00, NASDAQ:DLTR is in a personal buy zone. If it drops further and fundamentals don't nosedive, more shares will likely be added.
Target #1 = $81.00
Target #2 = $88.00
Target #3 = $94.00

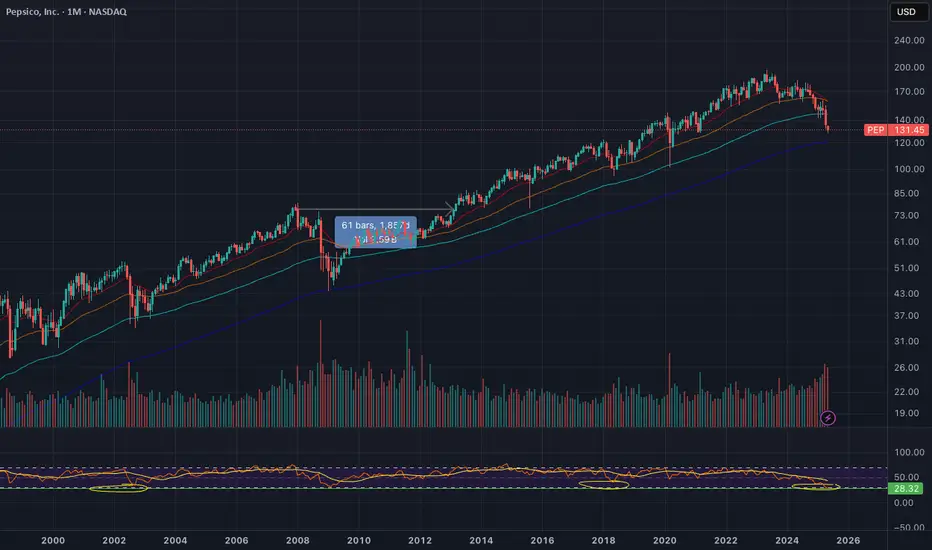
PEP: Long Buy OpportunityPEP is about to touch the 200 Monthly Moving Average. This last 2009.
The RSI is touching less than 30, which last happened in 1973.
PEP is a Dividend King which has increased it's dividend for 53 years. Did Warren Buffett say compounding is the 8th wonder of the world? Oh no, it was Einstein.
Evidence suggests great Long Term BUY opportunity on the price and momentum signals. Compelling.
#PEPSICO (PEP)
Renault’s €2.2 BILLION Loss SHOCKER: Nissan’s Costs Hit Hard!Renault’s €2.2 BILLION Loss SHOCKER 💥: Nissan’s Turnaround Costs Hit Hard! 🚗💸
Imagine Renault and Nissan are like best friends 🤝 who share a big toy car company 🏎️. Renault owns a big piece of Nissan, kind of like having a lot of the toy car's parts 🛠️. But Nissan had a tough year because fewer people bought their cars 📉, especially in places like China 🇨🇳. To fix this, Nissan is making some big changes, like making fewer cars 🚘 and saying goodbye to some workers 👋. These changes cost a lot of money 💰, and because Renault owns part of Nissan, Renault has to share the cost 😓. This means Renault will lose some money this year, about 2.2 billion euros 💶, which is like losing a giant pile of coins! 🪙 But Renault's bosses think these changes will help Nissan make better cars and sell more in the future 🌟, so both friends can be strong again 💪.
Analysis (Up to May 13, 2025):
Renault Group’s announcement of a €2.2 billion hit to its first-quarter earnings 📊 stemming from its 35.71% stake in Nissan reflects the interconnected financial dynamics of their strategic alliance 🤝, as well as broader challenges in the global automotive industry 🌍. Below is an institutional-level analysis of the situation, incorporating the provided data and contextualizing it within the current market environment as of May 13, 2025 🕑.
1. Financial Impact and Impairment Context 📉
Renault’s Exposure to Nissan: Renault’s €2.2 billion earnings hit 💥 is directly tied to Nissan’s reported net loss of approximately $5 billion 📅 for the fiscal year ending March 2025. This loss includes impairments (writing down the value of assets like factories 🏭 or inventory 📦 that are no longer worth as much) and restructuring costs (expenses for layoffs 👥 and factory reductions 🔽). As a 35.71% shareholder, Renault absorbs a proportional share of Nissan’s financial setbacks 📉, which are booked as a negative contribution to Renault’s earnings 💸.
Accounting Implications: The impairments reflect Nissan’s need to adjust the book value of its assets 📜 to align with weaker market performance 📊, particularly in China 🇨🇳, where sales have significantly declined 📉. Restructuring costs are linked to Nissan’s November 2024 announcement of cutting 9,000 jobs 🚫 and reducing global production capacity by 20% 🔧. These measures aim to streamline operations but involve upfront costs 💰, impacting Renault’s financials due to equity accounting rules for its Nissan stake 📈.
Market Reaction: Despite the earnings hit, Renault’s shares rose 1.2% to €48.46 in early trading on the announcement day 📈, suggesting investor confidence in the long-term benefits of Nissan’s turnaround plan 🌟 or optimism about Renault’s core operations 🚗. This resilience may also reflect broader market dynamics, such as stabilizing demand in Europe 🇪🇺 or positive sentiment toward Renault’s electrification strategy ⚡.
2. Nissan’s Turnaround Plan and Strategic Rationale 🔄
Sales Decline: Nissan’s fiscal 2025 sales fell 4.3% to 3.3 million units 📉, driven by weakness in China 🇨🇳, Japan 🇯🇵, and Europe 🇪🇺. China, the world’s largest auto market 🌐, has been a pain point for many global automakers due to intense competition from domestic brands like BYD 🚘 and declining demand for traditional vehicles amid an economic slowdown 📉.
Restructuring Efforts: Nissan’s turnaround plan, announced on April 24, 2025 📅, focuses on cost reduction 💸 and operational efficiency 🔧.
The 9,000 job cuts 🚫 and 20% reduction in production capacity 🔽 signal a shift toward leaner operations, prioritizing high-margin markets and products 📈. This aligns with industry trends, as automakers globally face pressure to adapt to lower demand for internal combustion engine vehicles 🚗 and invest heavily in electric vehicles (EVs) ⚡.
China Strategy: Nissan’s weak performance in China 🇨🇳 underscores the need for a revised market approach 🔄, potentially involving localized EV models ⚡ or partnerships to compete with dominant players 🏆. The impairments likely include devaluing assets tied to underperforming Chinese operations, such as factories 🏭 or unsold inventory 📦.
3. Renault-Nissan Alliance Dynamics 🤝
Historical Context: The Renault-Nissan-Mitsubishi Alliance, formed in 1999 🗓️, has been a cornerstone of both companies’ global strategies 🌍, enabling shared R&D 🧠, platforms, and cost efficiencies 💰. Renault’s significant stake in Nissan ties their financial fates closely 💸, but recent years have seen tensions 😬, including governance issues and strategic divergences, particularly after the 2018 Carlos Ghosn scandal 🚨.
Mutual Dependence: While Nissan’s challenges weigh on Renault ⚖️, the alliance remains critical for both. Renault benefits from Nissan’s scale in markets like North America 🇺🇸 and Asia 🌏, while Nissan leverages Renault’s expertise in Europe 🇪🇺 and EV technology ⚡ (e.g., Renault’s success with models like the Megane E-Tech 🚗).
The €2.2 billion hit 💥 underscores the risks of this interdependence but also highlights Renault’s commitment to supporting Nissan’s recovery 🌟, likely viewing it as essential for the alliance’s long-term viability 📅.
Potential Risks: If Nissan’s turnaround falters 🚫, Renault could face further financial strain 😓, including additional impairments 📉 or pressure to dilute its stake. Conversely, a successful restructuring could strengthen the alliance 💪, boosting shared EV development ⚡ and cost synergies 💸.
4. Industry and Macro Context (Up to May 13, 2025) 🌍
Global Auto Industry: The automotive sector faces a complex transition in 2025 🔄, balancing the shift to EVs ⚡, supply chain disruptions 🚚, and regional demand variations 📊. European automakers like Renault are under pressure to meet stringent EU emissions targets 🌿, while Japanese firms like Nissan grapple with declining relevance in markets like China 🇨🇳, where EV adoption is accelerating ⚡.
China’s Role: China’s market challenges are systemic 🌐, with global automakers losing share to local brands 🚗. Nissan’s sales drop 📉 reflects this trend, and Renault’s indirect exposure via Nissan amplifies its vulnerability to China’s slowdown 😓.
EV Transition: Both Renault and Nissan are investing in electrification ⚡, but Nissan’s restructuring may delay its EV rollout 📅, potentially ceding ground to competitors 🏆. Renault, with its stronger EV portfolio in Europe 🇪🇺, may need to lead alliance efforts in this area 🚗.
Macro Factors: Rising interest rates 📈, inflation 📊, and geopolitical uncertainties 🌍 (e.g., trade tensions) continue to impact consumer demand and production costs 💰. These factors likely exacerbate Nissan’s sales declines 📉 and Renault’s financial hit 💸.
5. Long-Term Outlook (4-10 Year Horizon) 🔮
Nissan’s Recovery Potential: If Nissan’s restructuring succeeds ✅, it could emerge leaner and more competitive by 2029 📅, with a focus on high-growth segments like EVs ⚡ and markets like North America 🇺🇸. This would benefit Renault through improved equity income and alliance synergies 🤝.
Renault’s Strategy: Renault is likely to prioritize its European operations 🇪🇺 and EV leadership ⚡ while supporting Nissan’s recovery 🌟. Divesting its Nissan stake seems unlikely in the near term 🚫, given the strategic importance of the alliance, but Renault may seek to diversify its portfolio to mitigate risks 🛡️.
Alliance Evolution: Over the next 4-10 years 📅, the Renault-Nissan-Mitsubishi Alliance could deepen integration in EV platforms ⚡ and autonomous driving 🤖 or face pressure to restructure if financial strains persist 😓. External partnerships (e.g., with Chinese firms for Nissan 🇨🇳) or mergers could reshape the alliance’s structure 🔄.
Risks to Monitor: Key risks include prolonged weakness in China 🇨🇳, failure to execute EV strategies 🚫, and macroeconomic volatility 🌍. Regulatory changes, such as stricter emissions rules 🌿 or trade barriers 🚧, could further complicate the alliance’s plans 📜.
Conclusion 🎯
Renault’s €2.2 billion earnings hit 💥 reflects the immediate financial burden of Nissan’s restructuring and market challenges, particularly in China 🇨🇳. However, the institutional perspective sees this as a strategic investment in Nissan’s long-term recovery 🌟, critical for the Renault-Nissan-Mitsubishi Alliance’s competitiveness in a rapidly evolving industry 🚗. For a 4 to 10 year old, it’s like Renault helping a struggling friend fix their toy car 🛠️, taking a short-term loss 💸 to ensure both can play better in the future 🎉. Over the next 4-10 years 📅, the success of Nissan’s turnaround and the alliance’s ability to navigate the EV transition ⚡ will determine whether this hit becomes a stepping stone 🪜 or a recurring burden ⚖️.

Acadia Healthcare Company | ACHC | Long at $21.98Acadia Healthcare's NASDAQ:ACHC stock has fallen nearly -76% in a year, primarily due to weak 2024 results, missed revenue and EPS expectations, and a soft 2025 revenue guidance. Ongoing federal investigations into billing practices and lawsuits have further eroded investor confidence. However, it is currently trading at a price-to-earnings ratio of 7.42x and earnings are forecast to grow 7.07% per year. The profitable company is trading at a good value compared to other healthcare companies. Debt-to-equity is relatively low (0.64x), but legal risks (DOJ probe, lawsuits) strain margins.
The stock has entered my "major crash" simple moving average territory and there is a lot of downward / selling pressure. But, more often than not, this area (which... I caution... still extends down near $16) can often signal a temporary or longer-term bottom. Personally, this is a buy area ($16-$21) even if it turns into a short-term bounce in 2025. But I believe the overall market moves in the S&P 500, etc. will guide this stock more than anything at this point (unless more bad news about the company emerges).
One thing to note is that there are open price gaps on the daily chart near $17, $10, and $8. These gaps, which often (but not always) get closed in the lifetime of a stock, are a potential signal for further declines - at least at some point. There could be a drop near $16, then a $10-$20 bullish price increase after that, followed by more declines (trapping investors). Time will tell, but NASDAQ:ACHC is currently attractively valued. From a technical analysis standpoint, it is in a personal "buy zone", even if purely for a swing trade.
Targets:
$27.00
$33.00
$39.00

Undervalued, Oversold, Overlooked: MRK Hits The Key Zone!Hi all,
Merck & Co. (MRK) is a global pharmaceutical titan and is currently trading near its 52-week low of ~$79. Anchored by Keytruda’s 7% YoY revenue growth, a stable ~4% dividend yield, and an average fair value estimate of $156.59 (98% upside), MRK appears significantly undervalued.
Analysts forecast a 12-month price target of $118.05, implying 49% upside, supported by a strong pipeline and solid financials. While tariff concerns and Keytruda’s 2028 patent expiration pose risks.
Technically speaking, MRK has fallen 43% from its all-time high and has reached the strongest area on the chart—a key support zone offering a compelling opportunity to build mid- or long-term positions. This critical area is defined by multiple technical factors, creating a high-probability setup for a potential reversal:
Role Reversal Support: A broad, well-established resistance zone, aged like fine wine, has now flipped to act as support. This classic role reversal provides significant confluence to the setup.
Textbook Trendline: A perfectly respected trendline, straight out of technical analysis textbooks, has consistently held. The price has approached this trendline from higher highs, underscoring its strength as a key support level.
50% Retracement Level: A critical level often watched for potential reversals.
Monthly EMA200 Confluence: The 200-period exponential moving average on the monthly chart adds further strength to this area, reinforcing its technical significance.
Strategic Guidance:
This setup requires strong conviction. If you’re not prepared to buy in the lower gray areas of this support zone (marked on the chart), do not initiate a position.
In today’s market sentiment, your fundamental research must be robust, and technical analysis allows you to get that much confidence to make it happen!
Ask yourself: If the price falls further into the gray zones, am I willing to buy more? If your answer is yes, the current price presents a strong entry point for mid- to long-term positions.
If the answer is no—if you’re unsure about buying at lower levels or find yourself questioning what to do if prices drop further—refrain from starting a position. In volatile markets, clarity and discipline are essential. Only enter if your strategy is clear and your conviction matches the opportunity!
Good luck,
Vaido

DOW Inc | DOW | Long at $27.59NYSE:DOW Inc is a strong company with good fundamentals currently trading at a good value (it just may take time for the value to truly show).
P/E = 18x
Dividend Yield = 7.74%
Price/Cahs Flow = 6.9x
Debt/Equity = 0.94x
Price/Book = 1.14x
Insiders buying and awarded options
Thus, at $27.59, NYSE:DOW is in a personal buy zone.
Targets:
$34.00
$40.00
$44.00

I find value here on MSFTMSFT recently retraced back to $380, fueled by headlines about Trump's tariffs. However, I find this retracement an overreaction. According to my calculations, MSFT is fairly valued now. Take this chance to add it to your portfolio today.
