VANAUSDT Forming Falling WedgeVANAUSDT is currently trading within a classic falling wedge pattern, a bullish structure known for its potential to produce explosive upside breakouts. This pattern indicates that bearish momentum is losing steam while buyers are gradually stepping in. The narrowing of the price range combined with good volume suggests a breakout could be on the horizon. The falling wedge has historically marked the bottoming phases of many altcoins before massive surges, and VANAUSDT appears poised for a similar scenario.
With an expected gain of 140% to 150%+, VANAUSDT presents an attractive setup for swing traders and mid-term investors. The chart structure implies that once the resistance of the wedge is broken, the move could be rapid and substantial. Many traders are watching this zone closely, waiting for confirmation of breakout volume and bullish candle formations to signal entry. As momentum builds across the altcoin space, lower-cap tokens like VANA can experience sharp rallies once technical barriers are cleared.
There is growing interest from investors in this project due to its unique fundamentals and technical outlook. With broader market sentiment shifting back to bullish and many tokens breaking out from similar setups, VANA could ride this wave to significant new highs. Furthermore, social media buzz and community engagement around this token are steadily increasing, which could further fuel the upside.
✅ Show your support by hitting the like button and
✅ Leaving a comment below! (What is You opinion about this Coin)
Your feedback and engagement keep me inspired to share more insightful market analysis with you!
VANAUSDT

vanausdtthis altcoin is very strong in fall down btc
its in accumulation phase
buy and hold
when it want go to the moon?! when you sell it :D
#VANA/USDT#VANA
The price is moving within a descending channel on the 1-hour frame, adhering well to it, and is heading for a strong breakout and retest.
We are seeing a bounce from the lower boundary of the descending channel, which is support at 6.52.
We are seeing a downtrend on the RSI indicator that is about to break and retest, supporting the upward trend.
We are looking for stability above the 100 Moving Average.
Entry price: 6.75
First target: 6.98
Second target: 7.24
Third target: 7.52

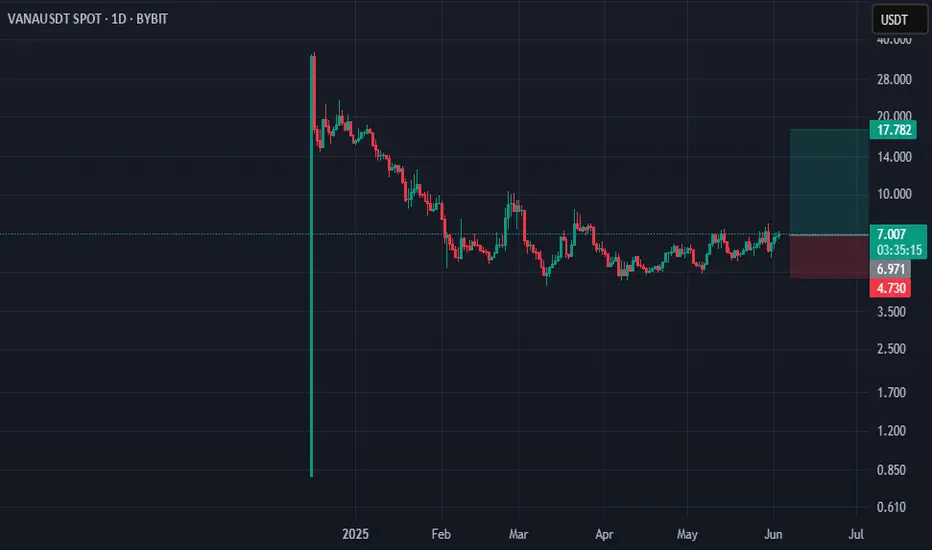
VANAUSDT 1D AnalysisVANA ~ 1D Analysis
#VANA Looks familiar, like an accumulation area where whales are doing it. Buy gradually with a short term target of at least 15%+ from here.

Vana, Easy Short-Term 180% Target—Profits vs Greed—350% NextI am giving you this one as a short-term chart setup. Vana has been rising since mid-March and I sense this chart becoming stronger by the day. The fact that the action is still happening at bottom prices after months of sideways is also good. This means that the breakout will be a surprise and super strong. Our target can hit within days once resistance break.
Something like more slowly rising challenging upper resistance. Once this break, a huge big candle with 50-60% green. Then another one and another one until the market settles within the bullish zone. After the initial burst, a small retrace followed by long-term growth.
This trading is so easy it should be illegal. All that is needed is to buy and hold. The market takes care of the rest.
Profits can come in a week's time, just as it can come within several months; it doesn't matter, we wait. Better to have sure certain profits playing wisely the market, than losing everything out of greed and with high lev.
A win is always more profitable than a loss, no matter what our ego says. Our ego will say, "If it is going up anyways, why not go all-in with 10X?" When this reasoning takes over, the market is about to turn.
The truth is that nothing is certain and since the bots can adapt live, when too many people go into the same reasoning, then no more growth, the market needs to remove all this greed before moving ahead.
For us, the thinking goes something like this, "If I can make money easy with 100% certainty, why take such a huge risk?" "I can simply hold and wait. I rather make $10,000 safe and secure, than lose $2,000 thinking of earning the same day."
The thinking goes like this, "The truth is that I've been tempted before, my ego tends to lie and instead of a win, I end up with a major loss. I will be patient, I trust Master Ananda and his winning strategy through buy and hold."
The market can end up moving faster than before.
We are in June 2025. There isn't much time left. We are going to be bullish for months and months and months. The retraces, the corrections, the consolidation... It is all over, we are going up.
Namaste.

Vana 1111% Potential? Consolidation Continues (Trading Strategy)Consolidation as in bullish consolidation because prices have been moving up for months, the bottom was hit mid-March.
Good evening my fellow Cryptocurrency trader, I hope you are having everything that you wish to have in this moment in this time in this life.
I hope you are having a beautiful week and a wonderful day.
How are you feeling?
Good, let's just focus on the chart, ok?
The best time is now to trade.
To trade or not to trade. What does it mean to trade?
What is trading all about?
Trading is a money making job but not everybody who is trading is working. Sometimes we are drawn to the market as if by a magnet and we end up playing, or should I say "trading" but there is actual no trading involved.
Trading is an exchange, we are not exchanging anything other than clicks and numbers on a screen. Does it count as trading? Well, clicks and numbers, if these are being exchanged then it is still trading.
We are exchanging virtual currencies so yes, we are trading and we can win.
VANAUSDT. We've been on a mix between investing and trading; get your mind right!
Are you in it long-term or short-term?
It can make all the difference knowing where you stand.
If you say you will decide on the go, here is what always happens: When the time to tell is right, you say "I am holding/trading long-term." If the time to sell is wrong, prices will continue going up you say, "I am securing profits, this is a short-term trade."
For this reason, it is better to plan ahead.
Just plan ahead and, when you secure profits and prices keep on growing, it doesn't matter, you secured a winning trade.
When you secure profits and prices drop, it doesn't matter either, you just did what you said you were going to do before you bought.
Plan before buying.
Thanks a lot for your continued support.
Namaste.

$VANA/USDT BREAKOUT ALERT🚨 BREAKOUT ALERT $VANA/USDT 🚨
After months of grinding in a sideways market, BME:VANA has finally broken out with strong momentum! 270% upside potential from the breakout zone is now on the table!
📈 Accumulation done. Expansion phase activated.
Are you riding this wave?
DYRO, NFA

Vana Will Grow Because I Say So... (Vana Or Banana?)It is a young chart, but the chart is so simple and easy that it cannot be ignored.
When we a look at a chart what are we looking for? Mainly bullish potential. A chart that looks ready to grow. A chart that says the bearish wave is over and a new bullish wave will start.
For this reason, VANAUSDT is easy.
There are no strong bullish signals. Basically there are no signals at all, but, we have price action.
VANAUSDT was in a descending trend and then goes sideways. So now we have information. We know the bearish action is over because we no longer have lower lows and lower highs. We know consolidation is happening because prices are sideways. We know soon there will be change because volume continues to drop. So, if the downtrend is over and the market enters a sideways range, we can assume that a bullish trend/wave/phase will develop next.
We can only make this assumption because we have an understanding of market cycles and keep an eye on the rest of the market. If we were unfamiliar with Cryptocurrencies are were looking at this chart in isolation we would not be able to make this assumption in a valid way. We would be able to make it but it would be a wild guess rather than an educated guess.
We know the market will grow.
We know Bitcoin is growing and we know some Altcoins are growing even three digits green in a single day. This never happens in a bear market and this happens only at the start of a new bullish phase.
We also know that the Altcoins that are breaking bullish and moving up strongly went through exactly the same pattern as VANAUSDT. They were going down and stopped going down and went sideways, from sideways turned green.
That's how I know that VANA will grow.
Thanks a lot for your continued support.
Namaste.

VANAUSDT Prepares for Bullish MoveVANUSDT Technical analsysis update
VANA has been forming a symmetrical triangle pattern over the past 90 days on the daily chart. A bullish move is expected once a breakout occurs. Additionally, a bullish MACD crossover happened a few days ago. Let's wait for a breakout above the triangle resistance for bullish confirmation.

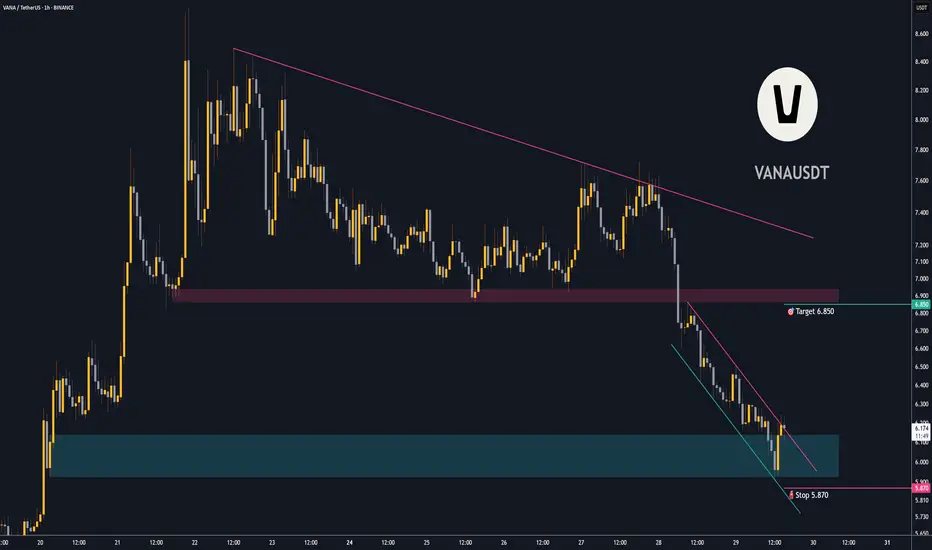
Trading opportunity for VANAUSDTBased on technical factors there is a Buy position in :
📊 VANAUSDT
🔵 Buy Now
🪫Stop loss 5.870
🔋Target 6.850
📏 R/R 2
💸RISK : 1%
We hope it is profitable for you ❤️
Please support our activity with your likes👍 and comments📝
VANAUSDT – Smart Money Knows Where to BuyThe blue boxes are not just random levels; they are where the market has shown significant interest before. Smart traders don’t chase, they wait. If price holds and we see confirmation—CDV support, volume buildup, and a proper low-timeframe breakout—this could be a prime opportunity.
📌 What’s the Plan?
✅ Patience is key – No need to jump in blindly. We react, not predict.
✅ Confirmation is everything – If price respects the support and builds strength, that’s where we take action.
✅ If it breaks, we adjust – No emotional attachment, just clean execution.
This is where the difference between winning traders and the crowd is made. You either wait for the right conditions or you become exit liquidity. Choose wisely.
📌I keep my charts clean and simple because I believe clarity leads to better decisions.
📌My approach is built on years of experience and a solid track record. I don’t claim to know it all but I’m confident in my ability to spot high-probability setups.
📌If you would like to learn how to use the heatmap, cumulative volume delta and volume footprint techniques that I use below to determine very accurate demand regions, you can send me a private message. I help anyone who wants it completely free of charge.
🔑I have a long list of my proven technique below:
🎯 ZENUSDT.P: Patience & Profitability | %230 Reaction from the Sniper Entry
🐶 DOGEUSDT.P: Next Move
🎨 RENDERUSDT.P: Opportunity of the Month
💎 ETHUSDT.P: Where to Retrace
🟢 BNBUSDT.P: Potential Surge
📊 BTC Dominance: Reaction Zone
🌊 WAVESUSDT.P: Demand Zone Potential
🟣 UNIUSDT.P: Long-Term Trade
🔵 XRPUSDT.P: Entry Zones
🔗 LINKUSDT.P: Follow The River
📈 BTCUSDT.P: Two Key Demand Zones
🟩 POLUSDT: Bullish Momentum
🌟 PENDLEUSDT.P: Where Opportunity Meets Precision
🔥 BTCUSDT.P: Liquidation of Highly Leveraged Longs
🌊 SOLUSDT.P: SOL's Dip - Your Opportunity
🐸 1000PEPEUSDT.P: Prime Bounce Zone Unlocked
🚀 ETHUSDT.P: Set to Explode - Don't Miss This Game Changer
🤖 IQUSDT: Smart Plan
⚡️ PONDUSDT: A Trade Not Taken Is Better Than a Losing One
💼 STMXUSDT: 2 Buying Areas
🐢 TURBOUSDT: Buy Zones and Buyer Presence
🌍 ICPUSDT.P: Massive Upside Potential | Check the Trade Update For Seeing Results
🟠 IDEXUSDT: Spot Buy Area | %26 Profit if You Trade with MSB
📌 USUALUSDT: Buyers Are Active + %70 Profit in Total
🌟 FORTHUSDT: Sniper Entry +%26 Reaction
🐳 QKCUSDT: Sniper Entry +%57 Reaction
📊 BTC.D: Retest of Key Area Highly Likely
📊 XNOUSDT %80 Reaction with a Simple Blue Box!
📊 BELUSDT Amazing %120 Reaction!
I stopped adding to the list because it's kinda tiring to add 5-10 charts in every move but you can check my profile and see that it goes on..
#VANAUSDT is forming a confident bounce from key levels📉 LONG BYBIT:VANAUSDT.P from $8.180
🛡 Stop loss $8.000
1H timeframe
❗️Before entering the trade, closely monitor the levels. If the price consolidates above $8.180 with volume, this confirms the entry signal.
✅ Overview BYBIT:VANAUSDT.P :
➡️ On the chart, we can see that after a downward movement, the price formed a local bottom around $8.000, followed by an upward impulse.
➡️ A structure resembling a reversal pattern has appeared: the price broke through a slanted resistance (blue line) and consolidated above $8.180, indicating weakening sellers.
➡️ The price is now moving toward a resistance zone marked as POC (Point of Control) at $8.353, which could be the first target.
➡️ The entry is set at $8.180, aligning with the breakout level, supported by increasing volume and a short-term uptrend.
The volume profile on the left shows a low-liquidity zone above the current price (between $8.345 and $8.590), which may allow the price to quickly reach the TP levels.
🎯 TP Targets:
💎 TP 1: $8.345
💎 TP 2: $8.590
💎 TP 3: $8.775
⚡️ Plan:
➡️ Monitor the price reaction at TP1 ($8.345) — a pullback is possible. It’s recommended to close part of the position.
➡️ Wait for confirmation of the breakout above $8.180 (already happened, price is above).
➡️ Enter LONG after a retest (with volume) — in this case, the retest has already occurred, and the price is moving up.
➡️ Place the stop below the last low — at $8.000.
BYBIT:VANAUSDT.P is forming a confident bounce from key levels, and if it holds above the entry zone, we expect an upward movement!

HMSTRUSDT UPDATEHMStrUSDT is a cryptocurrency trading at $0.0017. Its target price is $0.0023, indicating a potential 30%+ gain. The pattern is a Falling Wedge, a reversal pattern signaling a trend change. This pattern suggests the downward trend may be ending. A breakout from the wedge could lead to a strong upward move. The Falling Wedge is a positive signal, indicating a potential price surge. Investors are optimistic about HMStrUSDT's future performance. The current price may be a buying opportunity. Reaching the target price would result in significant returns. HMStrUSDT is poised for a potential breakout and substantial gains.

VANAUSDT(VANA) Updated till 24-02-25VANAUSDT(VANA) Daily timeframe range. PA found its local low at 5.377, below that is trouble zone. now its trying to break above 8.542 which is more optimal here. we can only see relief rally if it stays above 8.542. alltho it got long way to go.

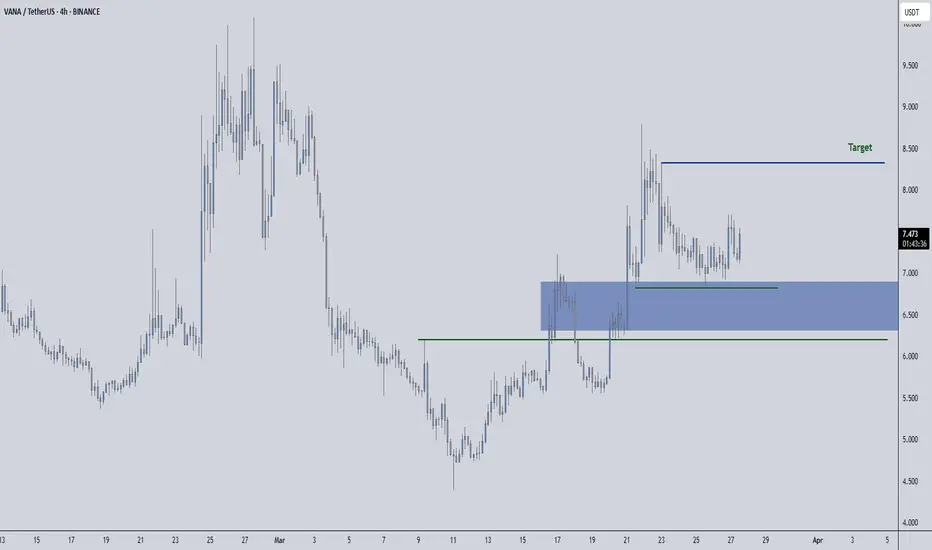
VANAUSDT 4HVANA ~ 4H
#VANA If you have Conviction on the coin,. Buy at this support block, or buy after breaking this resistance line,. Minimum target 15%++

vanaI always wait for these kinds of currencies in the lower areas. Sometimes they arrive, sometimes they don't. For now, keeping the green box, maybe he'll touch the red numbers above in the first step.

VANA - Strong Breakout#VANA/USDT #Analysis
Description
---------------------------------------------------------------
+ VANA has successfully broken out from the resistance zone
+ We see strong bullish candles with decent volumes. I'm expecting this bullish momentum to hold.
+ I see a good trade opportunity here, i'm entering a small position here.
Entry: 22.2
SL: 18.2
TPs: 24, 26, 30, 33
---------------------------------------------------------------
Enhance, Trade, Grow
---------------------------------------------------------------
Feel free to share your thoughts and insights. Don't forget to like and follow us for more trading ideas and discussions.
Best Regards,
VectorAlgo
