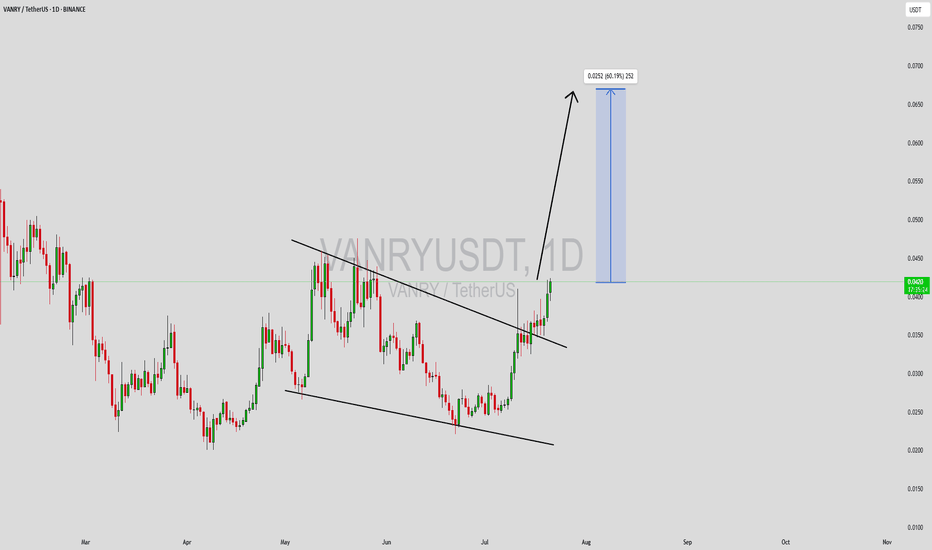
VANRYUSDT Forming Potential BreakoutVANRYUSDT is currently showing a potential breakout pattern, making it one of the more exciting altcoins to keep an eye on in the short term. The price structure has tightened in recent sessions, often a precursor to explosive movement. With strong volume backing the recent price action, the possibility of an upward breakout becomes increasingly likely. Based on the technical setup and broader sentiment, an expected gain of 50% to 60%+ could be achievable in the coming weeks if momentum sustains.
Vanar Chain (VANRY) is beginning to catch the attention of investors due to its innovative blockchain infrastructure and expanding ecosystem. As the project builds utility and demonstrates consistent development, interest from both retail and strategic backers is on the rise. This growing traction is contributing to the observed increase in trading activity, further fueling the potential breakout scenario from a technical standpoint.
The current chart suggests price consolidation near a key resistance level, which, once breached, could trigger a significant upward push. Traders watching this setup may consider entering upon confirmation of the breakout with volume, targeting higher levels based on recent price history and measured move projections. This makes VANRYUSDT an attractive play for breakout traders and momentum investors.
✅ Show your support by hitting the like button and
✅ Leaving a comment below! (What is You opinion about this Coin)
Your feedback and engagement keep me inspired to share more insightful market analysis with you!
VANRYBTC
#VANRY/USDT#VANRY
The price is moving in a descending channel on the 1-hour frame and is expected to continue upwards
We have a trend to stabilize above the moving average 100 again
We have a descending trend on the RSI indicator that supports the rise by breaking it upwards
We have a support area at the lower limit of the channel at a price of 0.0374
Entry price 0.0381
First target 0.0397
Second target 0.0412
Third target 0.0427
VANRY looks bullish (1D)VANRY correction has started from the place where we have placed the red arrow on the chart.
This correction looks like a diametric as we are now at the end of the G wave.
We have identified two entry points for VANRY.
The targets are also marked on the chart.
Closing a daily candle below the invalidation level will violate this analysis.
For risk management, please don't forget stop loss and capital management
Comment if you have any questions
Thank You
#Vanry/USDT Ready to go up#Vanry
The price is moving in a descending channel on the 1-hour frame and sticking to it well
We have a bounce from the lower limit of the descending channel, this support is at 0.07342
We have a downtrend, the RSI indicator is about to break, which supports the rise
We have a trend to stabilize above the moving average 100
Entry price 0.0920
First target 0.0980
Second target 0.1056
Third target 0.1146
#VANRY (SPOT) entry range (0.082 - 0.097) T.(0.2149) SL (0.0802)entry range (0.082 - 0.097)
Target (0.2149)
SL .4H close below (0.0802)
*** Breakout and retest is done *****
************************************
#VANRY
#VANRYUSDT
#VANRYUSD
BINANCE:VANRYUSDT
#swingtrade
#shortterminvestment
#ALTCOIN
#Cryptotading
#cryptoinvesting
#investment
##trading
#cryptocurrencytrading
#bitcoininvestments
#Investing_Coins
#Investingcoins
#Crypto_investing
#Cryptoinvesting
**** #Manta ,#OMNI, #DYM, #AI, #IO, #XAI , #ACE #NFP #RAD #WLD #ORDI #BLUR #SUI #Voxel #AEVO #VITE #APE #RDNT #FLUX #NMR #VANRY ****
#bitcoin
#BTC
#BTCUSDT
#VANRY Next Move ComingThe chart is of VANRY/USDT on the 8-hour timeframe. Here's the breakdown:
Current Price: 0.10534 USDT
Support Levels:
The price has previously found support around 0.07909 USDT.
Resistance Levels:
The chart shows a resistance target at 0.12804 USDT, marked by the green horizontal line.
Trend Lines:
A descending blue trend line acts as a resistance, and the price is currently hovering near it.
There's also a rising trend line from the recent lows, which the price is close to testing.
Indicators:
RSI (Relative Strength Index): Currently around 46.46, suggesting a neutral market, with neither overbought nor oversold conditions.
MACD (Moving Average Convergence Divergence): Shows slight bearish divergence with the MACD line (blue) crossing below the signal line (orange), indicating potential bearish momentum in the short term.
Target:
0.12804 USDT is the immediate target if the price breaks the current descending resistance and shows upward momentum.
Vanry Usdt Technical Analysis The VANRY/USDT pair is trading at a key support zone (Green) between $0.1333 and $0.1398, which has proven to be a strong area from which the price could bounce.
If the price successfully flips the immediate resistance level at $0.1569, it may go towards the descending trend line, which might act as a powerful barrier to further upward movement.
After a strong breakout from the trend line, there is a major resistance zone (blue) between $0.2399 and $0.2530; by flipping this blue zone, we might see the vanry price reach new highs.
The descending trendline from the March 2024 highs continues to exert downward pressure, showing that bearish forces are still strong.
To predict future movements, traders should look for important price levels and volume spikes, which indicate the strength of any breakthrough or breakdown.
If the price fails to hold the Green zone and breaks down from here, it may fall to the next support level at $0.0993, with further drops potentially revisits the last zone highlighted in Yellow on the chart at $0.0769 - $0.0812.
Remember to always use a stop loss to protect your capital.
Everything is on the chart.
VANRY ANALYSIS (4H)From the place where we put a red arrow on the chart, it seems that the VANRY correction has started.
It looks like we have an ABC or a more complicated pattern.
Wave B is a triangle that we are now at the end of this triangle.
It is expected that the bell will drop down by keeping the red frame.
Closing a daily candle above the invalidation level will violate the analysis.
For risk management, please don't forget stop loss and capital management
Comment if you have any questions
Thank You


