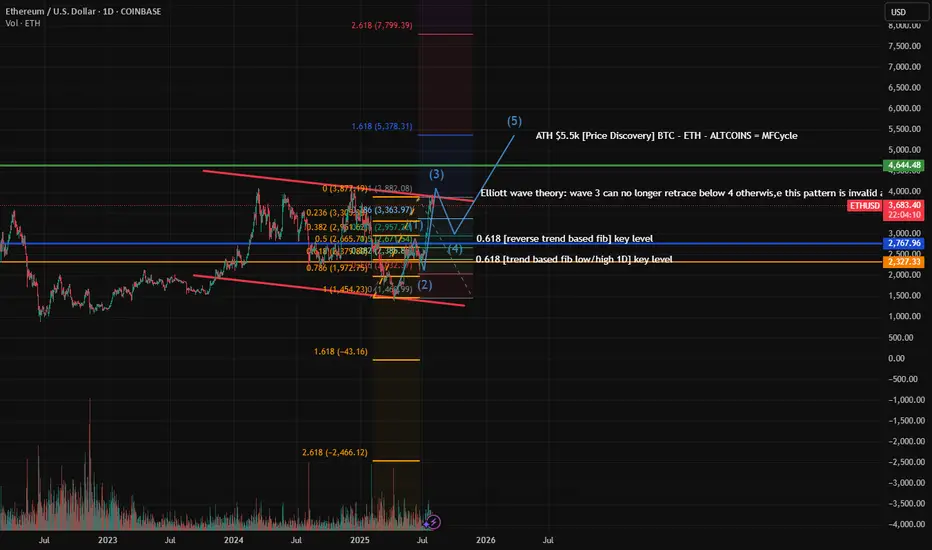
ETH in a 1-5 patternEverythings is labeled on the chart of my theory and where I predict if this theory is valid following BTC's ATH and the Money Flow Cycle.
Vechain
VeChain Low Prices Accumulation Opportunity Reaching Its EndVeChain. We have higher lows since June 2023 and yet, VETUSDT is still trading at bottom prices. Don't get me wrong, this is great. This only means that the pair is strong and yet there is still time to buy within a rising accumulation zone.
I am using the linear chart so we can get the full picture. After June 2022, the candles become very small. This is the consolidation period. Even when the market starts to produce higher lows and higher highs after June 2023 this is still bottom prices action. What do I mean? Just compare the size of the 2021 bull market bullish wave with the past 3 years. That is what I mean.
What will happen now is the 2025 bull market bullish wave. A wave similar in size to what we saw in 2021 but with the end result being much higher prices, very likely a new all-time high.
First the action is very slow, almost neutral as you are seeing now. The small jump from April-May, less than 80%. Then watch... Out of nowhere, Boom!, 200-300% just to start. The 200-300% bullish breakout is never the end, this would be just the start of the major 2025 bull market wave. Then it goes on and on and on... Sustained long-term growth. The end result can be 15X, 20X, 30X or more. Too early to say, but prices won't remain low for too long. This is your last chance to accumulate VeChain before a major bullish run.
Namaste.

TradeCityPro | VET Battles Key Resistance Amid Buyer Momentum👋 Welcome to TradeCity Pro!
In this analysis, I’m going to review the VET coin for you. VET is a Layer1 and RWA project with a market cap of 1.84 billion dollars, currently ranked 44 on CoinMarketCap.
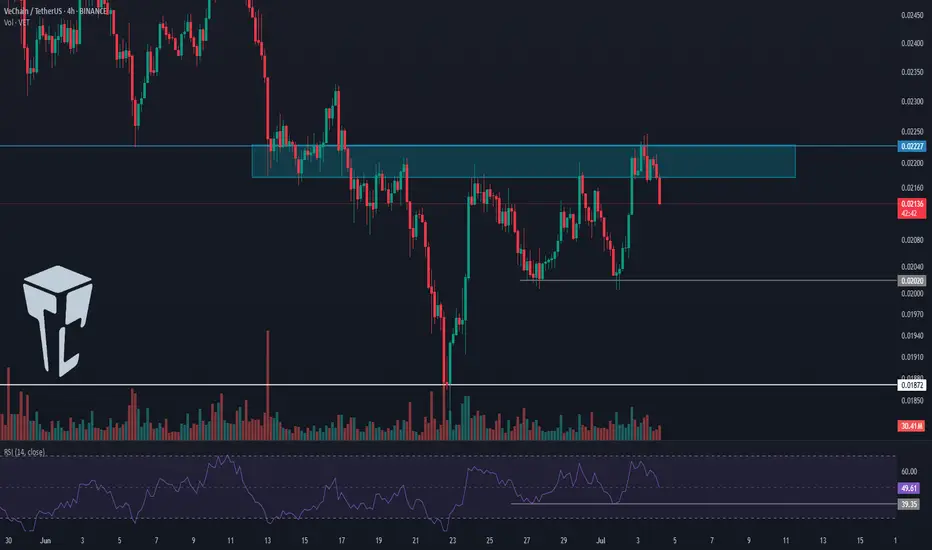
⏳ 4-Hour Timeframe
On the 4-hour timeframe, as you can see, this coin experienced a downtrend and eventually reached the 0.01872 bottom. It then received support from that level and began a bullish move.
✨ Right now, a significant resistance is located at 0.02227, which I’ve marked on the chart as a supply zone. So far, it seems the price has been rejected from this area.
🔍 Price has attempted to break this zone three times already. Each time, although it managed to penetrate further, it still failed to break through and got rejected.
💥 With each rejection, the RSI oscillator has also been rejected from near the 70 level and moved downward. If, in future attempts, the RSI enters the Overbuy area, the probability of breaking 0.02227 will significantly increase.
📊 Currently, market volume favors buyers. The buying volume on green candles has increased noticeably. Meanwhile, during the rejection from the resistance zone, the selling volume was very low, which signals strong buyer control.
⚡️ If the downtrend continues and price fails to form a higher low above 0.02020, we can enter a short position upon the break of 0.02020. A break of 39.35 on the RSI would be a solid momentum confirmation for this setup.
📉 The main short position can be opened upon the break of 0.01872. This would confirm the continuation of the downtrend and could lead to a sharp downward move.
📝 Final Thoughts
This analysis reflects our opinions and is not financial advice.
Share your thoughts in the comments, and don’t forget to share this analysis with your friends! ❤️
Vechain, Pick Your Own All-Time HighA mirror image from 2020-2021 would put a new all-time high for VETUSDT (Vechain) around mid-May 2026. Starts late ends late, right?
This is a great chart. Vechain hit bottom June 2023 and has been consolidating within a rising channel. A rising channel as in higher highs and higher lows. Now, this is bullish but still not a bull market but bullish consolidation.
Consolidation can happens in three different ways:
1) Purely sideways. When the action happens within a range.
2) Bearish consolidation. When consolidation produces lower highs and lower lows.
3) Bullish consolidation. As we see here, with higher highs and higher lows.
Now, this is bullish but still only part of the transition period. Bull market action is what you see on the left between March 2020 and April 2021. Notice the huge difference.
Some other projects have been producing lower lows but this isn't a bear market more like bearish consolidation. We are about to enter the bull market phase. And this phase tends to end in a bull run.
If the same pattern from 2020-2021 repeats, we can see a new all-time high in May 2026. I have four new ATH projections on this chart, pick your own.
Thank you for reading.
Namaste.

Check if it can break through 0.03779-0.04757 at once
Hello, traders.
If you "Follow", you can always get new information quickly.
Have a nice day today.
-------------------------------------
(VETUSDT 1W chart)
Support zone: 0.00440-0.101741
Resistance zone: 0.03779-0.04757
If it breaks through the resistance zone upward and maintains the price, it is expected that a step-by-step uptrend will begin.
Therefore, it is important to check whether there is support around 0.03779-0.04757.
-
(1D chart)
The key is whether it can maintain the price by receiving support near the M-Signal indicator on the 1M chart and rising to around 0.03779.
If it fails to rise, you should check for support near 0.02778.
If it falls below the 0.01741-0.2135 range, you should stop trading and watch the situation.
Therefore, the 0.01741-0.2135 range is an important support range from a short-term perspective.
-
The 0.03779, 0.04757, and 0.06603 points are important points as HA-High indicator points on the 1W, 1M, and 1D charts.
It is expected that a breakout trade will be possible when it breaks through the 0.03779 point, but since an important point is located before it rises much, the point to watch is whether it can maintain the price by rising above 0.04757 at once.
Therefore, when making a breakout trade, check if it rises above 0.04757, and if not, respond.
-
Thank you for reading to the end.
I hope you have a successful trade.
--------------------------------------------------
- This is an explanation of the big picture.
I used TradingView's INDEX chart to check the entire range of BTC.
I rewrote the previous chart to update it by touching the Fibonacci ratio range of 1.902 (101875.70) ~ 2 (106275.10).
(Previous BTCUSD 12M chart)
Looking at the big picture, it seems to have been following a pattern since 2015.
In other words, it is a pattern that maintains a 3-year bull market and faces a 1-year bear market.
Accordingly, the bull market is expected to continue until 2025.
-
(Current BTCUSD 12M chart)
Based on the currently written Fibonacci ratio, it is displayed up to 3.618 (178910.15).
It is expected that it will not fall again below the Fibonacci ratio of 0.618 (44234.54).
(BTCUSDT 12M chart)
I think it is around 42283.58 when looking at the BTCUSDT chart.
-
I will explain it again with the BTCUSD chart.
The Fibonacci ratio ranges marked in the light green boxes, 1.902 (101875.70) ~ 2 (106275.10) and 3 (151166.97) ~ 3.14 (157451.83), are expected to be important support and resistance ranges.
In other words, it seems likely to act as a volume profile range.
Therefore, in order to break through this section upward, I think the point to watch is whether it can rise with support near the Fibonacci ratios of 1.618 (89126.41) and 2.618 (134018.28).
Therefore, the maximum rising section in 2025 is expected to be the 3 (151166.97) ~ 3.14 (157451.83) section.
To do that, we need to look at whether it can rise with support near 2.618 (134018.28).
If it falls after the bull market in 2025, we don't know how far it will fall, but considering the previous decline, we expect it to fall by about -60% to -70%.
So, if the decline starts near the Fibonacci ratio 3.14 (157451.83), it seems likely that it will fall to around Fibonacci 0.618 (44234.54).
I will explain more details when the downtrend starts.
------------------------------------------------------

Vechain is at a good RRVET is at a major support level. If the price can give us more indications of a reversal, this could be the bottom. Momentum and trend oscillators are trending up. Market structure needs a bit of work, but it could be the beginning.
Full TA: Link in the Bio

VeChain Range & Structure AnalysisBINANCE:VETUSDT has been range-bound since November 2023, with very clear levels.
Key Zones
• Weekly Demand Zone: $0.019–$0.022 — major support with multiple rebounds.
• Weekly Supply Zone: $0.045–$0.055 — strong resistance dating back to early 2024.
• Midrange / HVN: ~$0.037 — heavy volume area and likely resistance if tested.
• Local Resistance: $0.027 — recent swing high + S/R since December 2023. A daily close above could mark a change of character and a shift to a bullish bias.
Possible Scenario
• With a daily close above $0.027, VET may revisit the $0.055 range high — with potential resistance at the midline along the way.
• If $0.055 is reached and followed by a sharp rejection, we might start seeing the formation of a macro Head & Shoulders — with $0.019 as a key neckline.
• Breakdown below $0.019 would activate a target near $0.0045.*
• Break above $0.055 would invalidate the H&S idea and could open the door toward $0.1150.*
* H&S scenario is purely hypothetical and would require structure confirmation.

Vechain, 20X, 30X Or 100X In 2025?Vechain stopped dropping in June 2023, that's the market bottom. Ever since it has been producing higher highs and higher lows. This is one of the strong pairs and the last correction already ended, last week.
The low prices in late 2024 launched a bullish wave and this bullish wave was corrected by more than 100%. This is a full flush. A full flush is always great news for bulls and buyers, because it allows for maximum growth.
The previous high is an easy and certain target which equal to about 245%. This is very easy and ultra-high probability because this level was already hit in the last wave. If VETUSDT can find buyers at a higher price, now that the correction went beyond 100% even more buyers will show up.
But 245% is only short-term and being super conservative, this pairs chart points to a new All-Time High. This is because of the chart structure, the fact that the bottom happened in 2023 and in this April 2025 we have a long-term higher low. The weaker pairs are producing new All-Time Lows now. The stronger pairs are producing higher lows. The higher low means that holders/traders/participants are not ready to part with their coins. They are simply not willing to sell and this is why the price remains strong in comparison to other pairs.
These same participants will work as the base for maximum growth in this newly developing bullish phase. The 2025 bull market, make no mistakes.
This is no usual bullish jump, no relief rally nor "initial bullish breakout" as I love to say. This is it, we are entering price dynamics similar to 2021 or better. A major bullish wave.
See here how the market performed in 2021:
Of course, it is not that the market will necessarily grow by 17,000%. I am just saying, 245% is easy, it will be a very strong bullish wave.
The top can be hit at 10X, 20X or 30X (Can be 100X for all we know)... Allow for strong variations. Regardless of the final outcome, you will be very happy with the results. It will be great.
Namaste.

FIFA WORLD CUP HISTORIC ROARING 20s QE Restart ScenarioBenjamin Cowen has been truly amazing with his analysis. As per monetary policy it's definitely too early to call the start of QE but we're on the right track.
it almost feels like the true Altseason will start when the FIFA World Cup starts. Every single scenario matches that theory. If you also pay attention to Algorand for instance, it's mimicking the early days of XRP. XRP is also mimicking the early years of Apple.
Can you imagine a scenario where XRP hits 120 dollars and Algorand 1200 dollars? I know I know the market caps etc. But so far it does feel like the markets are brewing for a truly historic roaring 20s scenario that could last for years.
Big question is, who has the first mover's advantage now and needs to catch up in the mean time?
I'm looking at tiny caps like Metastrike, and institutional coins like VeChain. China has already started QE so you may want to play around with VET while the entire market is boring.
JasmyCoin I can't tell yet, it could be but it has that annoying monitoring tag and in my case I've already survived 7 delistings already (dock, ooki, troy, gifto, gemie, kingdomverse, dreamsquest), so not touching it for now.
Looks very promising to be honest. Gotta have a long term vision here.

VeChain: Struggling…VeChain is struggling to stay above the key support at $0.018, but the anticipated low of the orange corrective wave ii should form above this red line – or may have already done so. Once the bottom is indeed settled, we expect the orange wave iii to break out impulsively, pushing well beyond the $0.08 resistance, where the entire orange five-wave move should ultimately complete the blue wave (iii). However, if VET falls below $0.018, the broader green wave alt. will reach a new bear market low (probability: 38%). Primarily, we consider wave as already finished.

VET looking for support as divergence forms. VET is approaching strong levels of support. There are signs of bullish divergence on momentum and trend oscillators. Although this is a good sign a chofch would confirm a pivot to the upside. DCA

VETUSD - Using Fib Circles AgainPrice showing strong affinity for 3.618 on the fib circle trend line i have drawn
I expect a strong bull move up to like 40c
Also plotting durations of bear and bull markets, with the first bear/bull market cycle being slightly shorter than the one we are experiencing now, meaning a longer bull period for the one we are in
Trying the fib circles again, 3.618 is the level in question
Bars pattern in green shows price movement up to 40c
Daily timeframe

VeChain: Down AgainAfter a brief recovery, VeChain is trending lower once more. The low of the orange wave ii from early February is approaching but shouldn’t be undercut for the structure of the orange impulse wave iii to remain intact. Soon, we expect a decisive and sustained breakout of this wave iii above the resistance at $0.08. As a mid-term target, the entire orange five-wave sequence should ultimately complete the blue wave (iii).

VET waiting my targetsBINANCE:VETUSDT
Possible Targets and explanation idea
➡️Vet weekly timeframe still waiting signal close short on weekly and buy based on TradeON
➡️I think we will see drop to 0.27 zone again sweep liquidity and close monthly gaps
➡️0.009-0.007 more likely will be a bottom for Vechain
➡️Positive bounce its a 0.039 monthly gap around 0 lvl
➡️Even after this bounce I think we will see continuation to low targets
Hope you enjoyed the content I created, You can support with your likes and comments this idea so more people can watch!
✅Disclaimer: Please be aware of the risks involved in trading. This idea was made for educational purposes only not for financial Investment Purposes.
---
• Look at my ideas about interesting altcoins in the related section down below ↓
• For more ideas please hit "Like" and "Follow"!

Bullish/Bearish Sentiment We saw #BTC last hit it's double top 209 days after making an ATH 64k in April and topping out in Nov.
VeChain also took around 200 days to revisit higher lows.
[BULLS}
Elliot Wave Theory:
It appears that we are in the next 2-3 wave
Regardless of the narrative, the trend is showing bearish in the short term. I have HODL positions but short until we hit our buy zones keeping a close eye on what #BTC and #ETH do.
CRYPTOCAP:ETH is in a channel and appears to be falling out.
If we dig deeper watch 3k as a psychological area of support, CRYPTOCAP:BTC will be around 95k. For NYSE:VET we see $0.04 being a key level of support in our first buy zone, secondary we are looking for around $0.033.
Once these levels hold I will flip my sentiment and continue to long into this year with our bullish commander and chief stepping into office.
#Donaldtrump
If November repeats itself with this day we could be hopeful for another 300% but remain reserved with our PT's on the way up because.
"You never go broke taking a profit."
HNY #vechain fam.
Don't over-leverage, set your SL before bed.
@VEREKTION

VeChain (VET)🔍 Technical Analysis of VET/USDT
📌 Introduction to the VeChain Project:
VeChain is an advanced blockchain platform designed to enhance supply chain management and business processes. By leveraging blockchain technology 🌐 and IoT 📡, VeChain enables companies to boost transparency and efficiency in their supply chains. Its primary goals include reducing costs, improving product quality, and increasing trust in business operations.
📌 General Overview:
The VET coin, a leading project in the blockchain space, is currently trading within an ascending channel on the weekly timeframe. This movement suggests a potential continuation of the bullish trend; however, key levels require close attention.
📊 Recent Price Movements:
The price recently hit the top of the ascending channel and underwent a short correction.
It is now approaching the red support zone (0.03238 - 0.03948) and the midline of the channel.
✅ Potential Scenarios:
Bullish Scenario 📈:
If the price rebounds from the red support zone, it could rally toward the channel's upper boundary.
A breakout above the ascending channel's resistance may pave the way for Fibonacci targets.
Bearish Scenario 📉:
If the red support zone breaks, the price could drop toward the channel's bottom or the gray support zone (0.01638 - 0.01966).
📍 Key Zones:
Daily Resistance (Yellow):
Range: 0.05038 - 0.05504
A breakout above this resistance on the daily timeframe opens the path toward the channel's top and higher targets.
Fibonacci Targets After Breaking the Channel's Top:
1.618 Fibonacci Level: 0.08251 - 0.09507
2 Fibonacci Level: 0.11594 - 0.13874
2.618 Fibonacci Level: 0.19679 - 0.23327
Critical Supports:
Channel's Bottom: The first significant support level.
Gray Support Zone (0.01638 - 0.01966): Acts as the final line of defense.
🛠️ Entry Strategy & Risk Management ⚠️:
Safe Entry:
Enter after the price breaks above the ascending channel and consolidates above the yellow zone.
Stop Loss:
Initially, place below the red support zone.
After breaking the channel’s top, adjust below the yellow zone.
Risk Management:
Adjust trade size based on confirmations.
Risk only 1-2% of your total capital on this trade.
📈 Confirmation Factors for the Move:
Trading Volume:
A noticeable increase in volume during the breakout of resistance or support signals a strong move.
RSI Indicator:
RSI above 60 indicates a bullish continuation.
Entry into the Overbought zone could lead to a sharp rally toward higher targets.
🚀 Conclusion 🏆:
This analysis highlights that VET is at a critical and sensitive juncture. With proper risk management and confirmation of technical signals, this coin could present exciting investment opportunities.

VeChain (VET) - Double Bottom BULLISHTarget Level 2= $0.04801 Incoming!!!
Breakout from a double bottom pattern formed, reversal to the upside.

#VETUSDT Ready For a Pullback or Will it Slide Down Further? Yello, Paradisers! Is #VeChain gearing up for a pullback, or are we looking at a potential retracement? Let’s dive into the details of this crucial setup for #VETUSDT:
💎#VET has been trading within a broadening wedge for months, with descending resistance and support lines guiding the structure. Recently, the price broke out of the wedge’s descending resistance, marking a key technical development. However, VET saw a massive profit taking and came back for liquidity capture.
💎The immediate resistance is resting at $0.060. A clean breakout above the $0.06067 resistance, confirmed with a daily close, could trigger an aggressive bullish rally. The possible targets following this move would be $0.08000 and potentially higher. Such a rally could attract fresh buyers and propel #VETUSD into a new bullish trend.
💎On the downside, the immediate support lies at $0.03811. Beneath this level, a strong demand zone exists between $0.03119 and $0.03811, which has previously acted as a reliable area for bullish rebounds. If the price revisits this zone, it could present an excellent opportunity for buyers to step in again.
💎A daily candle close below the $0.03119 demand zone would invalidate the bullish structure. Such a move could lead to further downside pressure, with the price likely targeting the $0.02000–$0.01500 levels. This scenario would also indicate a shift toward bear control.
Stay focused, patient, and disciplined, Paradisers🥂
MyCryptoParadise
iFeel the success🌴

💲 vet/vechain - 2024-2025 price prediction 💲hi my friends , just look at the analyse ...
how much profit could we take ?
how much profit can we take ?
💲💲💲💲💲💲 this price prediction say it truly 💲💲💲💲💲💲💲
0.028 - 0.28 - 2.8 ...

Vechain attempting to flip inverse h&s neckline to supportCan see here on the weekly timeframe chart how it’s already closed one weekly candl above the neckline.there have been many daily chart candles recently battling to main support on that neckline as well and also an impending golden cross on the daily chart time frame set to occur in tthe next 1-2 daily candles as seen here —-> blob:https://www.tradingview.com/e00ebf4c-9780-485c-a37a-9d603aec6fd4blob:https://www.tradingview.com/e00ebf4c-9780-485c-a37a-9d603aec6fd4 Since btcoin is still in the midst of it’s first correction since it has entered the parabolic phase of the bull run and we are so close to Black Friday which is often a time of year one can scoop up cryptos at a discount, this impending daily chart golden cross may be one of the few exceptions atelier where price action doesn’t immediately hav a big pump the same day as the cross. Vechain could always break apart from the pack though at that point as well and pump while most things are still correcting. Also a slight chance the market correction is over before Black Friday too. Whatever the situation may be, if we see Vechain correct here as well but also hold support on the daily timeframes 50ma,I will likely add a little bit to my Vechain stack *not financial advice*

VeChain (VET) - Key Levels 2024VeChain has yet to push price action above the neckline in order to have a continuation to the upside. Breaking the neckline will result in VET reaching a target of Resistance at: "$0.08" with up to +60%.
Candle wick rejection has formed again on the weekly time frame at the levels between the following: $0.047 - $0.054. A pullback to these levels will likely hold strong support around "$0.034" and bulls will retest major Resistance at "$0.04" once again in the future!

VeChain: Let’s go! Last week, VET managed to move further away from our blue Target Zone (between $0.0179 and $0.0292). As a result, we now consider the low of the same-colored wave (ii) as established. In the short term, the substructure of the blue wave (iii) could prompt a temporary return into our Zone, which is why we are keeping it active for now. However, the primary trajectory remains upward. Once the blue wave (iii) concludes clearly above the resistance at $0.055, a brief interim correction should follow before another upward move completes the magenta wave (i).

Vet Looks Ready For 300 to 400% Bullish Wave Like Doge Chart Looks Extremely Bullish For Vechain I Posted 1st Breakout Falling Wedge After That Vet Bounces Currently Vet Approaching Towards Symmetrical Triangle,s Major Resistance (Multi Year Descending Trendline) Expecting Successful Breakout In Coming Days From Here Vechain Easily Can Give 300-400% In Midterm
