Vechain $1 EOY/Early '22Vechain finally breaking out of its 0.236 Fib extension, looking for confirmation of breakout and then I think we begin our run to $1
Vechain

Vechain Week Charts and flags ?? Vechain on the week...
That looks quite nice and as you can see I have mapped out the similarities with the previous similar situation.
Initially it is important for the bulls to get through the USD 0.152 and gain ground. Then the tone could be set to continue.
If the Bears have an advantage and they manage to keep the bulls away from that $0.152, then we should look at where support can be found again.
For the support and resistance lines on this Time Frame, I use the Fibanocci series as a major guideline.
i see my first arrow is red.. should have been green too .. my bad.
Keep calm, trade safe en manage your risk.
(Disclaimer: no financial advice)

Reef Finance , Reef USDT (D)Hey guys
Wanted share bout reef tho
Just look at the calendar what expects us on december 31. 2 main events . Reef debit card - and Steam ecosystem (Just read bout this)
So we have main support level which i think is unbeatable - 0.022-0.023 ( Even if btc goes to 50 k )
If you want buy it now u can do it . I personally will wait for some small discount but current price also not that expens.

#VeChain: The Bull Run of Q4 (8X)VeChain: The Bull Run of Q4 (8X)
Resistance R: ATH, 0.148
EoY price: 0.7-1$

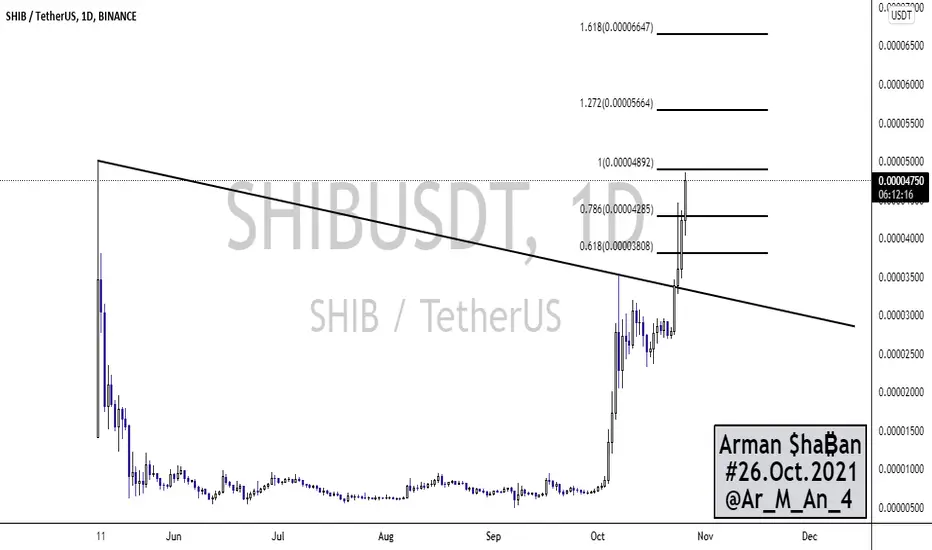
₿ SHIBUSDT 1D ₿ : 26.Oct.2021This analysis is a check of the chart in a Daily time frame and everything is clear on the chart and does not need additional explanation ... However, if you have any questions, feel free to ask .
⚠️ This Analysis will be updated ...
👤 Arman Shaban : @Ar_M_An_4
📅 26.Oct.2021
⚠️(DYOR)
VeChain updateVechain broke through the symmetrical triangle and 200MA. Let's wait for the end of the day to see if VET will close daily candle above symmetrical triangle and 200MA.

Vechain symmetrical triangle update- Vechain successfully broke through 200MA,
- successfully broke through the symmetrical triangle,
- successfully tested the support line and continued to rise.
This pattern basically started to form at the beginning of the year - if this breakout doesn't turn out to be a fakeout, it will mean a lot for further growth. The targert of this breakout is 0.35$. I think now is a good time to buy VET.

VET:USD broke out!!VET broke out of the triangle pattern and retested the resistance line as support.
We are currently hitting a strong resistance zone,
once we get past it we can expect A VERY strong move.
The price expectation for this pattern is 0.35 DOLLAR.

VeChain Trade Signal [VETBTC](310%+) @alanmastersVETBTC
BUY: 0.00000071 - 0.00000077
TARGET:
1) 0.00000095
2) 0.00000122
3) 0.00000166
4) 0.00000197
5) 0.00000235
6) 0.00000280
7) 0.00000308
STOP: Close weekly (W) below 0.00000064.
---------
This is not financial advice.
Trade at your own risk.
Make sure to do your own research and set a stop-loss.
Wishing you success.
Namaste.

Vechain (VET) - Structure and TargetsVET looks to be completing a minor Wave 3 within a larger Wave 5. It seems feasible that this structure will continue into next year?
What do you think, is there potential for a 100x from September lows?

Buying VECHAIN; Bullish wave 5 patternDear Fellow traders,
We prefer buying Vechain into last bigger wave 5. of major 3.
Expecting to see at least price targets around 0.158 or higher.
We like to buy any 3 wave or 7 wave corrections..
Invalidation is 0.100 however, we aim for the bigger cycle wave 5 pattern which is expected to extend higher towards 0.20+
Will keep posting updates regarding this trade as well.
Best regards,
AppYCrypto

Vechain Ready For a HUGE Run!!Looking at the Vechain/Bitcoin chart we have recently seen a great breakout to the upside, we were stuck in a clear descending channel since mid august and have finally broken through the top and i personally think this is just the start for this VET run! We are currently right on the 0.2 FIB after testing it for the 3rd day in a row and the break up and above is looming, i would love to see a push up and a daily close above this FIB level flipping it back into support and getting that boost to keep going upwards, a break above here would open the door for an absolute key target which is the pivot point, this is so important because if we get a close above this level we are set for a true pivot/reversal to the upside, with this level not far away it is very doable and could happen this week! Another explosive looking indicator we should talk about is the bollinger bands, we have been touching the top band for 3 days in a row now and the grab on and ride up is absolutely imminent, i believe that a break above this 0.2 FIB level will ignite this move on the bollinger bands since our actual candle body will be directly on the top band! Plus with our bands a lot more squeezed than normal an explosive move is coming and the bollinger bands doesn't actually indicate which way it will go but i think we all have a very good idea of which direction that is;) a very doable conservative target with all this bullishness is the 0.5 FIB which is our highs from mid august, after that we do have many key resistance points but i won't speculate too much and that will be for a later TA! Now the squeeze momentum indicator we are seeing something absolutely huge! Now we do have to wait until daily close to get the confirmation but it is our first green bar on the histogram in quite some time, without counting the super small green bar in the middle of our 2 red cycles it is the first since mid september! Now if we continue to see bullish price movement and continues increasing green bars we will be moving into a bullish squeeze shown by the black crosses and then eventually a bull squeeze release which almost everytime sends us flying to the upside! of course if the cycle is big enough with lots of momentum and with the looming altseason i think that is exactly what we are due for! Not financial advice just my opinion!!

VET wedge breaktrough?VeChain has been stagnant for quite some time now at around 0,10$, although it has reached the upper trendline of a wedge pattern. If the price breaks and successfully retests the upper trendline, VeChain might be looking at new all time highs. Nevertheless the prediction is very bullish, and would probably happen only if Bitcoin continues the surge and manages to hold above the 60k$.
The only thing that troubles me is the already quite high RSI, but if altcoins will surge if bitcoins makes a move and holds above ATH, we are likely to see a much more price momentum than I predicted.

VET - weekly chart analysisVET has broken back ABOVE its massive Symmetrical Triangle and has so far successfully tested it as support on this 1w timeframe. VET needs to 110% CLOSE this weekly candle ABOVE the Descending Trend-line of the Symmetrical Triangle.
Note that VET is still safely above its Longterm Upwards Trend-line (Ascending Dashed Line) on this 1w timeframe.
VET is still above its Bollinger Bands Middle Band Basis 20 Period SMA for this 1d timeframe. Note that VET has room to move up before hitting the Bollinger Bands Upper Band on this 1w timeframe.
VET is still above its Least Squares Moving Average (LSMA) for this 1w timeframe. For this indicator, ABOVE the LSMA is a potential ‘BUY’ and BELOW the LSMA is a potential “SELL’.
Note that VET is still above its Volume Profile Fixed Range POC for the fixed range of 5 weekly candle that i have selected.
Note that Volume has increased slightly but note that the Volume Bars are still Below its Volume 20 Period MA.
I have added various support and resistance areas on this chart and you can clearly see the interaction with theses area. Note that VET has found some resistance from its first resistance line.
The Average Directional Index (ADX DI) is indicating that the trend strength is sideways but strong with the ADX (Orange Line) at 22.69. Note that the 9 Period EMA is above the ADX at 25.38 but is dropping. The +DI (Green Line) has dropped slightly to 21.79 but the -DI (Red Line) has also dropped slightly to 14.34. This indicates both positive and negative momentum has dropped slightly. We will potentially see a massive move upwards if the ADX (Orange Line) crosses back above the 9 Period EMA (Black Line) if the +DI (Green Line) is still above and moving away from the -DI (Red Line) on this 1w timeframe.
The OnBalanceVolume (OBV) is indicating momentum is sideways within a range. Note that the OBV (Blue Line) has crossed back above the 9 Period EMA (Orange Line) indicating upwards strength on this 1w timeframe.
The Moving Average Convergence Divergence (MACD) is indicating that we have had the MACD Line (Blue Line) cross back ABOVE the Signal Line (Orange Line) on this 1w timeframe. Note that the MACD is still in the Positive Zone above the 0.0 Base Line and note that we have had our first proper Green Histogram for the first time in 7 weeks.
I have also added a Trend-Based Fib Extension to show some potential FIB levels if VET continues the upwards trajectory on this 1w timeframe.
VET is also in a very thin Rising Wedge Pattern. VET needs to invalidate this bearish pattern by breaking back above it and successfully testing it as support on this 1w timeframe. What is interesting is that the Rising Wedge takes us right up to the 4.236 Fib Level at $0.5147. This is something to keep an eye on on this 1w chart.
Note that this chart is looking at the longterm without taking into account what is happening on lower timeframes, which you should be watching & analysing as well. All in all, VeChain is looking great so it should be an interesting couple of weeks for VET providing BTC behaves herself.
I hope this is helpful with your trading and hodl-ing.
Notes:
Bollinger Bands = Grey Bands on chart
LSMA = Blue squiggly line on chart
VPFR POC = Short horizontal red line on chart
VPVR POC = Long horizontal red line on chart
50EMA = Yellow squiggly line on chart
Symmetrical Triangle = Converging ascending and descending black lines
Rising Wedge = Ascending converging dotted lines
Longterm upwards Trend-line = Ascending dashed black line.
Support and resistance areas = Horizontal black lines with yellow shading

VET/USD is bullish for the next 24 hoursVechain’s price is up today due to additional higher highs set over the past 24 hours after the $0.128 level prevented further decline on Friday. As a result, we anticipate VET/USD to continue rising and challenge the $0.143 mark next.
In the long run, a bullish VeChain price forecast is accurate. Despite the fact that values are presently trading near their all-time high levels, VeChain has yet to hit a new all-time high since August, possibly due to a lack of buying interest after the previous peak volatility.

VET for a break or rejected ? VET is in a range since May and is currently on the top of this range.
In Daily the MACD is green and in Weekly, MACD is starting to go green too, which mean we have more chances to break this resistance now than we had before.
However, prices could be rejected here and the idea would be to wait for a price confirmation with a Daily close above 15ct, then a pullback to the previous resistance area could be use as an entry.
On the other hand, if we get rejected here, i would wait for a return under 13ct and MACD H4 turning green to go for a long.
For now we can only wait and see how it will play out.

Vet looks bullishVet looks bullish as a next target is 0.42$
And the stoploss is shown in chart
Goodluck

VeChain [ VET ] - Value BUY AreaOne day we will look back and say "WOW!... Do you remember when VET was only 13 cents???
Check out some DD: youtu.be

VET TRADE ENTEREDVET finally broken resistance and closed above, entered a position here and after BTC ATH and major cap alts get filtered into these other gems will be next and will see now nice volume help this pump with our 30% trade target perhaps being conservative over the next few weeks.

₿ VETUSDT 1W ₿ : 24.Oct.2021This analysis is a check of the chart in a Daily time frame and everything is clear on the chart and does not need additional explanation ... However, if you have any questions, feel free to ask . My personal opinion : Personal review to buy (Buy Recommendation)
⚠️ This Analysis will be updated ...
👤 Arman Shaban : @Ar_M_An_4
📅 24.Oct.2021
⚠️(DYOR)

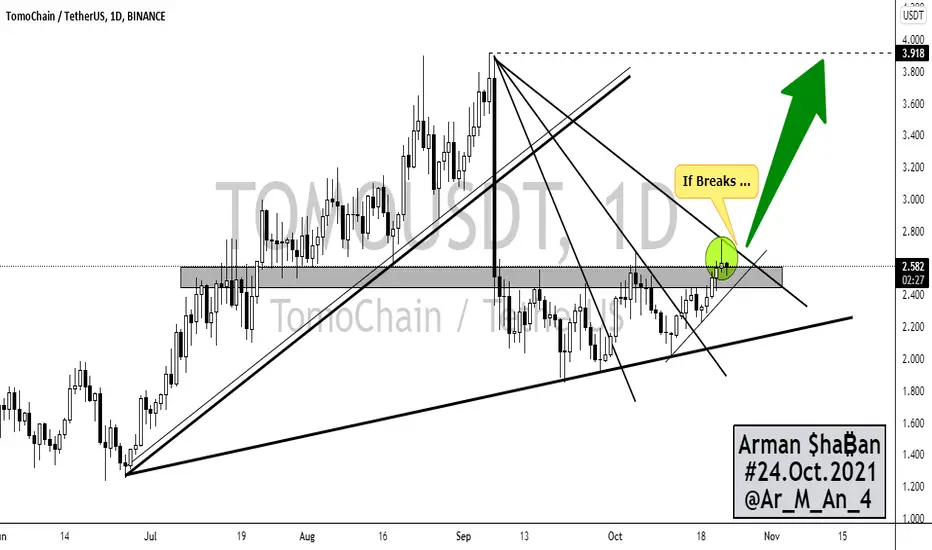
₿ TOMOUSDT 1D ₿ : 24.Oct.2021This analysis is a check of the chart in a Daily time frame and everything is clear on the chart and does not need additional explanation ... However, if you have any questions, feel free to ask . My personal opinion : Personal review to buy (Buy Recommendation)
⚠️ This Analysis will be updated ...
👤 Arman Shaban : @Ar_M_An_4
📅 24.Oct.2021
⚠️(DYOR)
VETUSDT Technical Analysis⏳ Spot
💎 VETUSDT has broken above the resistance and the triangle. It has gone for a retest and already got rejected. It has also has formed a Bullish channel. I expect that it continues the Bullish move
🌐 Tradingview
🏁 Short & Medium Term
💵 Invest Only 5% of your Portfolio
🎳 Entry at Market or at 0.13160 - 0.12700
☕️ TP1 0.14411
🍺 TP2 0.15000
🍻 TP3 0.17000
🍾 TP4 0.20000
🍷 TP5
🍸 TP6
🍹 TP7
🎁 TP8
🚫 SL 0.11800
Good Luck 🎲
Check the Links in Description and If you LIKE this analysis, Please support our page and Ideas by hitting the LIKE 👍 button. ❤️ Your Support is really appreciated! ❤️
Traders, if you have your own opinion about it, please write your own in the comment box. We will be glad for this.
Feel free to request any pair/instrument analysis or ask any questions in the comment section below.
We will have more FREE forecasts in TradingView soon
Have a profitable day 😊👍🏻

$VET BreakoutVET is one of the most exciting projects out there!
let's discover what the price will be by the next coming months.
I'm bullish on it!
---------------------------------
Best Regards, iSmashProfit™
