VeChain - Potential Buy Signal on the Daily Chart MACD IncomingVeChain quick daily chart update:
VeChain is still within its upwards Pitchfork Pattern (Points A,B,C).
VeChain is back above its Lower Yellow Pitchfork Support Line.
It looks like VeChain may soon attempt another crossing back above its Pitchfork Media Line.
For this timeframe, there is no fear of VeChain crossing underneath its Pitchfork Hagopian Line anytime in the foreseeable future.
VeChain is back above its Bollinger Bands Middle Band Basis which is a 20 Period SMA.
The Bollinger Bands Lower Band has moved up indicating volatility has been borough into equilibrium & it is now moving sideways with the Upper and Middle Bands.
VeChain is safely above its 50EMA (Yellow Line).
VeChain is back above its Least Square Moving Average (LSMA) (White Line). It is a potential buy signal when the candle crosses & closes above the LSMA line & a potential sell signal when a candle crosses & closes underneath the LSMA line.
Volume has also increased.
The Chaikin Money Flow (CMF) is indicating the CMF (Green Line) has moved back in the Accumulation Zone & is now at 0.05.
The Moving Average Convergence Divergence (MACD) is indicating that we may see a buy signal triggered because the MACD Line (Blue Line) is curving upwards and looks like it may cross back above the Signal Line (Red Line), which is a potential buy signal for some traders.
I’ve done this analysis on a zoomed out chart to show just how far VeChain has come sine March 2020 & how much more potential its has, especially if that MACD buy signal kick in. The future really is looking very bright for the VeChain.
I hope this is helpful with your trading and hodl-ing 👍
Vechain

VET Short Term AnalysisAfter a little correction vet can touch $0.30,Long term target for vet is $1 ...

VETBTC great long oportunity! Hi guys!
VET is looking really good as it broke the previous down trend line, looks like it's aheading a new ATH!

VET- VeChain Ready for The Big Breakout?Looks super bullish to me, up almost 10% today.
Now let's see if the Big breakout can take place (why not? it's a great project).
Take a look at the previous ideas for the fundamentals.
the FXPROFESSOR

VeChain (VET) has POTENTIALGood morning, Alkalites! It seems that the cryptocurrency market is recovering from last week and Altcoins are still following their rally!
Bitcoin dips shouldn't be a problem here following the DCA strategy, as Altcoin dominance is showing strong momentum against BTC.
Today we are adding to our portfolio VeChain (VET), with a Fully Diluted Market Cap of $18Billion, we believe it has a lot of grow potential in the long term. We may not see any discounts like these again in the near future. Our RSI Histo is showing high relative volume!
VET idea is to increase the efficiency, traceability and transparency of supply chains, while reducing costs and putting more control in the hands of individual users. (source: coinmarketcap)
Please invest a small amount from your portfolio, following the DCA strategy to avoid suffering from large price fluctuations. CryptoAlkaline is oriented on a long-term vision of this cryptocurrency. Before making any decision, ask yourself, if this asset fell 50%, would you take it as a loss or as a discount?
Do your own research, VET.
Check our FREE Telegram Channel for daily analysis like these!

VeChain (VET) READY TO PUMPHow is it going, Alkalites? Bitcoin pumped over 6% today! Whales are pushing the fear and greed index again! Let’s see if this movement reaches new ATHs.
VeChain is still lagging, as we believe in its long-term potential we are still giving buy set-ups. Prepare your alerts & buys at $0.215 if you have been following the DCA method.
QUICK REMINDER: We do not believe in technical analysis, but congested EMAs and pennants breakouts can show clear volume spikes in both directions.
Stay tuned on our updates in Telegram, we have a lot of Altcoins in our watchlist ready to pump!
See you later, Alkalites!

VET DAILY TRADE #14 -> How high can VET go?VET has broken a major trend line, broken 1 resistance and looking bullish. Its starting to approach the .25 mark and appears to be following many other dino coins in this bowl shaped pattern on the weekly, coming full circle back to the previous bullruns gains.
Todays VET daily I decided to chart up my ideas on vechain price targets for this year. These targets come from a mix of fibs and various VET charters (like cryptojtt) predictions.
-=-=-=-=-=-=-=-=-
VET Daily Trade
-=-=-=-=-=-=-=-=-
BUY = trend line retest
TARGET = .25
STOP = 4H close below trend line
** coin telegraph published an article highlighting institutional bears wanting to keep BTC below 60k this Friday due to $1.1B options expiry. So expect price to be suppressed today (for me, in my timezone) We will see if the expiry lifts the lid a little on this price range... aka WE GOING TO THE FRUITING MOON??!!

VECHAIN (VET) LOOKS DEPENDING ON TA TO INCREASE 20% +Hello trading friends,
And here with next possible increase coin for coming time 20% + increasing expecting depending on TA = VECHAIN.
This trend made 100% on TA.
Follow/like for more.

Vechain(VET) Update: Buy Signal 13 EMA Crossing Up above 50 SMA Vechain(VET) Update 07/05/21: 40% Gain from current price level to 127.20 Fibonacci extension @ $0.33. See previous analysis below
Vechain(VET) Update 27/04/21: 228% Gained from our Buy Zone 4 from the 4th April to 16th April...Next Stop $0.33 from Buy Zone 5 which is an 81% Gain from 50.0% Fibonacci retracement level. Lets take advantage of the current prices as we will not be seeing these low prices for a long period of time once the Bulls are back in the market for the next push phase. Use the Buy Zones to map your Buys or simply for dollar cost averaging. The Fundamentals are great for this project and we are very bullish on Vechain and can see EOY price target between $2 to $5. See previous analysis below. Happy Trading :)
Vechain(VET) Update 05 /04/21: VET perfect bounce from Buy Zone 4 37% Gain to $0.11. See previous analysis below.
Update 30/03/21
Vechain(VET) looks ready for another 37% Gain to $0.11. Since the 27th March Vechain has been consolidating between $0.087 & $0.097 range. Stochastics are now showing an oversold market and VET looks ready for continued Bullish momentum to the upside. Be patient with your entry as we expect VET to test the 78.60% Fibonacci level before confirmation of a move towards our target at the 127.20% Fibonacci level @ $0.11. Failure to test the 78.60% Fibonacci would see a 12% Gain from the current level to the previos ATH tested on the 22nd March @ $0.10.
Use the Buy Zone ($0.088) to map your entry if you are not already riding the current wave, from here you can DCA to accumulate more coins, 37% Gain to our $0.11 price target.
See previous analysis below. Happy Trading :)
$VET #Hodl
Update 23/03/21
Vechain(VET) looks ready for another 46% Gain to $0.11 at the 127.20% Fibonacci level. Stochastics on 4H showing an oversold market at this price level. On 22 March VET reached $0.10 on the Binance exchange. Since reaching this price level, the price broke below the 13 EMA and 50 SMA as the profit takers came into the market after 21 days of this strong bullish continuation pattern. Although we have broke below both 13 EMA and 50 SMA , overall VET is still bullish and we can expect a bounce from the price pushing above the 50 SMA but be patient as they may be more profit takers in the market. There is a high probability the Bulls will take back control and continue to keep pushing the price higher. Currently VET is showing signs of a weak retracement just below the 78.60 Fibonacci level. Use Buy Zone 3 to map out your Buys from here and if the 13 EMA crosses below the 50 SMA , we will be looking to DCA and Accumulate between the 61.80% to 50% Fibonacci level. From the 61.80% Fibonacci level we expect a 57% Gain to the 127.20% Fibonacci level, this would be the worst case scenario if we get a stronger retracement. See below previous analysis of a new ATH target @ $0.14 as this is the best case scenario from here. Happy Trading :)
Vechain Monthly Outlook Update 23/03/2021
Vechain(VET) Explosive Move New ATH Target, 62% Gain to $0.14, we are very confident this new price target will be reached over the next coming days/week(s). Stochastics showing an oversold market on the 4h
*Update Vechain Outlook 20/03/21*
Vechain is still on course to our 127.20% Fibonacci level, beautiful continuation pattern. Some great Buy Zones to DCA in this channel. New Target @ 161.80 Fibonacci, lets ride this wave to $0.11, 24% Gain from current price level.
Vechain dropped into the perfect Buy Zone zone to enter if you’re not yet in or want to dollar cost average if you’re already riding the current wave. Happy Trading :) See previous analysis below.
*Update Vechain Outlook 18/03/21*
Road to $0.10 is clear, we are still in a strong continuation pattern in search of new ATH at the 127.20% Fibonacci level in the short term. Use Buy Zone 3 to set up your buys, perfect sniper entry would be at the 78.60% Fibs (33% Gain to 127.20 Fibs). Watch for price action as we may see a small retracement down to test the 50 SMA just below the 78.60% Fibs before pushing to the upside towards the $0.08 price level and further $0.10 (40% Gain to 127.20% Fibs).
*13/03/21*
Vechain's price soared to a new ATH on 12/02/21 reaching $0.606 on the Binance exchange. Following the new ATH there was a small retracement before trying to push past the resistance set at ATH , but this failed to break on 19/02/21 and was met with huge selling pressure at these price levels, retracing down further, quite sharply after 4 days on 23/02/21 touching the 50 SMA on the daily chart with a low of $ 0.0341. The downward pressure was met with a sharp bounce on the 50 SMA recovering in a day 24/02/21 back to the 38.20% Fib retracement level showing strong signs of Bulls still in the market. As of the past 3 days the price has been consolidating between a small range between the 38.20% Fibonacci retracement levels and 23.60%. Further to note the price on 2 occasions has tested to break below the 50 SMA failing twice signalling strong bullish pressure and signs of the Bulls to continue driving the current price to test the ATH yet again whilst also setting the sentiment of a possible new ATH at the 127.20% Fibonacci retracement level @ $0.0702.
Furthermore the 200 SMA has been tested at 3 occasions on the 4H Chart, failing to break past this level. Vechain is in a perfect zone for Buys back towards the ATH . Stochastics on the Daily chart signal an extremely oversold market so expect Vet to push back 55% back to ATH levels and Further 74% to 127.20% Fibonacci with the potential to set a new ATH in the coming days to weeks in March.
The Fundamentals are great for this project and we are very bullish and can see EOY price target between $2 to $5. Buy Zone 1 @ 23.60% Fibonacci retracement level for the perfect sniper entry. Be patient, wait for confirmation before entering any buy. Happy Trading :)


VeChain Is Ready, Are You?This shows that VeChain has broken the downtrend. After a retest it is time to go!

+70% upside for VET?Guys, it's pumpseason and I would say that VeChain ⛓️ is going to have another pump⛽ soon! VET seems to be ready to break up this triangle 📐 and if successful there is chance for run to 0.36 and even higher.
ENTRY : local high @ 0.2236
SL : local low @ 0.2010
TARGET : height of the triangle projected from midpoint of the local range (BUY STOP-LMIT - SL) @ 0.36
RRR : 6
INVALIDATION : when SL level hit
Like👍 & Enjoy📺!

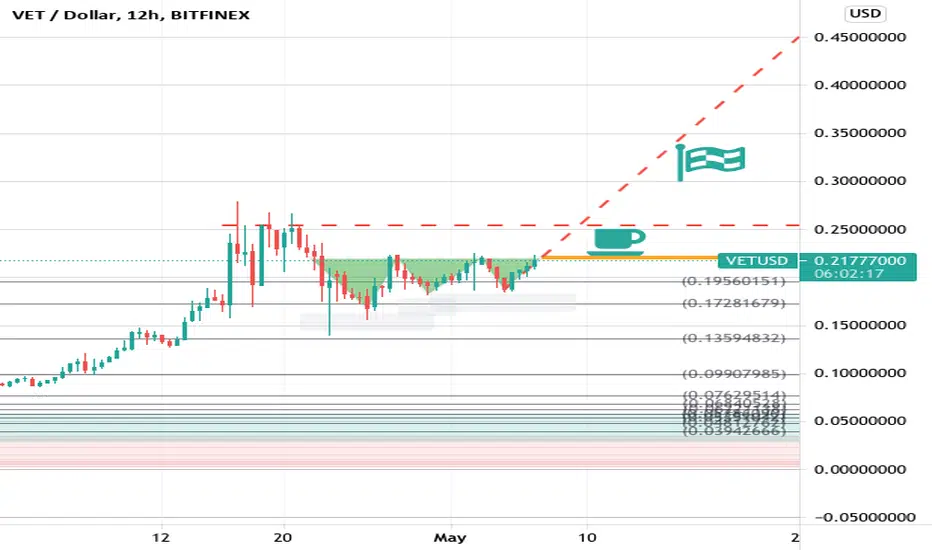
VET BET12 HOUR. Now that we've just about reached the neckline, we can anticipate the handle forming on this cup; touching $0.25, cooling off, and then $0.030. $0.172 is the most important support to hold if we're to continue, don't worry. Speculating Elon Musk's scheduled SNL appearance pumps all of crypto, the event just happens to fall where our handle belongs. I will never short my top holdings, this is one.
VETUSD 4H broke out the wedge patternVETUSD 4H
It broke out the wedge pattern.
If the close can higher than pattern and have short upper shadow. (less than 1/3 body)
The stop loss at red line (0.1820).
1st target will be 1(0.2798).
If the close can higher than 1(0.2798).
2nd target will be 1.272~1.382(0.3352~0.3576).
3rd target will be 2(0.4834).

VET / USDT 4HVET is inside a triangle.
The probability of breaking the roof of the triangle is very high
In the event of this failure, next target is $ 0.28, which is the highest price ever recorded.


VET DAILY TRADE #13 -> BREAKOUT PLAY!VET looking more bullish today despite BTC having failed at 58k. It came up for a break briefly, but wasn't able to close it on the 4h.
There is a possible entry back on support, that's definitely a play I may consider if we come down sharply.
If BTC can recover and try again at 58k then get ready for the breakout play!
-=-=-=-=-=-=-=-=-
AGGRESSIVE ENTRY
-=-=-=-=-=-=-=-=-
Buy the 'break and close' on 4h
-=-=-=-=-=-=-
TARGET: .25
STOP: If we break and close on 4h back below trend line.. or if BTC takes a big ole dump
-=-=-=-=-=-=-
-=-=-=-=-=-=-
SAFER ENTRY
-=-=-=-=-=-=-
IF BREAKOUT
THEN
Buy the successful retest of trend line
-=-=-=-=-=-=-
TARGET: .25
STOP: Same as above
-=-=-=-=-=-=-
-=-=-=-=-=-=-
SAFEREST ENTRY
-=-=-=-=-=-=-
BUY: .185
TARGET: .25
STOP: .175
-=-=-=-=-=-=-
--==--==--==----==--==--==--
Fundamentals
--==--==--==--
Rank #14
Market Cap = $12,585,223,824
Blockchain-powered supply chain platform
Top tier project
--==--==--==----==--==--==--

Vechain - Symmetrical TriangleVechain (VET), Inside of a Symmetrical Triangle.
If you want to trade this pattern wait for a breakout with good volume and confirmation!
Possible breakout to the upside (7.6 % increase)
Breakdown target upper support level (7.6% decrease)
Symmetrical Triangles mostly breakout to the upside, especially in the bull market.
Not financial advise, do as you please.

Vet looks so bullish.Vechain makes a bullish pennant pattern.
In a week it will break the channel.
To The moon!

VeChain- New ATH inboundBINANCE:VETUSD
Fib retracements confirm we are out of the pullback and consolidation period. Downward trendline broken, double bottom on 4hr chart confirmed post breakout of wedge (two green dots on Cypher B indicator, coincide with price action of 4hr chart).
3 confirmations of bottom
-Price action (always look at candles before indicators, rule #1)
-Fib levels held, and price action breakout of downward trend.
-double bottom on 4hr price action with dual confirmation on cypher B at these levels.
.24 is first price target, then look to following fib levels for resistance/ profit taking around .25 <-> .30
Regardless what happens to this coin in the near future, this is THE alt to hold long term, it will change the future of supply chain management by utilizing the power of blockchain.
