Vechain (VET) Has Broken Out The WedgeHey friends, hope you are well and welcome to the new update on VeChain Coin.
On daily chart the priceline of VET coin was moving in a falling wedge. Finally the price action has broken out the resistance of this pattern. The volume profile is showing very low interest of the traders in the area where the priceline is moving therefore the price action can move more up in the area where the trader’s interest is strong. Once the exponential moving average 10 will cross up the EMA 21 then a further bullish momentum will be confirmed and move buying volume will be entered.
On the long term weekly chart after a strong bullish move the priceline is retraced at 0.618 Fibonacci retracement level an likely to re-test the ichimoku bearish cloud as support. The conversion line is moving down to form bear cross with baseline but lagging span is again moving up therefore we can expect that soon the conversion line will be moved up that will be strong buying signal for the long term rally.
On the daily chart different short and mid term support and resistance levels can be seen. The priceline is moving between $0.011 and $0.015 support and resistance level. At the moment candlesticks are trying to breakout $0.015 resistance. Once this resistance will be broken out then a move upto $0.018 resistance is expected very soon.
Conclusion:
As the price action of VET coin has broken out the resistance of wedge but the buying volume is not as that much powerful that can give us confirmation that it is not a fake-out. However, if we will see the weak buying volume with continuity and the EMA 10 will cross up the EMA 21 then we can have the confirmation of a firm breakout. And in case of this bull cross between these two EMAs 10 and 21 we can expect a rally upto $0.018 very soon and in case of breaking out this resistance the price action can move upto $0.021 powerful resistance.
Vechainusd

VETUSDT Weekly Inside Bar Forming at SupportLast week's candle was a bullish pin bar. We might see another bullish pin bar this week, along with a possible inside bar pattern
Little choice for the market but to break out. Question is, which direction? :)
PS. Still a few hours to go before the weekly close so let's see if we do see an inside bar pattern here.

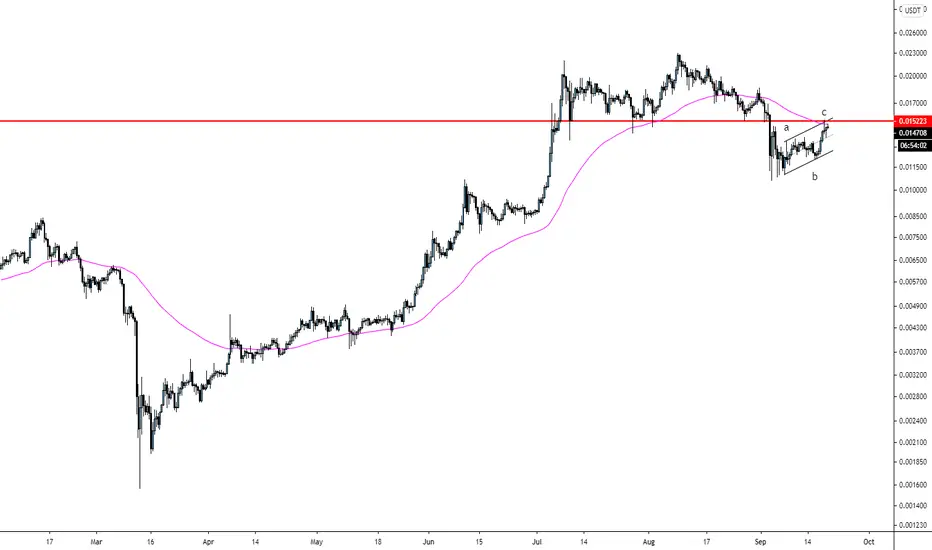
Sell Zone and Targets for VeChain VET/USDT $VETMy sell zone and target for VeChain. I belive VeChain is putting in a bear flag right now. A break above the resistance would invalid this set up.
(Not financial advice)

VETUSDT: VeChain Chart UpdateHere are the structures and levels I am watching.
Still in a pullback from that August high. Needless to say 0.01 is key level here and a bounce here would not be unreasonable given how the market has performed against the level in the past 5 weeks.
Let's see if the bulls can hold the level in a weekly closing basis.
Weekly chart:


Vechain (VET) This Dump Will Lead To A Big PumpHey, friends hope you are well and welcome the new update on Vechain coin.
On long term weekly chart the priceline is retraced between 0.50 to 0.618 Fibonacci retracement. Before this correction the price action of VET broke out Ichimoku cloud with powerful bullish rally. Now it is retesting the 25 SMA as well.
On daily time period chart the priceline is moving in falling wedge pattern Vechain. Recently price action is rejected by resistance of wedge and moving down. The volume profile is showing weak interest of traders at the support of wedge pattern. The moon phases indicator is also showing new full moon above the resistance. Therefore there are chances of breakout after a correction.
On daily chart the EMA 10 and 20 are in bear cross. The stochastic and macd are weak bullish. When all three indicators will turn bullish then we can expect another rally to the upside.
The pricline is likely to move down to re-rest support at $0.011. The next resistance levels are $ 0.015, $ 0.018 and $ 0.021 respectively.
Conclusion:
The priceline is moving down after rejection by the resistance of wedge. But before support of the wedge we also have strong support of $0.011. Therefore the priceline can retest this support and start the next rally for an attempt to break out from the resistance of the wedge.

VECHAIN MIGHT BREAK OUT!!Broadening wedge forming and we are about to break out and backtest it as support again !!1


Don't miss the great buy opportunity in VETUSDTTrading suggestion:
. There is a possibility of temporary retracement to suggested support line (0.0165). if so, traders can set orders based on Price Action and expect to reach short-term targets.
Technical analysis:
. VETUSDT is in a range bound and the beginning of uptrend is expected.
. The price is below the 21-Day WEMA which acts as a dynamic resistance.
. The RSI is at 47.
Take Profits:
TP1= @ 0.0190
TP2= @ 0.0210
TP3= @ 0.0230
TP4= @ 0.0285
TP5= @ 0.0366
SL= Break below S2
❤️ If you find this helpful and want more FREE forecasts in TradingView
. . . . . Please show your support back,
. . . . . . . . Hit the 👍 LIKE button,
. . . . . . . . . . . Drop some feedback below in the comment!
❤️ Your Support is very much 🙏 appreciated! ❤️
💎 Want us to help you become a better Forex trader ?
Now, It's your turn !
Be sure to leave a comment let us know how do you see this opportunity and forecast.
Trade well, ❤️
ForecastCity English Support Team ❤️

Vechain Short Term Analysis VetBtcVechain finally saw 162 sats. Bitcoin rise caused, but 162 was important to me. We will watch and see from now on.

Buy Zone and Target for Vechain VET/USDTI think VET is forming a bull flag, which could break up very soon. This is my buy zone and target for VET. I'd cut loss if it broke below the support. This is an updated one from the previous post that i did last week.
(Not financial advice)

VET SHAKING OUT WEAK HANDSI just wanted to point up, as i wrote in the previous post, targets around 0.015 were hit. Lets see what happens next.

VECHAIN CONTINUES TO PUSH HIGHER (BEST CRYPTO PROJECT SO FAR)It looks like we are done correcting I had personally bids around 180sats. Positive news and coinbase listing are still ahead of us. In few days/weeks we should continue pushing to ATHs.


Vechain Attempting To Find Support On 4-Hour and 12-Hour Higher time-frames, 1 day and 2 day are showing negative momentum for VETUSD while 4 hour and 12 hour suggest traders are attempting to find a break. It will be a very interesting close to the week as a 40% rise still seems quite possible looking at the weekly chart structure.
However, if bitcoin decides to nose dive it could spark a significantly altcoin correction due to recent big gains.

Another target for VET Previous ATHIt took us about 2 years of stacking VET as much as we could to watch this live trade, another 32% will bring us to ATH, and after that something around 0,036 is the fibo target which correlates with the previous old vechain chart before 1:100 changes in tokenomics.

Dear VET...plz pull back so I can buy more ;)We are either headed straight to 3-5 cents or we will see a pull back in the short term....Check out the Vechain video I made last month , people are starting to catch on
youtu.be


#VeChain #Vet hit its desired targetLooks like the 1.618 on the Fib Retrace target played out perfectly.. on to the next target.
What do you think?
- NCCM

Vechain futher consolidation or breakout?Are we going to see a break out in vechain or further consolidation...VEFAM let me know what you guys think!

Vechain Launch Sequence InitiatedI don't think there's a trader on Earth that would not agree this chart looks very, very promising. With a 'three white soldiers' formation and current price above a long-term horizontal resistance level, (plus RSI and short moving averages crossing up), we expect traders to take long positions for July and beyond.

VECHAIN 2-3 cents by August (mark my words)!!!I want VET to pull back before the coinbase listing so I can buy more :(
