SasanSeifi 💁♂VET/ USDT DAILYHey there! By analyzing the VET chart in the daily time frame, as you can see, after a period of growth, the price has experienced a minor correction, and it's currently trading in the price range of 0.017 after coming down from the 0.018 range. In the daily time frame, the expectation is that, with the maintenance of the price range between 0.016 and 0.1530, the price may experience growth toward the liquidity zone at 0.01850. To better understand the continuation of the price movement, we need to observe how the price reacts at the crucial resistance zone of 0.018. It's possible that, upon confirmation, we might witness a rejection of the price. The potential scenarios are also indicated in the image above. Additionally, if the price manages to establish itself above the 0.018 range, the target range of 0.020 could be considered.
✨What's your opinion? Do you agree?
🔵Remember, always conduct your own analysis and consider other factors before
making any trading decisions. Good luck!"✌️
❎ (DYOR)...⚠️⚜️
Sure, if you have any more questions or need further clarification, feel free to ask. I'm here to help!
if you found my analysis helpful, I would appreciate it if you could show your support by liking and commenting. Thank you!🙌✌
VET

VET (Y23.P4.E1) Bullish breakout. Don't miss outHi Traders
A quick post for your attention.
All the best.
Regards,
S.SAri

Brief Analysis——VETVeChain is a smart contract platform focused on providing supply chain management solutions for enterprises and integrating with Internet of Things (IoT) devices to facilitate the process. VET is the Token of VeChain. On Sep.12, after Coinbase announced that it would list VET, VET increased for several days in a row. Apart from being listed on Coinbase, there are no additional benefits.
At the daily level, although the increase brought about by the listing is very strong, it has not recovered the earlier decline. Price fluctuations of 20% are common for VET. At a large level, VET has never been able to break through the yellow wavy range. After rising, VET remained fluctuating for nearly a month, during which trading volume returned to previous levels.
The MBF indicator showed a strong bottom-buying sentiment on Sep.13. The listing on Coinbase indeed attracted many traders to collect chips. We can also see this from the WTA indicator. When 4 consecutive candles appear, the blue whale participates in the transaction. However, it should be noted that after the increase ended, the price continued to fluctuate for a month, and the whale disappeared. In addition to the blue columns, the gray and red are also gone. Only retail investors are trading. This shows that the whale has taken profit. In recent days, we can see very short blue bars appearing while the price is indeed falling, which is not good.
The rise of VET may be over.
Disclaimer: Nothing in the script constitutes investment advice. The script objectively expounded the market situation and should not be construed as an offer to sell or an invitation to buy any cryptocurrencies.
Any decisions made based on the information contained in the script are your sole responsibility. Any investments made or to be made shall be with your independent analyses based on your financial situation and objectives.

VET/USDT Break the Bullish Flag, Bullish Momentum ??? 💎 VET has successfully breached the Bullish Flag pattern, indicating a continuation of bullish momentum, potentially leading to further upward movement. It is anticipated that VET will undergo a retest in the Demand Zone (DZ) before persisting in its trajectory.
💎 The optimal purchasing point for VET would be within the DZ area, or alternatively, one could wait for a retesting phase. Prior to the breakout, VET experienced some consolidation within the Demand area and eventually broke out, marked by a robust green candle. Utilizing the target pattern of the Bullish Candle, the maximum target VET is projected to reach is the Bearish OB, coinciding with a potent Supply area.
💎 This scenario would be invalidated if VET closes below the Bullish OB area on a daily basis.

VET ANALYSIS (1D)In our opinion, the symmetrical pattern of VET is completed and branch I, which is the last branch, is finished. We are looking for buy/long trades on the green area

VETI think VET has bottomed. Is it possible this current retrace creates a new bottom? Sure. But currently, I don't think that will happen. If it does, I'll reevaluate.

Support range for short-term uptrend: 0.01599-0.01647Hello?
Hello traders!
If you "Follow" us, you can always get new information quickly.
Please also click “Boost”.
Have a good day.
-------------------------------------
(VETUSDT chart)
(1M charts)
In order to turn into an upward trend, the price must meet the HA-Low indicator, receive support, and rise above the MS-Signal indicator.
Therefore, the key is whether it can be supported and rise around 0.006085-0.008837.
(1W chart)
The key is whether it can be supported by rising above the HA-Low indicator, that is, above 0.01741.
Therefore, the key is whether it can receive support and rise around 0.01741-0.0211.
If not, it is expected to fall to around 0.004398.
(1D chart)
It shows an upward trend near the HA-Low indicator.
Accordingly, the key is whether it can receive support and rise around 0.01599-0.01647.
To do this, we need to check whether we can break upward through the downward trend line and the M-Signal indicator on the 1W chart.
1st: 0.0197
2nd: 0.02382
You need to check whether you can receive support and rise near the 1st and 2nd levels above.
If the price rises above the MS-Signal indicator and maintains the price, there is a possibility that it will turn into an upward trend.
-------------------------------------------------- -------------------------------------------
** All explanations are for reference only and do not guarantee profit or loss in investment.
** Trading volume is displayed as a candle body based on 10EMA.
How to display (in order from darkest to darkest)
More than 3 times the trading volume of 10EMA > 2.5 times > 2.0 times > 1.25 times > Trading volume below 10EMA
** Even if you know other people’s know-how, it takes a considerable amount of time to make it your own.
** This chart was created using my know-how.
---------------------------------

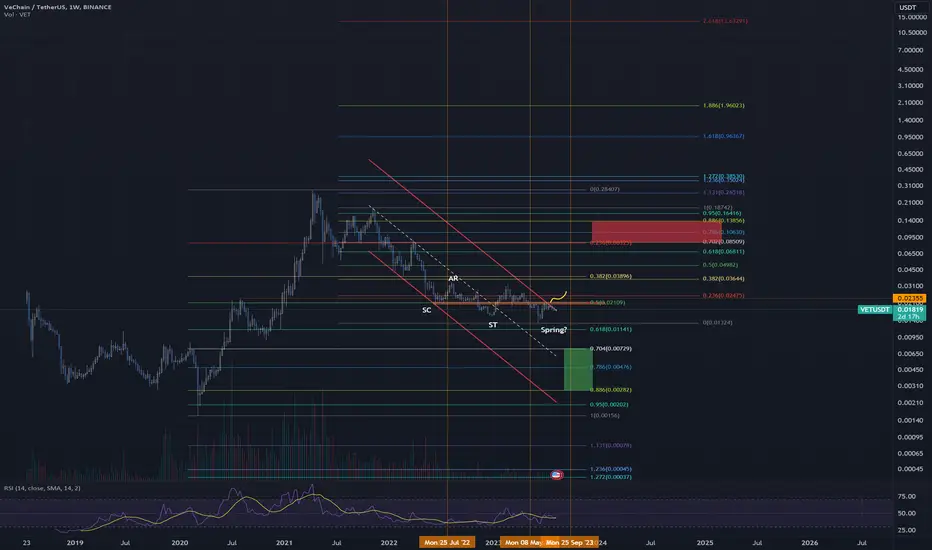
5 Weeks of Unwavering Support for VeChain (VETUSDT)💎Turning our focus to the #VETUSDT weekly chart, it becomes evident that recent price movements have piqued our interest. Over the past year, #VET has maintained a tight range, primarily hovering around the $0.015 support area. During this extended period, it has formed what appears to be a compelling triple bottom pattern, and the most recent bounce off this crucial demand zone has occurred consistently over the past five weeks. This remarkable resilience suggests strong defense by the bulls and amplifies the potential for an imminent upside breakout.
💎As we delve deeper into the chart, we note that #VET has now approached a long-term downtrend trendline. Intriguingly, this trendline, when combined with recent price action, forms a triangle pattern—a classic signal of impending volatility. Maintaining a cautious yet optimistic stance, we keep a close eye on the current support area, anticipating a potential breakout above the downtrend trendline. This critical juncture could witness a substantial shift in market sentiment, with the possibility of this breakout occurring on either the daily or weekly timeframe.
💎Envisioning a bullish scenario, should the breakout materialize as expected, #VETUSDT would likely embark on a northbound trajectory, setting its sights on the nearest Supply Area around $0.0216. Such a substantial price surge would signify a robust 50% increase for the #VeChain community, reinforcing the significance of these potential developments.
💎While the path to the upside appears promising, it's prudent to acknowledge that the closest resistance area coincides with the 50 Exponential Moving Average (EMA). This confluence highlights the importance of this supply zone and underscores its potential role as a significant hurdle for price advancement.
💎In conclusion, while we eagerly await the long-awaited upside breakout, we advocate for a cautious and prepared approach. The recent pattern of consistent defense of the support zone indicates a strong foundation for potential bullish momentum. However, it is essential not to rush into positions prematurely. Maintaining readiness for various market scenarios, including the possibility of a price retracement, is crucial. Paradisers, remember that prudent and informed actions based on confirmed price action are key in navigating this intriguing landscape.

Vet Getting Ready For Massive Breakout Seems Like Preparing for massive recovery
formed falling wedge and testing 2 years+ old trendline in 3 days incase of successful breakout expecting solid recovery
incase of successful recovery expecting 300 to 320% bullish wave in midterm


Vechain next possible move?!!👀 VETUSDT Today Analysis
💎 Let's delve into VET. Currently, it's trading within a descending channel and we anticipate a breakout in the near future.
💎 If the breakout occurs successfully, it will likely trigger an impulsive move as projected.
💎 An important observation is that we have two confirmed order blocks in the lower
timeframe. The price is expected to reach these levels due to the presence of liquidity.
💎 Previously, the demand turned into supply, causing a significant price drop and targeting the previous OB.
💎 In the dynamic world of crypto, staying informed and adaptable is key. Stay tuned for more updates and enjoy your trading journey

We are so close now 🚀🚀🚀Vechain has been in a strong bear market since the middle of 2021 and I think we've hit the bottom most part of Vechain's channel.
We had a recent huge drop wick from 0.021 down to 0.013 and then an immediate retracement back to 0.021 signifying strength and support in this area. The beginning of a bull market is exactly what I expect in these months leading up to Christmas 🎄 🎁

VET is Ready for its Next Bullish Rally | VET/USDT Analysis 💎 VET/USDT is currently navigating a robust demand zone, hinting at a potential upward shift.
💎 Not long ago, it skillfully tapped into liquidity, tackled the descending OB, and set its course upward.
💎 As of now price is consolidating but we're on the lookout for a bullish surge past the trend line.
💎 With a clear supply zone and liquidity just above, there's a strong chance the price will engage with this level in the near future.
💎 In the ever-evolving crypto landscape, staying updated is crucial. Keep an eye out for further insights and savor your trading adventure.

VET will jump soon!!!Vechain is almost breaking the diagonal resistant, if im you, i will not miss this!!

VETUSDTAs the chart illustrated, we can see triangle pattern with broken side and as this chart checked in weekly time however everything is correct.

VET VECHAiN about to spring?dancing right on the 0.5 fibb level and about to break the downtrend after possibly creating a bottom for 1+ years
Strong next move in either direction expected.
---
If you like my content, if it helps you gain profit, give it a like!
Thanks!
---
Hold my beer pls
----
No financial advice, do your own research, don't be stupid
VET and the Impressive 640 risk to reward opportunity Hi Everyone;
today we have one of the best risk to reward Investment opportunity
it is more than 640 times the risk and the chart is look very promising.
I expect breaking the previous bear market key point will clear the way to the final target

Bottom range: 0.01840-0.02299Hello?
Traders, welcome.
If you "Follow", you can always get new information quickly.
Please also click "Boost".
Have a good day.
-------------------------------------
(VETUSDT chart)
In conclusion, VET is currently a buy time for the mid- to long-term.
Since the 0.01840 point or less is a long-term investment area, it is recommended to proceed when it shows sideways in the 0.01840-0.02299 section in order to proceed with the purchase from a mid- to long-term perspective.
Otherwise, if you buy below 0.01840, you will have a really tough time because you never know when the price will actually rise.
For more details, check out each chart below.
(1M chart)
From a long-term perspective, it is expected that a full-fledged uptrend will begin only when it shows support around 0.02695.
(1W chart)
Since the Bollinger bands have started to contract, the question is whether it can be supported near the HA-Low indicator on the 1W chart and rise above the HA-High indicator on the 1W chart.
So, we need to see if it can get support around 0.01858 and rise around 0.02355.
(1D chart)
The key is whether it can get support around 0.01797-0.01858 and rise above 0.01958-0.02062.
Therefore, it is important to be able to sideways within the 0.01797-0.02062 interval.
In that sense, the volatility period is around August 3-17.
-----------------------------------------------
Of the many indicators or lines displayed on the chart, the most important are the horizontal lines that mark points of support and resistance.
Trading is to create a trading strategy and respond to it according to how it moves on these horizontal lines.
Therefore, in order to mark the points of support and resistance, you need to look at the 1M, 1W, and 1D charts in order and mark the points of support and resistance.
This is because support and resistance points are the strongest lines drawn on the 1M chart.
Therefore, other indicators or lines are not directly related to the trading strategy as they are supported or resisted at support and resistance points and are viewed from a trend perspective.
The reason why several lines are drawn on the chart in advance is that the positions of support and resistance points may change each time you see them depending on price volatility or your own psychological state.
Since this can cause fatal problems in creating a trading strategy, support and resistance points must be marked based on objective data.
-------------------------------------------------- -------------------------------------------
** All descriptions are for reference only and do not guarantee profit or loss in investment.
** Even if you know other people's know-how, it takes a considerable period of time to make it your own.
** This is a chart created with my know-how.
---------------------------------

Teasing a breakup to new price discovery!I think we're so close to something big happening or an altcoin season in my opinion. Ever since the Ripple lawsuit by the SEC that Xrp is now considered not a security. This cannot be reverted. No appeal is going to change that decision so literally I believe this is the beginnings of the altcoin season and we're on the verge!
Patience for a new bullrun any moment.. and we can see that sentiment with mutiples of different crypto ready for big moves in this space, examples such as XLM, TRX (Tron), Flare, Songbird, Vechain, Pundi X and tonnes of others waiting for new price discovery. Ticking timebomb!!

VET ANALYSIS (4H)Hi, dear traders. how are you ? Today we have a viewpoint to BUY/SELL the VET symbol.
For risk management, please don't forget stop loss and capital management
When we reach the first target, save some profit and then change the stop to entry
Comment if you have any questions
Thank You

Looks like breakout imminent for Vet!Vechain is quite undersold at the moment, although it's been forming this resistance on the way down and appears it's finally going to breakout to the upside 😀
This is finally going to turn things around for Vechain and I can't see it any other way 🚀

Vet Breaking Falling Wedge Seems Like Ready for Massive breakout Breaking falling Wedge Incase Of successful Breakout expecting 200%+ bullish wave In Midterm Look For Lower Tfs breakout for Entries

VET VeChain Falling Wedge Pattern Vechain (VET) currently finds itself at the end of a falling wedge pattern, which could potentially indicate a bullish reversal in the near future. This technical pattern suggests that selling pressure has been gradually decreasing, while buyers may start to regain control.
Considering this chart pattern, there is a possibility of a technical rebound for Vechain, with a potential target price of $0.022.
Looking forward to read your opinion about it!
