VETBTC | The Long Run!VETBTC Potential is super under-estimated. If long term is not for you, crypto is not for you. I'd buy the dip if i were you. Go LONG and HODL!
Vetbtclong

Vechain / BTC Breaks Out! Will it go to ATH?VETBTC has successfully broken out of the long term resistance trend line on the daily charts. On the weekly charts the closing is awaited for confirmation of the same by post closing on 31st May 2020.
In the meantime, our initial position has already yielded around 30% returns and more returns are possible in the coming days if the chart structure remains intact.
Below is our earlier Long Call on VETBTC Pair
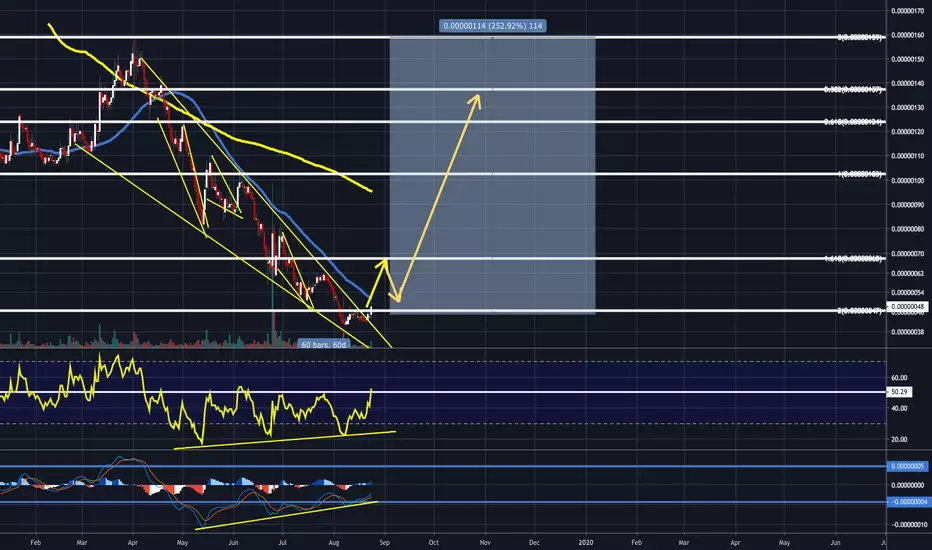
Earlier Analysis 4H Chart:
1D Chart:
The daily chart here shows the initial breakout region being tracked by a highlighted red eclipse.
The red line is the long term resistance line VETBTC has broken out of. The thick green line should act as the immediate support for VETBTC to continue moving in an upward trend. The green line at 35 sats is the long term support expected to be held but for current position to continue the SL would be maintained at the thick green line. Any break below the same could lead to testing the long term support at 35-37 sats region and hence shown with red downward pointing arrows.
The green highlighted polyline is the region for VETBTC to grow going forward with ghostlines drawn for only reference. The actual movement will be monitored over a period of time.
Any break above the yellow line could lead to a potential parabolic rally for VETBTC. Be cautious while trading in that zone.
Our targets on VETBTC pair stand at 64 / 82 / 110 / 150 / 250 sats. We are active in VETBTC since 45 sats level.

#VETBTC ANALYSIS.. In the #VETBTC daily chart; We observe that the T3 curve and Vortex form the BUY signal, we can say that these two indicators work well together from past to present in #VETBTC.. Ma50 is important resistance, must be followed carefully.. For those who love risk, I think # VETBTC is worth watching..
Disclaimer: What I wrote is not investment advice.. Please do your own due diligence when it comes to crypto-investing.. Never put in money that you cannot afford to lose.. Invest at your own risk..
I wish you all the best..


VET/BTC TA Update (Bearish H&S Pattern?)VET/BTC
I can see a bearish pattern here if VET is unable to break this downward resistance and previous High at 86 sats. If VET closes below the important support level at 70 sats it will trigger bearish pressure to retest the 200 Day MA just below the golden Fib 0.618 level before rising back again.


VETBTC will make a bullish waveVeChain has had a massive bull run since late October. Since there, VETBTC has generated over 100% profit.
Now the price has approached to the bull trend line.
There will be a good entry zone with low risk.
Trade instruction are shown in the chart, Please follow them.
Good luck


BUY your tickets for the Vechain express if you havent alreadyALL ABOARD!! BUY your tickets for the Vechain express to the MOON if you havent already!! Not many people have talked about this SLEEPING GIANT too many fundamental to list, I have made a youtube video on my channel www.youtube.com
anyway the biggest sleeper i think is Vechain i got a first class ticket on the Vechain Train
VET Scalp Idea$VET Scalp:
- $BTC looking bearish
- CCI showing significant positive shift in trend
- TP at former S/R level
- 3R trade
-Wait for reclaim

VET LONG PLAN$VET
Good news: Decent bullish div on the daily.
Bad news: Still beneath resistance/hasn't made a higher low.
Wait for the latter, and long to target for +50%.
