VeChain Elliot WaveVeChain forms a beautiful Elliott wave pattern. Based on this theory we are now in the beggining on the last fifth wave. I think VET can easily reach 0.60$ - 0.75$. Even 1.00$ is possible.
Vetusd

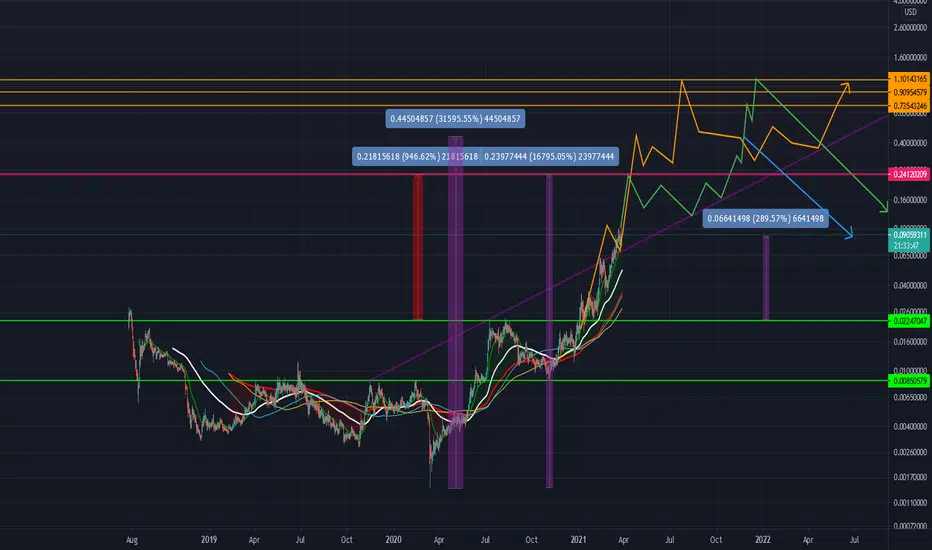
Lets search some cryptoFlag at 40% projection, high volume, buy trigger at 0.12 in 4h for few days.
Tec. Explanation: flags when top line breaks usualy double his size.
Strategy: Stoploss at 0.103. Buy at 0.12 and sell in 2 times: first at 13% for safe, second at 0.16 for 40%.

VeChain - 1 week chartYes…….. VET is still in its massive Symmetrical Triangle pattern.
VET is back above its Bollinger Bands Middle Band Basis 20 Period SMA on this 1w timeframe. A very good sign will be if VET closes this weekly candle above its Bollinger Bands Middle Band.
Note that the Upper Bollinger Band is moving sideways and the Lower Bollinger Bands still moving upwards with a slight sideways slope indicating we may see sideways consolidation and a potential BB Squeeze or Pinch on this 1w timeframe.
VET is still safely above its 50EMA on this 1w timeframe.
VET is still safely above its Least Squares Moving Average (LSMA) for this 1w timeframe.
VET has found some resistance fromm its ascending dotted resistance line.
VET is just below its Volume Profile Fixed Range Point of Control (VPFR POC) for the fixed range of 12 weekly candles that i have selected.
Volume is still relatively low on this weekly timeframe and note that the Volume Bar is still below its Volume 20 Period Moving Average.
The Moving Average Convergence Divergence (MACD) is showing that the MACD Line is still under the Signal Line but note that the Red Histograms are decreasing in size slighting. Note that the MACD Line is still above the 0.0 Base Line in the positive zone.
The On Balance Volume (OBV) is indicating a nice rise since the 20th Sept, note that the OBV Line is very close to crossing back over the 9 Period EMA Line. It's not set in stone but we should not be surprised if we have a big move up on this 1w timeframe if the OBV Line Crosses back above the 9 Period EMA line.
For your viewing pleasure i have also added adjusted Support and Resistance areas of interest, shown as black parallel lines with yellow shading.
Note that VET is still in a LONGTERM UPTREND. This will NOT change unless VET crosses under and fails to make it back above its Dashed Ascending Trend-line.
All in all VET is still looking great and still within its Symmetrical Triangle. If VET stays above the Bollinger Bands Middle Band on this 1w timeframe then this could be a good spot to accumulate more for the longterm before a potential breakout to the upside. I still wouldn't get excited until VET crosses and successfully closes above its Symmetrical Triangle Descending Trend-line.
I hope this is helpful with your trading & hold-ing.


VET= IHSVET printing what looks to be an inverse head and shoulders pattern, complete with dandruff. Target is $.15. Get 'em!


vet/usdt 4h chart vet/usdt 4h chart
2 diffrent idea for vet
.
.
.
.
.
.
enter after breakout long or short

VET - is going to break this trend line🚀🚀Most coins show the same pattern on the graph. Almost all altcoins are near the trend line . A break or retest would be a good buying opportunity.
Write in the comments all your questions and instruments analysis of which you want to see.
Friends, push the like button, write a comment, and share with your mates - that would be the best THANK YOU.
P.S. I personally will open entry if the price will show it according to my strategy.
Always make your analysis before a trade.

Vet usdt - Buy Hello traders
See vet / usdt Chart
There are two patterns
Cups and triangles
If the triangle pattern is done
And break the downtrend line
You will have Target 3.4
And if the comp pattern is done, Target 2.4

VET/USD ChartWhat a day for crypto, the total market is up 8.5%, and my previous BTC prevision is starting to make sense (check it out, I might post another
BTC chart later). Vet is up 20% today, so it might get a drop in a next few days, but the predictions are still very bullish. A new ATH seems umprobable because if the market starts to get overvalued coins like VET will be sinking. Being greedy with profits is never a good thing. If your plan is to hold for +5 years the trading perspective doesn't really matter right now, but for a mid-short term investor a 2-5X your inicial investment in VET is so good so just take the profit before the next bear market. Keep in mind that I'm not a financial advisor, and that just my opinion. Comment, like and follow.

VET - VECHAIN; PT 2; see pt1 success, the final stageVET - VECHAIN; PT 2; see pt1 success, the final stage
The final acts are near. Prepare yourself.
See part 1. I am refining this one a lil, reducing top options a bit.
Good luck on the EXIT
VeChain / USD Fibonacci Analasys 🎯I HAVE TWO SENARIO FOR ALMOST NEXT YEAR
The targets is bullish, but at different times we will see the influx of buyers near the new year, So which is indicated in the chart.
Please share your opinion with me in the comments. 🙏✌

VET/USD $2.50 on the next leg? (Weekly Perspective)VETUSD to $2.50 on the next leg? (Weekly perspective)
Great project. Great team. Extremely bullish in the long term.
What do you guys think?

VeChain (VET) - September 27Hello?
Welcome, traders.
By "following", you can always get new information quickly.
Please also click "Like".
Have a nice day.
-------------------------------------
(VETUSD 1W Chart) - Medium to Long-Term Perspective
Above the 0.03981204 point: the uptrend is sustainable.
Above 0.06265984 point: Expected to create a new wave.
(1D chart)
First support section: 0.06265984-0.08458101
Second support section: near point 0.03981204
First resistance section: 0.12610267-0.14187200
Second resistance section: 0.20955073-0.22890460
A move to break above the first resistance zone should be checked to see if there is a sideways movement within the support zone.
In particular, you should see if the volatility around September 28 (September 27-29) is moving upwards above the 0.09110688 point to break out of the downtrend line.
--------------------------------------
(VETBTC 1W Chart) - Mid to Long-Term Perspective
Above the 136 Satoshi-158 Satoshi section: The upward trend is sustainable.
(1D chart)
First support section: 177 Satoshi-193 Satoshi section
Second support section: 136 Satoshi-158 Satoshi section
It is necessary to check whether it can rise above the volume profile section formed near the 221 Satoshi point.
Therefore, it is necessary to check whether the price is maintained above the 221 satoshi-237 satoshi section.
------------------------------------------
We recommend that you trade with your average unit price.
This is because, if the price is below your average unit price, whether it is in an uptrend or in a downtrend, there is a high possibility that you will not be able to get a big profit due to the psychological burden.
The center of all trading starts with the average unit price at which you start trading.
If you ignore this, you may be trading in the wrong direction.
Therefore, it is important to find a way to lower the average unit price and adjust the proportion of the investment, ultimately allowing the funds corresponding to the profits to regenerate themselves.
------------------------------------------------------------ -----------------------------------------------------
** All indicators are lagging indicators.
Therefore, it is important to be aware that the indicator moves accordingly with the movement of price and volume.
However, for the sake of convenience, we are talking in reverse for the interpretation of the indicator.
** The MRHAB-O and MRHAB-B indicators used in the chart are indicators of our channel that have not been released yet.
(Since it was not disclosed, you can use this chart without any restrictions by sharing this chart and copying and pasting the indicators.)
** The wRSI_SR indicator is an indicator created by adding settings and options to the existing Stochastic RSI indicator.
Therefore, the interpretation is the same as the traditional Stochastic RSI indicator. (K, D line -> R, S line)
** The OBV indicator was re-created by applying a formula to the DepthHouse Trading indicator, an indicator disclosed by oh92. (Thanks for this.)
** Support or resistance is based on the closing price of the 1D chart.
** All descriptions are for reference only and do not guarantee a profit or loss in investment.
(Short-term Stop Loss can be said to be a point where profit and loss can be preserved or additional entry can be made through split trading. It is a short-term investment perspective.)

VET MASSIVE GAINS COMING? Potential buyzone is marked!VET might retest the buyzone mentioned and bounce from there, great to place some entries.

Vechain(VET) Update 23/09/21: Road back to ATHVechain is currently fighting some heavy resistance at the 23.60% Fibonacci level. From here we can expect a break above this level, and if the bullish momentum continues we could see VET pushing past the 38.20% fibonacci level @ $0.14 (42% Gain from the current price level) . Due to the bear trap in the market we have seen all ALTS make a similar corrective chart pattern, we can expect the recovery to be a quick as the flash crash experienced during this week. Please see previous analysis below. Happy Trading :)
Vechain(VET) Update: 220% Gain from Buy Zone..Next Stop $0.28. Vechain has tested the 200SMA and broke above showing strong signs of bullish momentum. There is potential 220% Gain from Buy Zone @ 23.60% Fibs to the ATH @ $0.28. Vechain is 62% up from the Buy signal triggered by the swing call script. From here we may have a small cool off period as VET is currently fighting some resistance at the 38.20% Fibonacci level. So far VET has gained +115% over the past 30 days and +45% over the past 7 days, we can expect continued momentum as the alts continue to slowly wake up and rise. Please see previous analysis below. Happy Trading :)
Vechain(VET) Update 07/ 05 /21: 40% Gain from current price level to 127.20 Fibonacci extension @ $0.33. See previous analysis below
Vechain(VET) Update 27/04/21: 228% Gained from our Buy Zone 4 from the 4th April to 16th April...Next Stop $0.33 from Buy Zone 5 which is an 81% Gain from 50.0% Fibonacci retracement level. Lets take advantage of the current prices as we will not be seeing these low prices for a long period of time once the Bulls are back in the market for the next push phase. Use the Buy Zones to map your Buys or simply for dollar cost averaging. The Fundamentals are great for this project and we are very bullish on Vechain and can see EOY price target between $2 to $5. See previous analysis below. Happy Trading :)
Vechain(VET) Update 05 /04/21: VET perfect bounce from Buy Zone 4 37% Gain to $0.11. See previous analysis below.
Update 30/03/21
Vechain(VET) looks ready for another 37% Gain to $0.11. Since the 27th March Vechain has been consolidating between $0.087 & $0.097 range. Stochastics are now showing an oversold market and VET looks ready for continued Bullish momentum to the upside. Be patient with your entry as we expect VET to test the 78.60% Fibonacci level before confirmation of a move towards our target at the 127.20% Fibonacci level @ $0.11. Failure to test the 78.60% Fibonacci would see a 12% Gain from the current level to the previos ATH tested on the 22nd March @ $0.10.
Use the Buy Zone ($0.088) to map your entry if you are not already riding the current wave, from here you can DCA to accumulate more coins, 37% Gain to our $0.11 price target.
See previous analysis below. Happy Trading :)
$VET #Hodl
Update 23/03/21
Vechain(VET) looks ready for another 46% Gain to $0.11 at the 127.20% Fibonacci level. Stochastics on 4H showing an oversold market at this price level. On 22 March VET reached $0.10 on the Binance exchange. Since reaching this price level, the price broke below the 13 EMA and 50 SMA as the profit takers came into the market after 21 days of this strong bullish continuation pattern. Although we have broke below both 13 EMA and 50 SMA , overall VET is still bullish and we can expect a bounce from the price pushing above the 50 SMA but be patient as they may be more profit takers in the market. There is a high probability the Bulls will take back control and continue to keep pushing the price higher. Currently VET is showing signs of a weak retracement just below the 78.60 Fibonacci level. Use Buy Zone 3 to map out your Buys from here and if the 13 EMA crosses below the 50 SMA , we will be looking to DCA and Accumulate between the 61.80% to 50% Fibonacci level. From the 61.80% Fibonacci level we expect a 57% Gain to the 127.20% Fibonacci level, this would be the worst case scenario if we get a stronger retracement. See below previous analysis of a new ATH target @ $0.14 as this is the best case scenario from here. Happy Trading :)
Vechain Monthly Outlook Update 23/03/2021
Vechain(VET) Explosive Move New ATH Target, 62% Gain to $0.14, we are very confident this new price target will be reached over the next coming days/week(s). Stochastics showing an oversold market on the 4h
*Update Vechain Outlook 20/03/21*
Vechain is still on course to our 127.20% Fibonacci level, beautiful continuation pattern. Some great Buy Zones to DCA in this channel. New Target @ 161.80 Fibonacci, lets ride this wave to $0.11, 24% Gain from current price level.
Vechain dropped into the perfect Buy Zone zone to enter if you’re not yet in or want to dollar cost average if you’re already riding the current wave. Happy Trading :) See previous analysis below.
*Update Vechain Outlook 18/03/21*
Road to $0.10 is clear, we are still in a strong continuation pattern in search of new ATH at the 127.20% Fibonacci level in the short term. Use Buy Zone 3 to set up your buys, perfect sniper entry would be at the 78.60% Fibs (33% Gain to 127.20 Fibs). Watch for price action as we may see a small retracement down to test the 50 SMA just below the 78.60% Fibs before pushing to the upside towards the $0.08 price level and further $0.10 (40% Gain to 127.20% Fibs).
*13/03/21*
Vechain's price soared to a new ATH on 12/02/21 reaching $0.606 on the Binance exchange. Following the new ATH there was a small retracement before trying to push past the resistance set at ATH , but this failed to break on 19/02/21 and was met with huge selling pressure at these price levels, retracing down further, quite sharply after 4 days on 23/02/21 touching the 50 SMA on the daily chart with a low of $ 0.0341. The downward pressure was met with a sharp bounce on the 50 SMA recovering in a day 24/02/21 back to the 38.20% Fib retracement level showing strong signs of Bulls still in the market. As of the past 3 days the price has been consolidating between a small range between the 38.20% Fibonacci retracement levels and 23.60%. Further to note the price on 2 occasions has tested to break below the 50 SMA failing twice signalling strong bullish pressure and signs of the Bulls to continue driving the current price to test the ATH yet again whilst also setting the sentiment of a possible new ATH at the 127.20% Fibonacci retracement level @ $0.0702.
Furthermore the 200 SMA has been tested at 3 occasions on the 4H Chart, failing to break past this level. Vechain is in a perfect zone for Buys back towards the ATH . Stochastics on the Daily chart signal an extremely oversold market so expect Vet to push back 55% back to ATH levels and Further 74% to 127.20% Fibonacci with the potential to set a new ATH in the coming days to weeks in March.
The Fundamentals are great for this project and we are very bullish and can see EOY price target between $2 to $5. Buy Zone 1 @ 23.60% Fibonacci retracement level for the perfect sniper entry. Be patient, wait for confirmation before entering any buy. Happy Trading :)

VET/USDT best entry for long and spot.If VET/USDT able to hold the support at $ 0.098 you can take a good long and spot entry. But first do your own research.

VET/USDT BINANCEVET/USDT BINANCE
1D hollow candlesticks
After a price dump came from the symmetrical triangle, a candlestick hammer seems to form.
Until the daily candle ends, we can't tell for sure that will happen.
As it seems a Cypher has formed, so a price rebound will follow, as the aqua-colored path shows.
Also, this path is more clear in this dis ascending - a bullish falling wedge that has formed from a symmetrical triangle.
The next resistance will be at the last two Fibonacci retracements golden ratios.
If MACD bullish crossover occurs, it will confirm the movement of the path.
The steady volume shows HODL.
VeChain Price (VET) = $0.08826 -0.95%
0.00000211 BTC -1.18%
0.0000311 ETH +0.86%
Good Luck
CryptoHellas Team

$VET VECHAIN POTENTIAL WAVE IN THIS BULLRUN (LASTCALL)BINANCE:VETUSDT
Vechain VETUSDT still look bullish while they keep in bullish channel
the potential WAVE 5 will touch at fibonacci level 2.414, 2.618 or 3.
(not financial advice)


VETUSD Spot Trade Idea - VeChain
Entry: 0.11000
Take Profit: 0.12200
10% Profit In and Out and the trade is done in a few days even shorter.
I use the 1HR charts for these trades.
Saturday 18th Sep/21. Bitcoin just did a lower low to $47600. This is the first video I ever published on TradingView. Suggest any improvements below thank you. I watch markets 24/7.
This is just a basic buy and sells trade! Est a day or a few days/weeks.
Though HODL as long as you want.
Jaffasoft Signals:
See me on Twitter as Jaffasoft and Etoro for the performance of a publicly shared portfolio.
Disclaimer: You must understand trading has risks and this is not financial advice.
