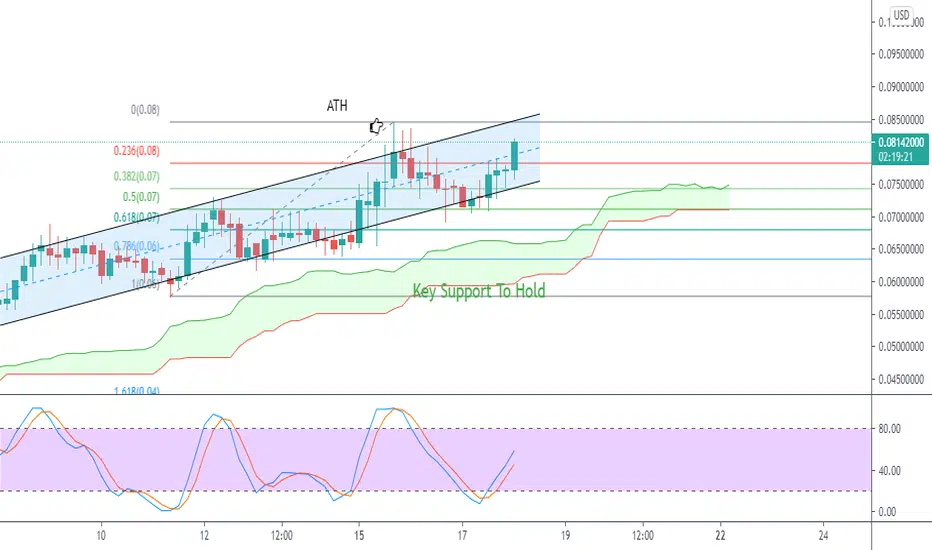
Vechain Looking FantasticVET undoubtedly has the best looking chart out right now on the month, we have had a very steady climb and recently have made New ATHS and hanging out in price discovery mode, for the short term (next day or two) i think there is going to be some profit takers and a little bit of selling on vechain. Our stoch RSI has been hovering around the overbought area and has now shot up into that zone. we also see the Wave Trend Oscillator is pushing into the top zone. We could possibly see a little bit of a cool off bringing us down to maybe the 0.2 FIB but i doubt we would see price go any further than that, Our EMA ribbons are showing no signs of cooling down, they are pointing up and actually starting to open up even more. Overall super bullish on Vechain we have been seeing lots of institutional adoption and attention and i believe a lot of people are starting to realize what VET is and what the ecosystem is providing! Remember the past week we have seen overall very red days in the crypto market yet VET was still shining showing its strength! If we do see a little cooloff dip i dont think itll last for long then we can continue the push up! NFA just my opinion
Vetusd

[20%] VET / USDTWhat Is VeChain (VET) ?
VeChain (VET) is a blockchain-powered supply chain platform. Begun in 2015 and launched in June 2016, VeChain aims to use distributed governance and Internet of Things (IoT) technology to create an ecosystem which solves some of the major problems with supply chain management.
The platform uses two in-house tokens, VET and VTHO, to manage and create value based on its VeChainThor public blockchain.
The idea is to boost the efficiency, traceability and transparency of supply chains while reducing costs and placing more control in the hands of individual users.

VET/BTC Running Rampant Price trading above 100EMA ribbon volume leader 3/21 looking to make new highs

Update for Vechain(VET) Explosive Move Back To ATH and beyond*Update Vechain Outlook 20/03/21*
Vechain is still on course to our 127.20% Fibonacci level, beautiful continuation pattern. Some great Buy Zones to DCA in this channel. New Target @ 161.80 Fibonacci, lets ride this wave to $0.11, 24% Gain from current price level. Happy trading :)
*Update Vechain Outlook 18/03/21*
Road to $0.10 is clear, we are still in a strong continuation pattern in search of new ATH at the 127.20% Fibonacci level in the short term. Use Buy Zone 3 to set up your buys, perfect sniper entry would be at the 78.60% Fibs (33% Gain to 127.20 Fibs). Watch for price action as we may see a small retracement down to test the 50 SMA just below the 78.60% Fibs before pushing to the upside towards the $0.08 price level and further $0.10 (40% Gain to 127.20% Fibs).
*13/03/21*
Vechain's price soared to a new ATH on 12/02/21 reaching $0.606 on the Binance exchange. Following the new ATH there was a small retracement before trying to push past the resistance set at ATH , but this failed to break on 19/02/21 and was met with huge selling pressure at these price levels, retracing down further, quite sharply after 4 days on 23/02/21 touching the 50 SMA on the daily chart with a low of $ 0.0341. The downward pressure was met with a sharp bounce on the 50 SMA recovering in a day 24/02/21 back to the 38.20% Fib retracement level showing strong signs of Bulls still in the market. As of the past 3 days the price has been consolidating between a small range between the 38.20% Fibonacci retracement levels and 23.60%. Further to note the price on 2 occasions has tested to break below the 50 SMA failing twice signalling strong bullish pressure and signs of the Bulls to continue driving the current price to test the ATH yet again whilst also setting the sentiment of a possible new ATH at the 127.20% Fibonacci retracement level @ $0.0702.
Furthermore the 200 SMA has been tested at 3 occasions on the 4H Chart, failing to break past this level. Vechain is in a perfect zone for Buys back towards the ATH . Stochastics on the Daily chart signal an extremely oversold market so expect Vet to push back 55% back to ATH levels and Further 74% to 127.20% Fibonacci with the potential to set a new ATH in the coming days to weeks in March.
The Fundamentals are great for this project and we are very bullish and can see EOY price target between $2 to $5. Buy Zone 1 @ 23.60% Fibonacci retracement level for the perfect sniper entry. Be patient, wait for confirmation before entering any buy. Happy Trading :)

Crazy VET/USD channelLook for a potential retrace to around $0.085, if it holds, we continue pattern.

Vechain Bull Cycle View For the next few weeksIt's all in the chart
#This is not an investment advice

VET: This breakout should have wind behind its backVET attempted a breakout of resistance on Feb 20, but unfortunately, the crypto market was in correction mode. Now, it looks like cryptos are ready for at least a mini rally and VET is one of the leaders. First target for VET would be the 4.618 extension from the circle wave 1 high which is about 0.102.

VETUSDT is NOT bad for a small profitHello my friends. Look at VET and keep in your watchlist for a small TP. Good luck
If its useful like it please as a support and follow me for next analysis :D

VET pushing for ATH and price discovery!after having a short cool off VET has started to move again aprx. 5% upwards and we have no resistance left until the ATH. Our ichimoku cloud bringing us support and is starting to curl to the upside, Stoch RSI is around the middle of the neutral zone. When we reach our ATH i think we have a chance of getting rejected the first time but we should be able to breakthrough on the next ones. Creating a new ATH and putting VET back into price discovery mode! NFA just my opinion
Update Vechain(VET) Explosive Move New ATHs 30% Gain to $0.10 *Update Vechain Outlook 18/03/21*
Road to $0.10 is clear, we are still in a strong continuation pattern in search of new ATH at the 127.20% Fibonacci level in the short term. Use Buy Zone 3 to set up your buys, perfect sniper entry would be at the 78.60% Fibs (33% Gain to 127.20 Fibs). Watch for price action as we may see a small retracement down to test the 50 SMA just below the 78.60% Fibs before pushing to the upside towards the $0.08 price level and further $0.10 (40% Gain to 127.20% Fibs).
*13/03/21*
Vechain's price soared to a new ATH on 12/02/21 reaching $0.606 on the Binance exchange. Following the new ATH there was a small retracement before trying to push past the resistance set at ATH , but this failed to break on 19/02/21 and was met with huge selling pressure at these price levels, retracing down further, quite sharply after 4 days on 23/02/21 touching the 50 SMA on the daily chart with a low of $ 0.0341. The downward pressure was met with a sharp bounce on the 50 SMA recovering in a day 24/02/21 back to the 38.20% Fib retracement level showing strong signs of Bulls still in the market. As of the past 3 days the price has been consolidating between a small range between the 38.20% Fibonacci retracement levels and 23.60%. Further to note the price on 2 occasions has tested to break below the 50 SMA failing twice signalling strong bullish pressure and signs of the Bulls to continue driving the current price to test the ATH yet again whilst also setting the sentiment of a possible new ATH at the 127.20% Fibonacci retracement level @ $0.0702.
Furthermore the 200 SMA has been tested at 3 occasions on the 4H Chart, failing to break past this level. Vechain is in a perfect zone for Buys back towards the ATH . Stochastics on the Daily chart signal an extremely oversold market so expect Vet to push back 55% back to ATH levels and Further 74% to 127.20% Fibonacci with the potential to set a new ATH in the coming days to weeks in March.
The Fundamentals are great for this project and we are very bullish and can see EOY price target between $2 to $5. Buy Zone 1 @ 23.60% Fibonacci retracement level for the perfect sniper entry. Be patient, wait for confirmation before entering any buy. Happy Trading :)

Great time to buy $VETVeChain, IMHO, is on the top 5 project out right now. It's disrupting supply chain technology is a big way and is extremely undervalued. This is a long term hold for me but I also like to play the channel swings.

VETUSD upcoming Targets Fib ChannelUsing the fib channel indicator, here are some possible take profit targets for VETUSD

VeChain Update ($VET)Vechain looking pretty good here.
MACD showing possible bullish crossing on the 1H timeframe.
100MA holding strong & $0.697 support cluster (green) also looks to be strong area we can POSSIBILY see.

1$ VET - Lets go!Please don't go by the title, to go to 1$ there is a lot of time and VET has to burn down their tokens. But still it is very bullish, actually very very bullish token and it should be bought and put in a cold storage. check their website to see there partners and work they are doing. With respect to BTC price also VET has reversed the trend bullish.

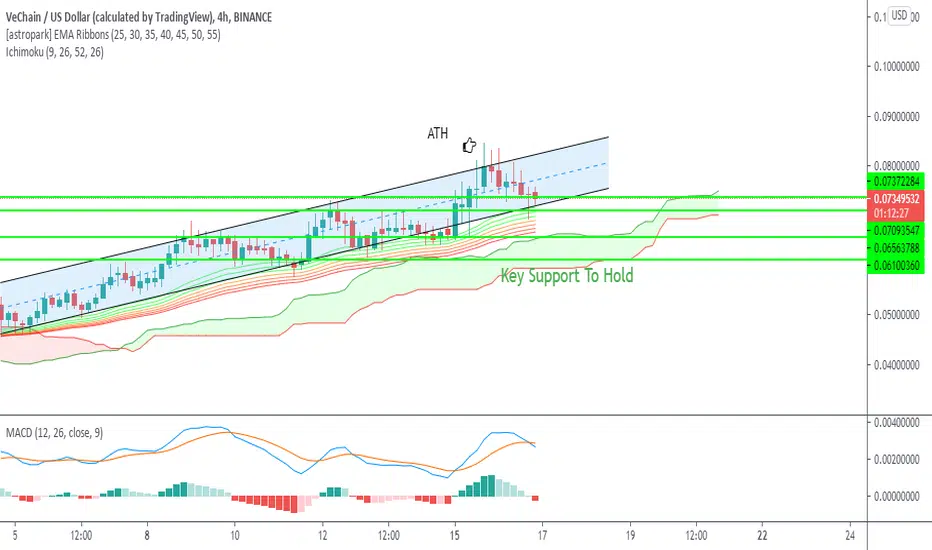
Vechain cooling off for nowWe saw an aprx 10% dip for vechain today but i believe we are just seeing a little cool off after a big run up. We are seeing price action touched down at the bottom of our ascending channel but has rebounded back up, currently we are pushing to come back above our support at 0.0737. I think short term we could see possibly a drop down to the 0.0709 support. our Macd has turned bearish for now and im looking for it to cross back over. EMA ribbons are still carrying bullish momentum and as of right now are starting to point a bit sideways and the ichimoku cloud support has been a little light but is still bullish and pointing up now. Overall still very bullish on VET just thinks it needs to cool off like it has been doing before continuing to fly up. Not Financial advice just my opinion.

VeChain - VETUSD Long price targetVET recently broke the ATH at $0.06250 and retesting the support.
$0.055 should hold as the support on a daily closing basis and the procie will then target 0.085-0.095 region in the coming weeks if not days.
I'm long since end of last year and will continue to do so atleast later part of this year.
Please note, this setup is for long term investment and not intraday trade for me.

VeChain - Huge Potential VeChain is one of the projects that appear to be most promising.
Uou can read a lot more her: medium.com
Technically the price has very nicely bounced off support and looks ready to claim a bigger piece of the pie.
Definitely in our liking.


Vet is booming Vechain pushing towards ATH, broke heavy downward resistance, our EMA ribbons are starting to point even higher up and the stoch RSI exploded off of the top of the oversold zone, looking for a break of the ATH in the coming days if we keep this up! Not financial advice, just my opinion

VET cooling off before next move.Vechain is looking like its cooling off a bit after our big run up. Im looking for the bulls to hold this support line we are currently holding, i believe we will we have nice support printing from the ichimoku cloud and our EMA ribbons are carrying us and pushing up with bullish momentum. The Macd is looking very bullish its starting to slightly point sideways like we are seeing with our recent candles. The stoch RSI is coming down from overbought and is about to enter back into our neutral zone. We could see some accumulation along this support for a little bit but if the bulls boost price up and keep us trading inside our ascending channel there is a good chance we will fly back up to our ATH levels. NFA just my opinion.


VET/USDT - Bullish W pattern approvedHello traders and community, today we will tell ourselves shortly about the situation of VET/USDT
Trend analysis
- As you can see from the VET/USDT daily chart , the price of VeChain is going upward cause of double bottom formation (white line) and already tested resistance level (first red line), that's why we can expect bullish movement in the following days with 70 % probability. I recommend to put long positions (possible scenario on the chart), but only when you see correct signal for this movement. Today's resistance level is on 0,072683 price level, support level is on 0.059543 price level and global trend stays bullish. Wish you good luck with VeChain!
Chart pattern
- Double Bottom pattern (processing)
Technical indicators
- RSI: market is still in boarders and is located near 69 level (not overheated, Neutral signal)
- MACD: MAs are prepared for upward movement + they get away from each other (Bull signal)
- BB: Volatility of the market started increasing after range movement accomplished (Bull signal)
- MA (10,20): MA10 is higher than the level of MA20 and going upward (Bull signal)
= Overall bullish signal movement
Dear friends, please push the like button, write comments below, follow me for more technical analysis and share this post with other traders - that would be the best support, Thank you for your attention!
Tell us about your opinion for making better decisions :)
P.S.: Information provided is only educational and should not be used to take action in the market.
