VeChain VET Busting out of Wedge at 618 SupportVeChain VET Busting out of Bullish Wedge at 618 Fib Support
Weekly timeframe
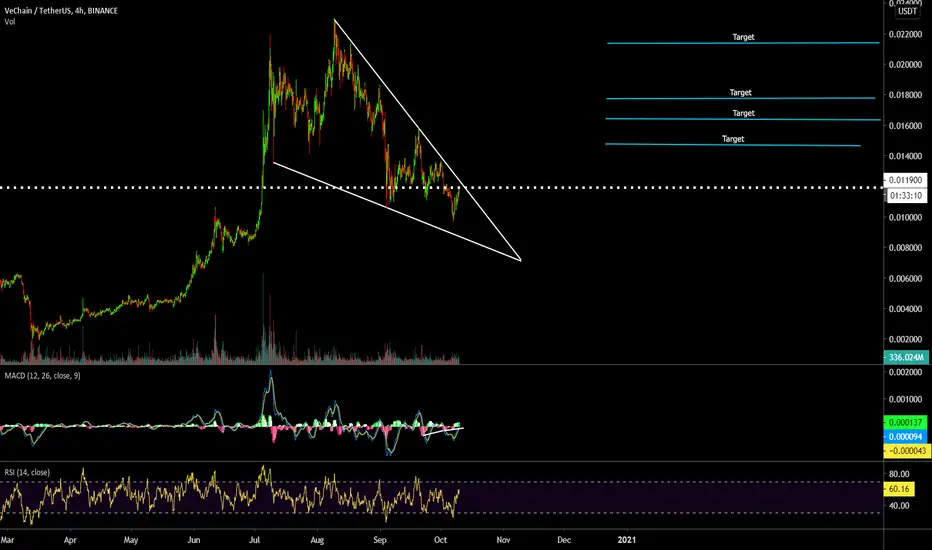
Vetusd

VET HAS THE ENERGY IN STOREwhen vet is ready to pop, it has plenty of energy in store
this coin should be one of the top movers in a bull market
N.F.A.

VET USDT | 1D chart | Long position | 44% profit + entry
BINANCE:VETUSDT
The price is more likely to hit the resistance one more time
Entry Price: 0.010377
Take profit: 0.015076
Posible gain: 44%
What do you think about this strategy, share your comments below;
Make sure to subscribe!
If you enjoyed this Idea hit the Like button and support us!

VETUSDT forming higher high outside of months long consolidationLetting the chart speak for itself. Target/resistance levels already marked.

Vechain (VET) Has Broken Out The WedgeHey friends, hope you are well and welcome to the new update on VeChain Coin.
On daily chart the priceline of VET coin was moving in a falling wedge. Finally the price action has broken out the resistance of this pattern. The volume profile is showing very low interest of the traders in the area where the priceline is moving therefore the price action can move more up in the area where the trader’s interest is strong. Once the exponential moving average 10 will cross up the EMA 21 then a further bullish momentum will be confirmed and move buying volume will be entered.
On the long term weekly chart after a strong bullish move the priceline is retraced at 0.618 Fibonacci retracement level an likely to re-test the ichimoku bearish cloud as support. The conversion line is moving down to form bear cross with baseline but lagging span is again moving up therefore we can expect that soon the conversion line will be moved up that will be strong buying signal for the long term rally.
On the daily chart different short and mid term support and resistance levels can be seen. The priceline is moving between $0.011 and $0.015 support and resistance level. At the moment candlesticks are trying to breakout $0.015 resistance. Once this resistance will be broken out then a move upto $0.018 resistance is expected very soon.
Conclusion:
As the price action of VET coin has broken out the resistance of wedge but the buying volume is not as that much powerful that can give us confirmation that it is not a fake-out. However, if we will see the weak buying volume with continuity and the EMA 10 will cross up the EMA 21 then we can have the confirmation of a firm breakout. And in case of this bull cross between these two EMAs 10 and 21 we can expect a rally upto $0.018 very soon and in case of breaking out this resistance the price action can move upto $0.021 powerful resistance.

VETUSDT Weekly Inside Bar Forming at SupportLast week's candle was a bullish pin bar. We might see another bullish pin bar this week, along with a possible inside bar pattern
Little choice for the market but to break out. Question is, which direction? :)
PS. Still a few hours to go before the weekly close so let's see if we do see an inside bar pattern here.

Tentatively bullish on VET. VETUSDVery tentatively. It appears we had a nice upshot >1.68 of Wave C and a nice deep retrace on that, and then another what appears to be a 1-2 pattern, landing on higher lows. Hence, I am tentatively watching this space. A bit early to look for targets, but that too might change.

VET/USDT - A very BULLISH long term outlook on Vechain.After some previous ideas of trying to find the bottom with Vechain, I've decided to wait until a better set up arrives. Now that we've been waiting for some time now, we now have a lot of different patterns that could potentially give us a Blue Sky Breakout , one of the most fun breakout patterns in a ticker.
Some of the patterns are a broadening top pattern, something that is similar to the SPX, this could either mean life or death for a ticker but in this case we have a bullish Falling Wedge pattern that gives us confluence that this broadening top pattern could be used as a bullish setup. This will mean that we need to watch resistance breakouts at 0.023 to 0.0267 levels to confirm this case. Another bullish confluence is the nice bounce off the monthly trendline and CAM R4, a bounce off CAM R4 is a big telltale sign of bullish continuation which adds on to the breakout of the falling wedge pattern.
If these bullish patterns are confirmed then we'll be able to see a fun ride above the blue sky breakout levels. I will also keep an eye on other VET pairs, more importantly VETBTC and VETETH.
Leave a like/comment if this idea helped you at all!
I am not a financial advisor, trade at your own risk.

VETUSDT closing the week on a bullish note?A weekly close near the weekly candle high would be welcome development and should be great bullish signal considering where we currently are.
Context is everything and right now, we are at a good place to launch! As long as that 0.01 level holds, we are good to go!

Vet/usdt the breakout is very soonBuy the break or retest
Stoploss daily close below 0.00999$
Targets in chart (red)
Good luck


Vet/btc Vechain consolidation in the demand zoneI posted a few days later my idea when vechain is
119-120 sat
I expected it to drop in the demand zone shown in chart between 95-108sat
That what happened as i expected
See here my previous idea
Now it shows consolidation in that area
Which is a good potential for next move
But we will entry after break and close above the trendline resistance for more confirmation


Vetusdt time to move bullishVetusdt time to move vet set up lovely, bullish divergence on Macd targets posted
VET/BTC (Testing Key Level Resistance)💎Technical Analysis Summary💎
BINANCE: VETBTC
-VeChain is testing the previous Key Support area
-This current zone is a confluence of Resistance>Suppport
-If VET can break above and consolidate
-That would be a Bullish sign of strength
-But a fail attempt will lead to further downside action
-So please always plan your trade
A big Thanks for donating 💰 via Tradingview coins this week to ahancock 🙏🎉
``````````````````````````````````````````````
Trading Involves High Risk ⚠️
Not Financial Advice 💸
Please Exercise Risk Management 💱
``````````````````````````````````````````````
Thank You All!🙏😊💖For Supporting My Channel 📺
Through Leaving A Thumbs Up, Comment & Follow 💬
Happy Trading!😊💕💖
``````````````````````````````````````````````

Sell Zone and Targets for VeChain VET/USDT $VETMy sell zone and target for VeChain. I belive VeChain is putting in a bear flag right now. A break above the resistance would invalid this set up.
(Not financial advice)

VETUSDT 2-legged pullback complete?Weekly chart is clearly showing 2 legs down from the AUG high. Context is good for a leg up from here on but the bulls need to hold 0.01 on a weekly close to increase likelihood of a move up in the short term.

VETUSDT: VeChain Chart UpdateHere are the structures and levels I am watching.
Still in a pullback from that August high. Needless to say 0.01 is key level here and a bounce here would not be unreasonable given how the market has performed against the level in the past 5 weeks.
Let's see if the bulls can hold the level in a weekly closing basis.
Weekly chart:

BULLISH ON VET. Highly OverSold!VET Very Much OverSold!
Definitely A Shakeout, Playing Around The 200MA
Potential Spring Incoming. We Are Nearing The End Of Accumulation Phase.
An Opportunity To Buy Back At These Levels. Breaking Point Level Indicated
LET ME KNOW WHAT YOU THINK! 🧐
💡 IF YOU LIKE MY IDEA, PLEASE HELP AND SUPPORT MY CHANNEL BY
HITTING THE THUMBS UP, LEAVING A COMMENT AND FOLLOWING 💯
*You are Welcome to Request Chart Analysis at Anytime! Simply Comment Down Below or DM Me :)
````````````````````````````````````
⚠ DISCLAIMER:
Trading Involves High Risk! I Share My Trading Positions And Ideas With You For FREE
BUT Please Be Responsible For All Your Actions.
This Chart is Used for Educational Purposes Only And NOT A Recommendation to Buy or Sell the Asset.


VETBTC - Flickering green light ?It seems that we will see a price increase..
RSI and STOCH are risen from the bottom.. ROUND 100 satoshi number + static support on this zone
I opened a small long position.. waiting for confirmation to re-entry or close position,
Set SL on 98
Risk/Reward ~ 1/3


Vet/usdt break soon ?Analysis on vet against tether
Good and simple chart
Buy the break/ retest
Sell area is also shown in fib resistances
*** strong support around 0.010500 - 0.011225
Daily close below that level
then this idea is invalidated
Want to see my analysis on vet against btc
I posted it last week
Look here at the chart
