VET/USD Main trend. Accumulation / distribution. Pivot zonesThe main trend. Logarithm. Time frame 1 week.
This time frame is more for orientation, where the price (area to work or monitor now) is in the main trend and what is the potential for price decrease/increase from its values now. The exception, this work and analysis is for investors and position traders with large capital, who are not interested in short-term and medium-term price movements for a small %.
The average prices of the accumulation and distribution zones of the last cycle are marked. Previously actively traded this coin, the previous ideas fixed under this trading idea.
Secondary trend — downward wedge.
Local trend — a potential double bottom in the case of holding the existing support.
Decrease from the price peak -91%.
Profit from the average price of the last accumulation +320% at the moment.
Short work .
I would like to point out that the coin, unlike many cryptocurrencies, is in substantial profit. In case the existing support breaks through, there is a prospect of shorting to the designated reversal zones.
Work in the long.
I have marked the reversal zone support levels and percentage of them to the resistance zones.
Linear chart. Time frame is the same.
Secondary trend.
Vetusd

VET/USD Secondary trend. Wedge. Pivot zones.The secondary trend. Logarithm. Time interval: 3 days.
Secondary trend — downward wedge.
Local trend — a potential double bottom in the case of holding the existing support.
Decrease from the price peak -91%.
Profit from the average price of the last accumulation +320% at the moment.
Short work.
I would like to point out that the coin, unlike many cryptocurrencies, is in substantial profit. In case the existing support breaks through, there is a prospect of shorting to the designated reversal zones.
Work in the long.
I have marked the reversal zone support levels and percentage of them to the resistance zones.
Linear chart. Time frame is the same.
Local area of double bottom 40%
Major trend. Time frame 1 week.
VET/USD Main trend.Accumulation/distributionPivot zones

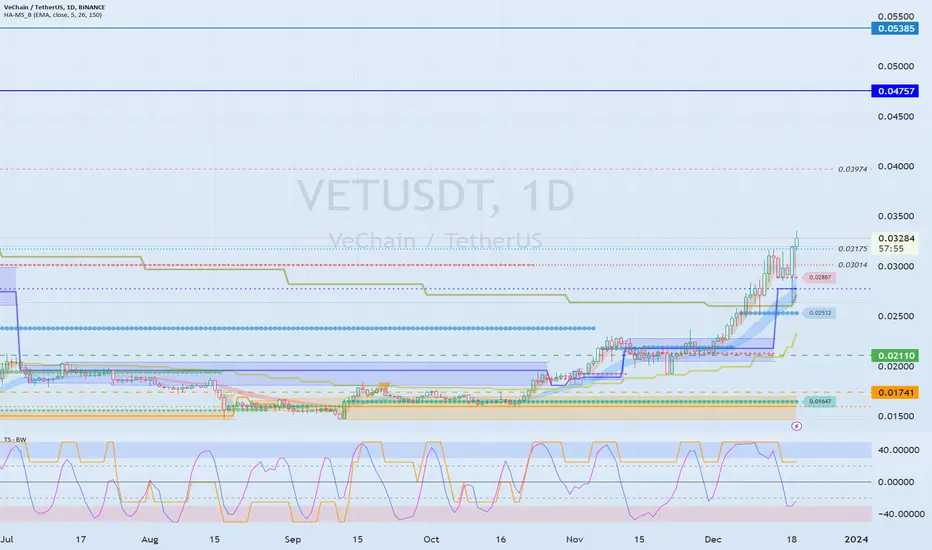
The key is whether the price can be maintained above 0.03175Hello traders!
If you "Follow" us, you can always get new information quickly.
Please also click “Boost”.
Have a good day.
-------------------------------------
(VETUSDT chart)
(1D chart)
As it rises above 0.02776, I think the possibility of a full-fledged upward trend has increased.
However, since the long-term moving average is still reversed, the key is whether the price can be maintained around 0.03175.
If that happens, it is expected to rise above 0.04757-0.05385 and escape the bottom range.
If it falls below 0.03014-0.03175,
1st: 0.02776
2nd: 0.02110
You need to check if you receive support near the first and second levels above.
--------------------------------------------------
- The big picture
The full-fledged upward trend is expected to begin when the price rises above 29K.
This is the section expected to be touched in the next bull market, 81K-95K.
-------------------------------------------------- -------------------------------------------
** All explanations are for reference only and do not guarantee profit or loss in investment.
** Trading volume is displayed as a candle body based on 10EMA.
How to display (in order from darkest to darkest)
More than 3 times the trading volume of 10EMA > 2.5 times > 2.0 times > 1.25 times > Trading volume below 10EMA
** Even if you know other people’s know-how, it takes a considerable amount of time to make it your own.
** This chart was created using my know-how.
---------------------------------
VETUSDT Good Buy!VETUSDT Technical anlaysis Update
BINANCE:VETUSDT price is breaking through its major resistance line with high volume. We can expect a 50-100% upward move in the medium term.
Buy zone : Below $0.0307
Stop loss : $0.0272
Always Keep Stop Loss
Regards
Hexa


VET ANALYSIS (4H TF)We are still on the green zone of the previous analysis. But according to the recent data we have on the chart, we can recognize an ABC wave that we are now inside a B wave, which is a diametric.
The g wave can end somewhere between the 0.718 fibo and 100% of the a wave. We have updated the green range compared to the previous analysis.
If the price returns to the green area, it is a buy/long opportunity.
For risk management, please don't forget stop loss and capital management
Comment if you have any questions
Thank You

Brief Analysis——VETVeChain is a smart contract platform focused on providing supply chain management solutions for enterprises and integrating with Internet of Things (IoT) devices to facilitate the process. VET is the Token of VeChain. On Sep.12, after Coinbase announced that it would list VET, VET increased for several days in a row. Apart from being listed on Coinbase, there are no additional benefits.
At the daily level, although the increase brought about by the listing is very strong, it has not recovered the earlier decline. Price fluctuations of 20% are common for VET. At a large level, VET has never been able to break through the yellow wavy range. After rising, VET remained fluctuating for nearly a month, during which trading volume returned to previous levels.
The MBF indicator showed a strong bottom-buying sentiment on Sep.13. The listing on Coinbase indeed attracted many traders to collect chips. We can also see this from the WTA indicator. When 4 consecutive candles appear, the blue whale participates in the transaction. However, it should be noted that after the increase ended, the price continued to fluctuate for a month, and the whale disappeared. In addition to the blue columns, the gray and red are also gone. Only retail investors are trading. This shows that the whale has taken profit. In recent days, we can see very short blue bars appearing while the price is indeed falling, which is not good.
The rise of VET may be over.
Disclaimer: Nothing in the script constitutes investment advice. The script objectively expounded the market situation and should not be construed as an offer to sell or an invitation to buy any cryptocurrencies.
Any decisions made based on the information contained in the script are your sole responsibility. Any investments made or to be made shall be with your independent analyses based on your financial situation and objectives.

VETUSD ❕ decline50EMA broke down 200EMA (1H TF)
VET has fixed under 50EMA (30m TF)
RSI near neutral values.
I believe that the price will continue to decline.

VET ANALYSIS (1D)In our opinion, the symmetrical pattern of VET is completed and branch I, which is the last branch, is finished. We are looking for buy/long trades on the green area

VETI think VET has bottomed. Is it possible this current retrace creates a new bottom? Sure. But currently, I don't think that will happen. If it does, I'll reevaluate.

VETUSD ❕ divergenceThe price and RSI chart formed a divergence.
The trading volume confirms the formed divergence.
I expect VET to decline.

Support range for short-term uptrend: 0.01599-0.01647Hello?
Hello traders!
If you "Follow" us, you can always get new information quickly.
Please also click “Boost”.
Have a good day.
-------------------------------------
(VETUSDT chart)
(1M charts)
In order to turn into an upward trend, the price must meet the HA-Low indicator, receive support, and rise above the MS-Signal indicator.
Therefore, the key is whether it can be supported and rise around 0.006085-0.008837.
(1W chart)
The key is whether it can be supported by rising above the HA-Low indicator, that is, above 0.01741.
Therefore, the key is whether it can receive support and rise around 0.01741-0.0211.
If not, it is expected to fall to around 0.004398.
(1D chart)
It shows an upward trend near the HA-Low indicator.
Accordingly, the key is whether it can receive support and rise around 0.01599-0.01647.
To do this, we need to check whether we can break upward through the downward trend line and the M-Signal indicator on the 1W chart.
1st: 0.0197
2nd: 0.02382
You need to check whether you can receive support and rise near the 1st and 2nd levels above.
If the price rises above the MS-Signal indicator and maintains the price, there is a possibility that it will turn into an upward trend.
-------------------------------------------------- -------------------------------------------
** All explanations are for reference only and do not guarantee profit or loss in investment.
** Trading volume is displayed as a candle body based on 10EMA.
How to display (in order from darkest to darkest)
More than 3 times the trading volume of 10EMA > 2.5 times > 2.0 times > 1.25 times > Trading volume below 10EMA
** Even if you know other people’s know-how, it takes a considerable amount of time to make it your own.
** This chart was created using my know-how.
---------------------------------

VETUSD Flat IdeaIn my point of view Vet is running a running flat correction from the beginning. In present it is running the final leg. Let's see whether the supercycle wave 5is truncated or not. If 0.218 area broken and started pumping the 5th wave has truncated and a new wave has started. Unless that we can expect further downward movement. Currently wee are in the leading diagonal of cycle wave

One last dump before big moveI think there will be one last dump before a big rally on vechain. can see the bottom in october-november

VETUSD ❕ fixed above the supportTD Sequential has formed an up reversal signal on the 1H TF.
VET broke up through 50EMA (1H TF)
I believe the asset will continue to bounce after fixing above the resistance level.

VET and the Impressive 640 risk to reward opportunity Hi Everyone;
today we have one of the best risk to reward Investment opportunity
it is more than 640 times the risk and the chart is look very promising.
I expect breaking the previous bear market key point will clear the way to the final target

VETUSD ❕ buyers are trying to strengthenVET fixed above 50EMA at 4H TF.
50EMA broke above 200EMA at 30m TF.
I believe that the asset will start rising after fixing above the resistance level.

Vetusdt.p long scenarioHi guys.
I think the direction of altcoins changes according to the direction of Bitcoin.
we set up a long scenario under the condition that Bitcoin's downside correction stops.
In rare cases, a symmetric triangle pattern may appear in wave 2 of Elliott.
If Bitcoin's downward correction is not over, it will rise again after checking the end of the line after breaking out of the symmetric triangle with the abc wave.
This is not a but&sell signal. good luck to you

Bottom range: 0.01840-0.02299Hello?
Traders, welcome.
If you "Follow", you can always get new information quickly.
Please also click "Boost".
Have a good day.
-------------------------------------
(VETUSDT chart)
In conclusion, VET is currently a buy time for the mid- to long-term.
Since the 0.01840 point or less is a long-term investment area, it is recommended to proceed when it shows sideways in the 0.01840-0.02299 section in order to proceed with the purchase from a mid- to long-term perspective.
Otherwise, if you buy below 0.01840, you will have a really tough time because you never know when the price will actually rise.
For more details, check out each chart below.
(1M chart)
From a long-term perspective, it is expected that a full-fledged uptrend will begin only when it shows support around 0.02695.
(1W chart)
Since the Bollinger bands have started to contract, the question is whether it can be supported near the HA-Low indicator on the 1W chart and rise above the HA-High indicator on the 1W chart.
So, we need to see if it can get support around 0.01858 and rise around 0.02355.
(1D chart)
The key is whether it can get support around 0.01797-0.01858 and rise above 0.01958-0.02062.
Therefore, it is important to be able to sideways within the 0.01797-0.02062 interval.
In that sense, the volatility period is around August 3-17.
-----------------------------------------------
Of the many indicators or lines displayed on the chart, the most important are the horizontal lines that mark points of support and resistance.
Trading is to create a trading strategy and respond to it according to how it moves on these horizontal lines.
Therefore, in order to mark the points of support and resistance, you need to look at the 1M, 1W, and 1D charts in order and mark the points of support and resistance.
This is because support and resistance points are the strongest lines drawn on the 1M chart.
Therefore, other indicators or lines are not directly related to the trading strategy as they are supported or resisted at support and resistance points and are viewed from a trend perspective.
The reason why several lines are drawn on the chart in advance is that the positions of support and resistance points may change each time you see them depending on price volatility or your own psychological state.
Since this can cause fatal problems in creating a trading strategy, support and resistance points must be marked based on objective data.
-------------------------------------------------- -------------------------------------------
** All descriptions are for reference only and do not guarantee profit or loss in investment.
** Even if you know other people's know-how, it takes a considerable period of time to make it your own.
** This is a chart created with my know-how.
---------------------------------

VET ANALYSIS (4H)Hi, dear traders. how are you ? Today we have a viewpoint to BUY/SELL the VET symbol.
For risk management, please don't forget stop loss and capital management
When we reach the first target, save some profit and then change the stop to entry
Comment if you have any questions
Thank You

VETUSD ❕ rising chartVET has fixed above 50EMA at 4H TF.
50EMA broke above 200EMA (30m TF)
RSI is moving in the buying zone.
I believe the asset will continue to rise.

VET VeChain Falling Wedge Pattern Vechain (VET) currently finds itself at the end of a falling wedge pattern, which could potentially indicate a bullish reversal in the near future. This technical pattern suggests that selling pressure has been gradually decreasing, while buyers may start to regain control.
Considering this chart pattern, there is a possibility of a technical rebound for Vechain, with a potential target price of $0.022.
Looking forward to read your opinion about it!

VETUSD ❕ bullish movementPrice broke up 50EMA (4H TF)
50EMA breaks up 200EMA (1H TF)
RSI chart moves above 50 points (4H, 1H and 30m TFs)
I believe that the asset can rise after it overcomes resistance.
