TradeCityPro | VET Battles Key Resistance Amid Buyer Momentum👋 Welcome to TradeCity Pro!
In this analysis, I’m going to review the VET coin for you. VET is a Layer1 and RWA project with a market cap of 1.84 billion dollars, currently ranked 44 on CoinMarketCap.
⏳ 4-Hour Timeframe
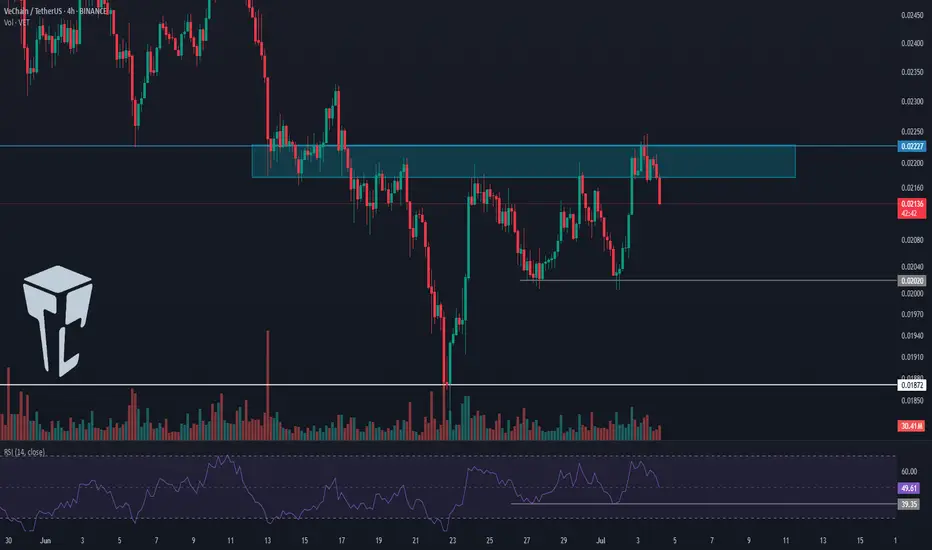
On the 4-hour timeframe, as you can see, this coin experienced a downtrend and eventually reached the 0.01872 bottom. It then received support from that level and began a bullish move.
✨ Right now, a significant resistance is located at 0.02227, which I’ve marked on the chart as a supply zone. So far, it seems the price has been rejected from this area.
🔍 Price has attempted to break this zone three times already. Each time, although it managed to penetrate further, it still failed to break through and got rejected.
💥 With each rejection, the RSI oscillator has also been rejected from near the 70 level and moved downward. If, in future attempts, the RSI enters the Overbuy area, the probability of breaking 0.02227 will significantly increase.
📊 Currently, market volume favors buyers. The buying volume on green candles has increased noticeably. Meanwhile, during the rejection from the resistance zone, the selling volume was very low, which signals strong buyer control.
⚡️ If the downtrend continues and price fails to form a higher low above 0.02020, we can enter a short position upon the break of 0.02020. A break of 39.35 on the RSI would be a solid momentum confirmation for this setup.
📉 The main short position can be opened upon the break of 0.01872. This would confirm the continuation of the downtrend and could lead to a sharp downward move.
📝 Final Thoughts
This analysis reflects our opinions and is not financial advice.
Share your thoughts in the comments, and don’t forget to share this analysis with your friends! ❤️
VETUSDT
#VET/USDT#VET
The price is moving within a descending channel on the 1-hour frame, adhering well to it, and is heading towards a strong breakout and retest.
We are experiencing a rebound from the lower boundary of the descending channel. This support is at 0.02086.
We are experiencing a downtrend on the RSI indicator, which is about to break and retest, supporting the upward trend.
We are heading towards stability above the 100 Moving Average.
Entry price: 0.02160
First target: 0.02226
Second target: 0.02274
Third target: 0.02344

VETUSDT 1W AnalysisVET ~ 1W Analysis
#VET Buy back gradually from here if you still have confidence in this coin with a short term target of at least 20%+ from here.
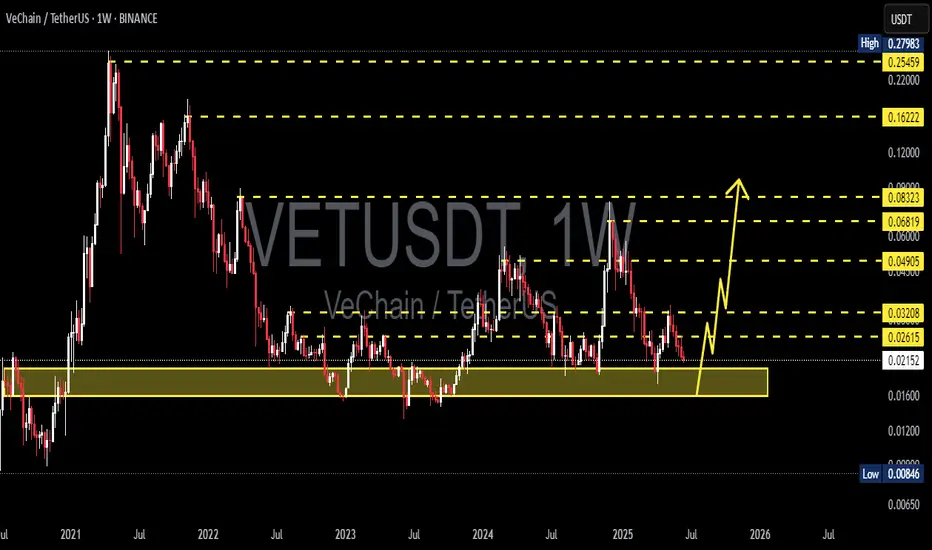
Vechain, Pick Your Own All-Time HighA mirror image from 2020-2021 would put a new all-time high for VETUSDT (Vechain) around mid-May 2026. Starts late ends late, right?
This is a great chart. Vechain hit bottom June 2023 and has been consolidating within a rising channel. A rising channel as in higher highs and higher lows. Now, this is bullish but still not a bull market but bullish consolidation.
Consolidation can happens in three different ways:
1) Purely sideways. When the action happens within a range.
2) Bearish consolidation. When consolidation produces lower highs and lower lows.
3) Bullish consolidation. As we see here, with higher highs and higher lows.
Now, this is bullish but still only part of the transition period. Bull market action is what you see on the left between March 2020 and April 2021. Notice the huge difference.
Some other projects have been producing lower lows but this isn't a bear market more like bearish consolidation. We are about to enter the bull market phase. And this phase tends to end in a bull run.
If the same pattern from 2020-2021 repeats, we can see a new all-time high in May 2026. I have four new ATH projections on this chart, pick your own.
Thank you for reading.
Namaste.

#VET/USDT#VET
The price is moving within a descending channel on the 1-hour frame, adhering well to it, and is heading towards a strong breakout and retest.
We are experiencing a rebound from the lower boundary of the descending channel. This support is at 0.02456.
We are experiencing a downtrend on the RSI indicator, which is about to break and retest, supporting the upward trend.
We are heading towards stability above the 100 Moving Average.
Entry price: 0.02480
First target: 0.02530
Second target: 0.02565
Third target: 0.02612
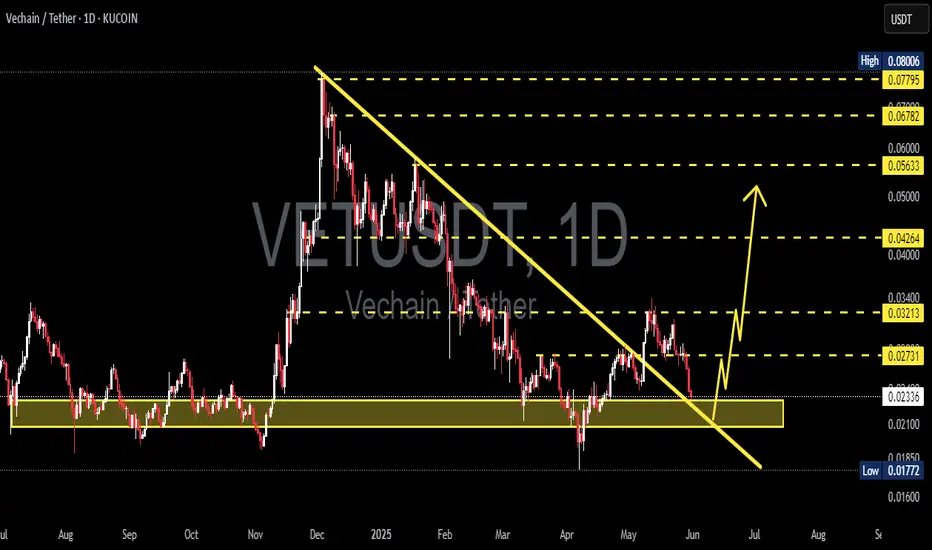
VETUSDT 1D Analysis VET ~ 1D Analysis
#VET This support block might be something you can start considering to start buying back from here with a short-term target of at least 10%++
#VET/USDT#VET
The price is moving within a descending channel on the 1-hour frame and is expected to break and continue upward.
We have a trend to stabilize above the 100 moving average once again.
We have a downtrend on the RSI indicator that supports the upward move with a breakout.
We have a support area at the lower boundary of the channel at 0.02750, which acts as strong support from which the price can rebound.
Entry price: 0.02936
First target: 0.03070
Second target: 0.03200
Third target: 0.03391

TradeCityPro | VETUSDT The Best Entry Opportunity Awaits👋 Welcome to TradeCityPro Channel!
Let’s dive in and analyze one of the veteran coins in the cryptocurrency space, VET, which has a high potential for movement. Together, we’ll identify its entry triggers.
🌐 Overview Bitcoin
Before starting the analysis, I want to remind you again that we moved the Bitcoin analysis section from the analysis section to a separate analysis at your request, so that we can discuss the status of Bitcoin in more detail every day and analyze its charts and dominances together.
This is the general analysis of Bitcoin dominance, which we promised you in the analysis to analyze separately and analyze it for you in longer time frames.
📊 Weekly Time Frame
In the weekly time frame, VET is one of the coins that’s in a relatively good position compared to other altcoins. While most altcoins have recorded new lows, VET has never lost the 0.01430 level!
After being supported at 0.01922 and closing a green weekly candle, we experienced an upward move. Currently, we’re stuck at the resistance of 0.03176, and it seems we’re pulling back to this resistance.
📉 Daily Time Frame
In the daily time frame, after an upward wave that didn’t quite reach the 0.09 resistance, a fake candle occurred, and we entered a box between 0.04197 and 0.05253. Seller presence and a rejection from the middle of the box led to losing the 0.04197 support.
After breaking this support, we experienced a sharp decline. When we reached the 0.01925 support, the bearish momentum hit its lowest point, and we saw reactions from buyers, leading to an upward move.
Currently, we’re below the key resistance at **0.03233**. After breaking this level, we can expect a sharp upward move. You can take a position in both **futures and spot**, with the safest stop loss for your buy at 0.01925
✍️ Final Thoughts
Stay level headed, trade with precision, and let’s capitalize on the market’s top opportunities!
This is our analysis, not financial advice always do your own research.
What do you think? Share your ideas below and pass this along to friends! ❤️

Check if it can break through 0.03779-0.04757 at once
Hello, traders.
If you "Follow", you can always get new information quickly.
Have a nice day today.
-------------------------------------
(VETUSDT 1W chart)
Support zone: 0.00440-0.101741
Resistance zone: 0.03779-0.04757
If it breaks through the resistance zone upward and maintains the price, it is expected that a step-by-step uptrend will begin.
Therefore, it is important to check whether there is support around 0.03779-0.04757.
-
(1D chart)
The key is whether it can maintain the price by receiving support near the M-Signal indicator on the 1M chart and rising to around 0.03779.
If it fails to rise, you should check for support near 0.02778.
If it falls below the 0.01741-0.2135 range, you should stop trading and watch the situation.
Therefore, the 0.01741-0.2135 range is an important support range from a short-term perspective.
-
The 0.03779, 0.04757, and 0.06603 points are important points as HA-High indicator points on the 1W, 1M, and 1D charts.
It is expected that a breakout trade will be possible when it breaks through the 0.03779 point, but since an important point is located before it rises much, the point to watch is whether it can maintain the price by rising above 0.04757 at once.
Therefore, when making a breakout trade, check if it rises above 0.04757, and if not, respond.
-
Thank you for reading to the end.
I hope you have a successful trade.
--------------------------------------------------
- This is an explanation of the big picture.
I used TradingView's INDEX chart to check the entire range of BTC.
I rewrote the previous chart to update it by touching the Fibonacci ratio range of 1.902 (101875.70) ~ 2 (106275.10).
(Previous BTCUSD 12M chart)
Looking at the big picture, it seems to have been following a pattern since 2015.
In other words, it is a pattern that maintains a 3-year bull market and faces a 1-year bear market.
Accordingly, the bull market is expected to continue until 2025.
-
(Current BTCUSD 12M chart)
Based on the currently written Fibonacci ratio, it is displayed up to 3.618 (178910.15).
It is expected that it will not fall again below the Fibonacci ratio of 0.618 (44234.54).
(BTCUSDT 12M chart)
I think it is around 42283.58 when looking at the BTCUSDT chart.
-
I will explain it again with the BTCUSD chart.
The Fibonacci ratio ranges marked in the light green boxes, 1.902 (101875.70) ~ 2 (106275.10) and 3 (151166.97) ~ 3.14 (157451.83), are expected to be important support and resistance ranges.
In other words, it seems likely to act as a volume profile range.
Therefore, in order to break through this section upward, I think the point to watch is whether it can rise with support near the Fibonacci ratios of 1.618 (89126.41) and 2.618 (134018.28).
Therefore, the maximum rising section in 2025 is expected to be the 3 (151166.97) ~ 3.14 (157451.83) section.
To do that, we need to look at whether it can rise with support near 2.618 (134018.28).
If it falls after the bull market in 2025, we don't know how far it will fall, but considering the previous decline, we expect it to fall by about -60% to -70%.
So, if the decline starts near the Fibonacci ratio 3.14 (157451.83), it seems likely that it will fall to around Fibonacci 0.618 (44234.54).
I will explain more details when the downtrend starts.
------------------------------------------------------

#VET/USDT#VET
The price is moving within a descending channel on the 1-hour frame, adhering well to it, and is on its way to breaking it strongly upwards and retesting it.
We are seeing a bounce from the lower boundary of the descending channel, which is support at 0.02600.
We have a downtrend on the RSI indicator that is about to break and retest, supporting the upward trend.
We are looking for stability above the 100 moving average.
Entry price: 0.02750
First target: 0.02838
Second target: 0.02908
Third target: 0.03000

VETUSDT 1D AnalysisVET ~ 1D Analysis
#VET Buy after successfully penetrating this resistant line with a short -term target of at least 10%+ from here.

VET ANALYSIS🚀#VET Analysis : Pattern Formation
🔮As we can see in the chart of #VET that there is a formation Inverse Head And Shoulder Pattern and it's a bullish pattern. If the candle sustain above the neckline then a bullish move could be confirmed✅
🔰Current Price: $0.02435
⚡️What to do ?
👀Keep an eye on #VET price action. We can trade according to the chart and make some profits⚡️⚡️
#VET #Cryptocurrency #TechnicalAnalysis #DYOR

Vechain, 20X, 30X Or 100X In 2025?Vechain stopped dropping in June 2023, that's the market bottom. Ever since it has been producing higher highs and higher lows. This is one of the strong pairs and the last correction already ended, last week.
The low prices in late 2024 launched a bullish wave and this bullish wave was corrected by more than 100%. This is a full flush. A full flush is always great news for bulls and buyers, because it allows for maximum growth.
The previous high is an easy and certain target which equal to about 245%. This is very easy and ultra-high probability because this level was already hit in the last wave. If VETUSDT can find buyers at a higher price, now that the correction went beyond 100% even more buyers will show up.
But 245% is only short-term and being super conservative, this pairs chart points to a new All-Time High. This is because of the chart structure, the fact that the bottom happened in 2023 and in this April 2025 we have a long-term higher low. The weaker pairs are producing new All-Time Lows now. The stronger pairs are producing higher lows. The higher low means that holders/traders/participants are not ready to part with their coins. They are simply not willing to sell and this is why the price remains strong in comparison to other pairs.
These same participants will work as the base for maximum growth in this newly developing bullish phase. The 2025 bull market, make no mistakes.
This is no usual bullish jump, no relief rally nor "initial bullish breakout" as I love to say. This is it, we are entering price dynamics similar to 2021 or better. A major bullish wave.
See here how the market performed in 2021:
Of course, it is not that the market will necessarily grow by 17,000%. I am just saying, 245% is easy, it will be a very strong bullish wave.
The top can be hit at 10X, 20X or 30X (Can be 100X for all we know)... Allow for strong variations. Regardless of the final outcome, you will be very happy with the results. It will be great.
Namaste.

TradeCityPro | VETUSDT Keep an Eye on the Charts!👋 Welcome to TradeCityPro Channel!
Let’s dive into the days when the world is buzzing with interesting events—countries are forming alliances, and news of Trump’s tariffs to negotiations is everywhere. You need to keep a sharp eye on the financial markets and your assets!
🌐 Overview Bitcoin
Before starting the analysis, I want to remind you again that we moved the Bitcoin analysis section from the analysis section to a separate analysis at your request, so that we can discuss the status of Bitcoin in more detail every day and analyze its charts and dominances together.
This is the general analysis of Bitcoin dominance, which we promised you in the analysis to analyze separately and analyze it for you in longer time frames.
📊 Weekly Timeframe
After the bullish move from the 0.01963 support, we got rejected at 0.08271, essentially wiping out the entire move and fully retracing our steps.
We’ve now returned to the 0.01963 support, where we’re forming a solid green indecision candle, backed by noticeable buying pressure. This level has shown a strong reaction, acting as a reliable support.
This could serve as a decent buy trigger with low risk, offering a good entry point. Personally, though, I’m holding off on buying until we see stronger momentum in the chart and market, and until Bitcoin dominance experiences a deeper pullback.
📉 Daily Timeframe
In the daily timeframe, VET is among the coins that have faced a brutal sell-off! From its last peak, it’s dropped roughly 77%, and those without proper risk management have likely been wiped out.
After forming a support box between 0.04224 and 0.05298, we saw a fakeout above the box, signaling further downside. The last time we held support at 0.04224, we couldn’t reach the box’s ceiling, leading to a sharp drop. But after hitting 0.01942, the price has calmed down a bit.
For buying in spot or even futures positions, we’d need a break of the trendline and its trigger at 0.02352 to confirm entry, given the trendline’s retracement nature. If we get rejected from this trendline, a short position in a lower timeframe could make sense. Should 0.01942 break, the downtrend will likely continue. For spot entry confirmation, a surge in volume and a break above 48.68 RSI would be a strong signal.
✍️ Final Thoughts
Stay level-headed, trade with precision, and let’s capitalize on the market’s top opportunities!
This is our analysis, not financial advice always do your own research.
What do you think? Share your ideas below and pass this along to friends! ❤️

Vet 3x-9x leverage 5% allocationHello traders,
Here is a free sample VIP trade we offer every Wednesday. Profit targets listed by the green horizontal line.
Enjoy

VETUSDT 1WVET ~ 1W Analysis
#VET Buy gradually from here if you still have a Conviction on this coin with a short -term target of at least 20%+.

#VET/USDT#VET
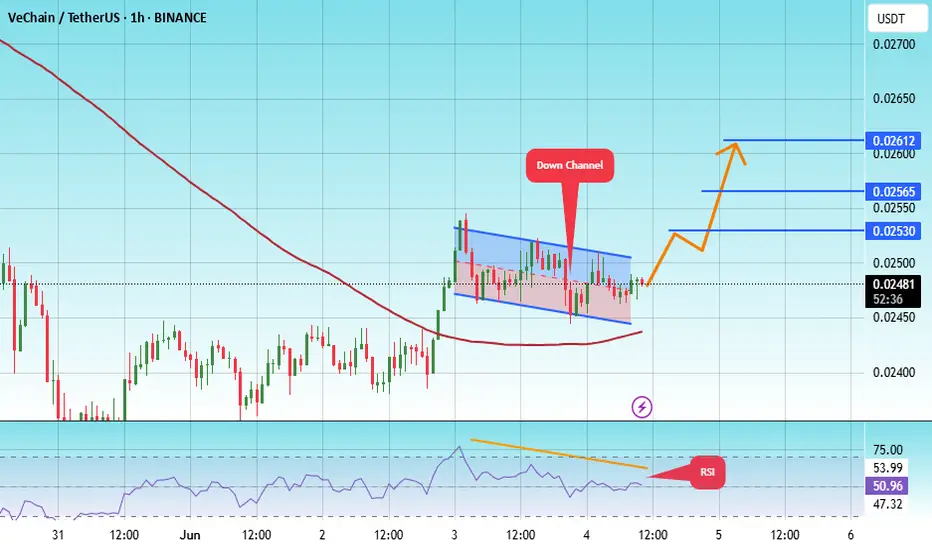
The price is moving within a descending channel on the 1-hour frame, adhering well to it, and is on its way to breaking it strongly upwards and retesting it.
We are seeing a bounce from the lower boundary of the descending channel, this support at 0.02460.
We have a downtrend on the RSI indicator that is about to break and retest, supporting the upward trend.
We are looking for stability above the 100 moving average.
Entry price: 0.02620
First target: 0.02700
Second target: 0.02765
Third target: 0.02853

VETUSDT on the Edge – Is a Major Breakdown Coming?Yello! Is VETUSDT on the verge of a bigger drop, or could a reversal be in play? The price action is signaling a critical moment, and traders need to stay sharp. A major move is brewing let’s analyze the setup.
💎#VETUSD remains under strong bearish pressure, repeatedly rejecting from the descending trendline and key supply zone. Price is also trading below the 200 EMA, reinforcing the bearish momentum and signaling that sellers remain in control. Until VET reclaims $0.02695, the risk of further downside remains high.
💎The next major support level to watch is $0.02117, where a temporary bounce could occur. However, if selling pressure continues, VET is likely to push lower toward $0.01906, a historically strong accumulation zone. This level will be crucial either it holds as a buying opportunity, or we see deeper downside continuation.
💎For the bulls to regain control, it must reclaim $0.02695 and break past the supply zone. A sustained push beyond $0.025, combined with strong buying momentum, could indicate the start of a recovery. However, a true trend reversal will only be confirmed if NYSE:VET closes above $0.02695 and reclaims the 200 EMA, invalidating the bearish setup and signaling bullish strength.
Patience is key, Paradisers. The market rewards those who wait for confirmation instead of chasing every move.
MyCryptoParadise
iFeel the success 🌴

VET/USDT BUY Hello friends
Due to the price correction, we have identified important supports for you that are likely to reverse the price, and you can buy steps according to the two specified ranges.
We have also identified price targets for you.
*Trade safely with us*

#VET/USDT#VET
The price is moving in a descending channel on the 1-hour frame and is expected to continue upwards
We have a trend to stabilize above the moving average 100 again
We have a descending trend on the RSI indicator that supports the rise by breaking it upwards
We have a support area at the lower limit of the channel at a price of 0.02666
Entry price 0.02950
First target 0.03080
Second target 0.03200
Third target 0.03300

#VET/USDT#VET
The price is moving in a descending channel on the 1-hour frame and is adhering to it well and is heading to break it strongly upwards and retest it
We have a bounce from the lower limit of the descending channel, this support is at a price of 0.02630
We have a downtrend on the RSI indicator that is about to break and retest, which supports the rise
We have a trend to stabilize above the moving average 100
Entry price 0.2700
First target 0.02810
Second target 0.02920
Third target 0.03064

VETUSDT 1WVET ~ 1W Analysis
#VET Buy gradually from here if you still have a Conviction on this coin with a short -term target of at least 20%+.

UNIVERSOFSIGNALS | VET : a Layer 1 projectLet's quickly dive into VET, a Layer 1 project with a market cap of $2.37 billion, currently ranked 41st in coin market cap.
📊 In the 4-hour timeframe, you can see that a descending triangle has formed, and the floor of this triangle at $0.03068 has been broken, with the price now touching an important daily support at $0.02673.
⚡️ The RSI oscillator, following the triangle break, entered the oversell zone and, after concluding the downward leg, has rebounded above this zone, approaching the 50 area.
⭐ The volume aligns with the downward trend, and if the support at $0.02673 breaks, we could witness the next leg down. The next price support would be at $0.02406.
📈However, if the price moves back above $0.03068, it could indicate that the downward trend has ended. In this case, a risky long trigger would be at $0.03580, and the main long trigger would be at $0.03958. This reversal would suggest potential upward momentum, providing opportunities for long positions.
