TradeCityPro | VETUSDT Volatile Week Begins👋 Welcome to TradeCityPro Channel!
As the global market opens, let's analyze VETUSDT and prepare for the upcoming trading week.
🌐 Overview Bitcoin
Before diving into VET, let's check Bitcoin’s 1-hour timeframe. The market was expectedly quiet on Saturday, given the lack of trading activity.
My plan remains the same: If $95,747 breaks, I will open a short position. If Bitcoin dominance is rising at the time of the breakdown, I will short both BTC and an altcoin that is weak against Bitcoin since it has a higher chance of dropping.
📊 Weekly Timeframe
VET is one of the older altcoins in the market, and its current situation is relatively better than many others.
After breaking $0.03147, it had a sharp bullish move up to $0.06672, but it's now in a correction phase and has settled back on the $0.03147 support.
A positive sign is that VET has formed a higher low in 2024 compared to 2023, which suggests potential strength.
For a spot entry, we need to see a new structure forming, and my current buy trigger is a break above $0.06622. Until then, I see no buying opportunity. For selling, if we drop below $0.01470, it's best to exit and go to cash.
📈 Daily Timeframe
On the daily chart, VET initially broke above the $0.02679 range high and rallied sharply to $0.06828. However, we saw a fake breakout, leading to a heavy rejection and correction.
During this drop, a midway range (box) between $0.04214 - $0.05288 formed. Buyers tried but failed to break above the box, resulting in another fake breakout, increasing the likelihood of breaking the range low.
After another rejection from the mid-range, $0.04214 (our spot exit trigger) was broken, leading to a sharp decline. The RSI is now oversold, indicating a potential slowdown before further downside into the previous daily range.
⏱ 4-Hour Timeframe
On the 4-hour chart, we have formed a key level that is currently breaking down, creating a short opportunity.
📈 Short Position Trigger
we can place a stop-sell order with the current 4-hour candle as confirmation. I have already entered a short trade on the previous level breakdown and will re-enter with lower risk on this one.
📉 Long Position Trigger
there is no buy trigger yet. Even if VET pumps 20% suddenly, I won’t regret missing it because momentum will bring better opportunities for long entries later.
📝 Final Thoughts
Stay calm, trade wisely, and let's capture the market's best opportunities!
This analysis reflects our opinions and is not financial advice.
Share your thoughts in the comments, and don’t forget to share this analysis with your friends! ❤️
VETUSDT

VeChain: Rise from Channel Bottom to Top or a Big Breakout?💠 Technical Analysis:
VeChain has been consolidating within a price channel and recently found support at the channel bottom. It has also broken its downtrend line and a key static resistance level, now pulling back to this zone.
📊 Buy Signal:
🎯 Targets:
🔹 First Target: Channel top
🔹 Second Target: If the channel breaks, a move equal to its width
📢 What’s your opinion on this analysis? Drop a comment! 🚀🔥

VTHO could spike 150% VTHO spike roughly 400% last Tuesday because of new token list to Korean exchange which catch my attention. I watched this chart for week and I believe this could spike another 150% if Big whales step in the buy zone or announcements.
I believe .007 is heavy resistance zone worst case if reject at, fail to reach, or BTC/ETH dump occur then I'll cut position and move on from this token.
VTHO must hold at around .005.
Just sharing my ideas. I do not provide financial advice and I am not a qualified licensed investment advisor. I'm just trading here as my side hustle.

Does history repeat itself?hello guys
We came with the analysis of this coin.
According to the past of the chart and the price correction and the period of time the price has been suffering, we can give the probability that the history will repeat itself.
we will see...
*Trade safely with us*

#VET/USDT lONG Ready to go higher#VET
The price is moving in a descending channel on the 1-hour frame and sticking to it well
We have a bounce from the lower limit of the descending channel, this support is at 0.04570
We have a downtrend on the RSI indicator that is about to break, which supports the rise
We have a trend to stabilize above the moving average 100
Entry price 0.04670
First target 0.04860
Second target 0.05180
Third target 0.05546

#VET/USDT #VET
The price is moving in a descending channel on the 1-hour frame and is expected to continue upwards
We have a trend to stabilize above the moving average 100 again
We have a descending trend on the RSI indicator that supports the rise by breaking it upwards
We have a support area at the lower limit of the channel at a price of 0.04111
Entry price 0.04407
First target 0.04640
Second target 0.04860
Third target 0.05090

VET waiting my targetsBINANCE:VETUSDT
Possible Targets and explanation idea
➡️Vet weekly timeframe still waiting signal close short on weekly and buy based on TradeON
➡️I think we will see drop to 0.27 zone again sweep liquidity and close monthly gaps
➡️0.009-0.007 more likely will be a bottom for Vechain
➡️Positive bounce its a 0.039 monthly gap around 0 lvl
➡️Even after this bounce I think we will see continuation to low targets
Hope you enjoyed the content I created, You can support with your likes and comments this idea so more people can watch!
✅Disclaimer: Please be aware of the risks involved in trading. This idea was made for educational purposes only not for financial Investment Purposes.
---
• Look at my ideas about interesting altcoins in the related section down below ↓
• For more ideas please hit "Like" and "Follow"!

How long #VTHO will make in this bull cycle??
#VTHO had made a great move yesterday ... According to elliott wave micro count, it has completed it's 3rd wave and now will move towards 4th corrective wave into green box region....
It must hold that region and then it will complete it 5th wave which equally matches with the target of 3rd macro count....
After 3rd macro count we can see slight pullback creating 4th corrective wave and then final macro 5th impulse wave will be made by #VTHO

VETUSD H2 Best Level to BUY/HOLD +80% gains🔸Hello guys, today let's review 2hour price chart for VET. Outlook remains bullish currently pullback in progress, however buying low still is a perfect trade setup.
🔸VET is currently re-accumulating for a re-test of recent high set at 0.075. risk/reward shifts in bulls favor towards range lows of the recent range set at 0.04.
🔸Recommended strategy bulls: Price action contained within bullish channel. get ready to buy low near 0.04, TP is 0.075USD +80% gain. BUY/HOLD setup for patient traders.
🎁Please hit the like button and
🎁Leave a comment to support our team!
RISK DISCLAIMER:
Trading Futures , Forex, CFDs and Stocks involves a risk of loss.
Please consider carefully if such trading is appropriate for you.
Past performance is not indicative of future results.
Always limit your leverage and use tight stop loss.

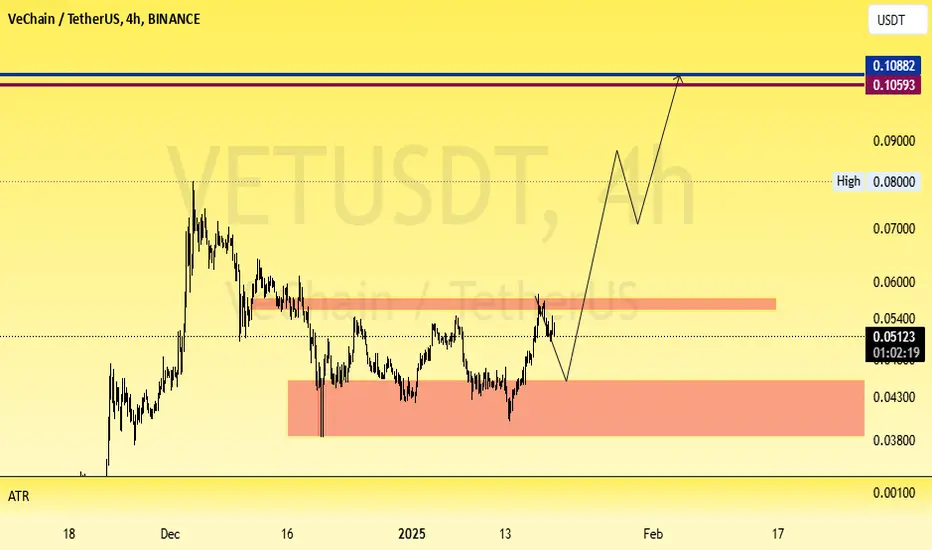
VETUSDT Wave AnalysisHello Friendes. According the chart of VETUSDT I expected to this movement and 0.105$ . This Way possible by cottrction but see that price.
Do you need to go to the VET?I guess not because youre a human, unless youre a doge to see this. Stances marked and initial buys goes from the red box, upto you to short or wait for it to buy

VeChain (VET)🔍 Technical Analysis of VET/USDT
📌 Introduction to the VeChain Project:
VeChain is an advanced blockchain platform designed to enhance supply chain management and business processes. By leveraging blockchain technology 🌐 and IoT 📡, VeChain enables companies to boost transparency and efficiency in their supply chains. Its primary goals include reducing costs, improving product quality, and increasing trust in business operations.
📌 General Overview:
The VET coin, a leading project in the blockchain space, is currently trading within an ascending channel on the weekly timeframe. This movement suggests a potential continuation of the bullish trend; however, key levels require close attention.
📊 Recent Price Movements:
The price recently hit the top of the ascending channel and underwent a short correction.
It is now approaching the red support zone (0.03238 - 0.03948) and the midline of the channel.
✅ Potential Scenarios:
Bullish Scenario 📈:
If the price rebounds from the red support zone, it could rally toward the channel's upper boundary.
A breakout above the ascending channel's resistance may pave the way for Fibonacci targets.
Bearish Scenario 📉:
If the red support zone breaks, the price could drop toward the channel's bottom or the gray support zone (0.01638 - 0.01966).
📍 Key Zones:
Daily Resistance (Yellow):
Range: 0.05038 - 0.05504
A breakout above this resistance on the daily timeframe opens the path toward the channel's top and higher targets.
Fibonacci Targets After Breaking the Channel's Top:
1.618 Fibonacci Level: 0.08251 - 0.09507
2 Fibonacci Level: 0.11594 - 0.13874
2.618 Fibonacci Level: 0.19679 - 0.23327
Critical Supports:
Channel's Bottom: The first significant support level.
Gray Support Zone (0.01638 - 0.01966): Acts as the final line of defense.
🛠️ Entry Strategy & Risk Management ⚠️:
Safe Entry:
Enter after the price breaks above the ascending channel and consolidates above the yellow zone.
Stop Loss:
Initially, place below the red support zone.
After breaking the channel’s top, adjust below the yellow zone.
Risk Management:
Adjust trade size based on confirmations.
Risk only 1-2% of your total capital on this trade.
📈 Confirmation Factors for the Move:
Trading Volume:
A noticeable increase in volume during the breakout of resistance or support signals a strong move.
RSI Indicator:
RSI above 60 indicates a bullish continuation.
Entry into the Overbought zone could lead to a sharp rally toward higher targets.
🚀 Conclusion 🏆:
This analysis highlights that VET is at a critical and sensitive juncture. With proper risk management and confirmation of technical signals, this coin could present exciting investment opportunities.

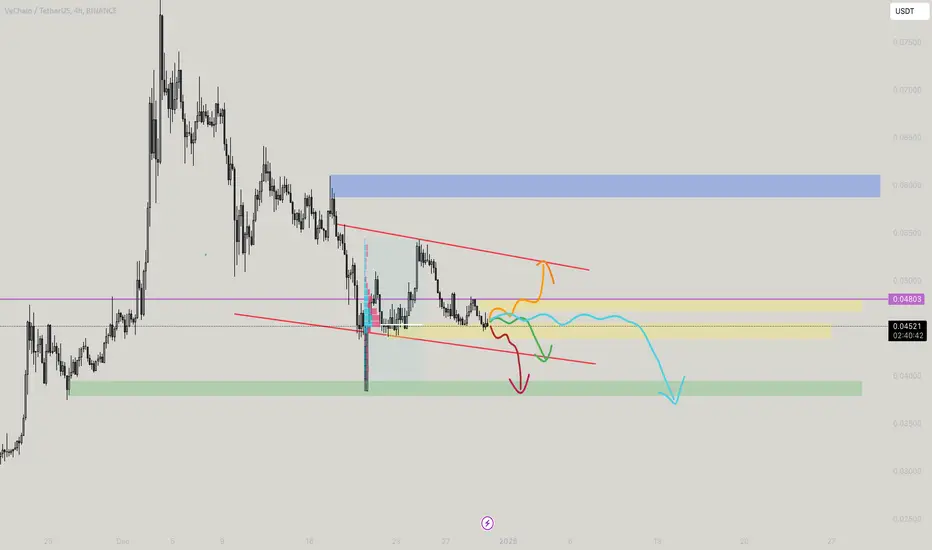
VETUSDT - Only Veterans Trade Please!VETUSDT - SO there are four possible scenarios of VET as there are tight squeeze of the yellow boxes. For TL;DR - Wait for the green box in action for clear path, For daredevils, Orange marked the scalps end to the path of the channel marked, The red marked (horizontal line) is fib pockets and would play a good role here. The cyan line marked shows if tight buyers and sellers in action, expect strong attraction to 0.4534. and eventually bleed, Green shows normal fall till the red line to retest if following channels, and my most loved green box is what i wait because DOM is stacked for the orders to filled. The blue box is a point if green line gets bonked aim for the targets on it.
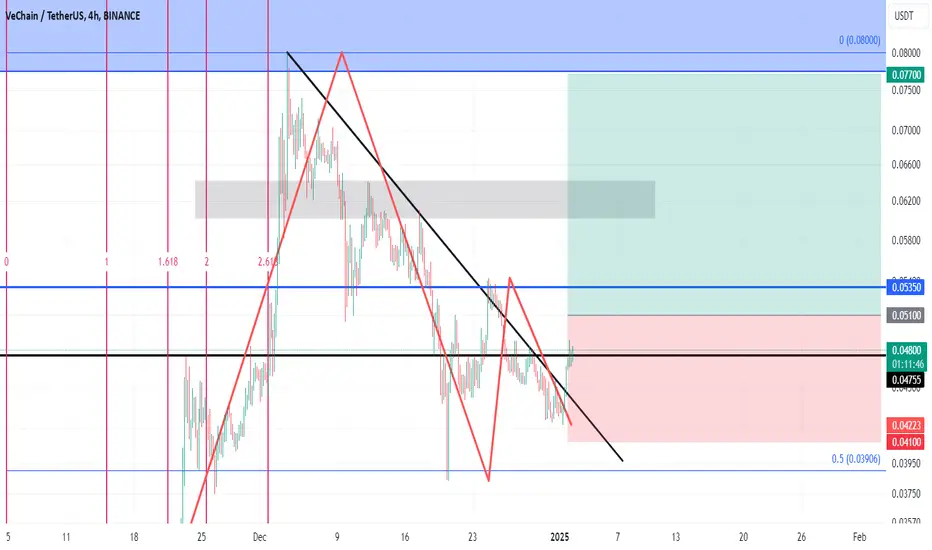
VeChain: A New Bullish Wave is Starting📈 VeChain has recently completed an ABC correction and is now entering a new bullish wave. Waves 1 and 2 have been completed successfully, and we are now likely heading towards completing waves 3 and 5. This sets up a great opportunity for those looking to take advantage of the next upward move! 🌟
📌 Entry Point: 0.05100
📉 Stop Loss: 0.04100
🎯 Target Profit: 0.07700
🔍 Based on the current analysis, these levels suggest a strong bullish movement in the short-term. With the completion of waves 1 and 2, you can confidently enter the market for the upcoming move. 🚀
VeChain (VET) - Double Bottom BULLISHTarget Level 2= $0.04801 Incoming!!!
Breakout from a double bottom pattern formed, reversal to the upside.

VET USDTIf the price breaks through a key resistance zone and the trend line, it could signal a strong upward trend. This momentum might drive the price towards the $0.07865 mark. The move could happen quickly, potentially within just a few days.

#VETUSDT Ready For a Pullback or Will it Slide Down Further? Yello, Paradisers! Is #VeChain gearing up for a pullback, or are we looking at a potential retracement? Let’s dive into the details of this crucial setup for #VETUSDT:
💎#VET has been trading within a broadening wedge for months, with descending resistance and support lines guiding the structure. Recently, the price broke out of the wedge’s descending resistance, marking a key technical development. However, VET saw a massive profit taking and came back for liquidity capture.
💎The immediate resistance is resting at $0.060. A clean breakout above the $0.06067 resistance, confirmed with a daily close, could trigger an aggressive bullish rally. The possible targets following this move would be $0.08000 and potentially higher. Such a rally could attract fresh buyers and propel #VETUSD into a new bullish trend.
💎On the downside, the immediate support lies at $0.03811. Beneath this level, a strong demand zone exists between $0.03119 and $0.03811, which has previously acted as a reliable area for bullish rebounds. If the price revisits this zone, it could present an excellent opportunity for buyers to step in again.
💎A daily candle close below the $0.03119 demand zone would invalidate the bullish structure. Such a move could lead to further downside pressure, with the price likely targeting the $0.02000–$0.01500 levels. This scenario would also indicate a shift toward bear control.
Stay focused, patient, and disciplined, Paradisers🥂
MyCryptoParadise
iFeel the success🌴

💲 vet/vechain - 2024-2025 price prediction 💲hi my friends , just look at the analyse ...
how much profit could we take ?
how much profit can we take ?
💲💲💲💲💲💲 this price prediction say it truly 💲💲💲💲💲💲💲
0.028 - 0.28 - 2.8 ...

VET Bull Run Ignites: Unstoppable Growth Ahead!VET appears poised to continue its upward momentum, driven by strong fundamentals and a thriving ecosystem. Recent price movements have been substantial, reflecting growing confidence in VeChain's potential. Historically, periods of significant upward movement are often followed by phases of consolidation, providing a foundation for sustained growth.
Looking ahead, the current uptrend seems to be in its early stages. With VeBetter playing a pivotal role as the cornerstone of the ecosystem and rapidly expanding its influence, the outlook for VeChain in 2025 remains highly optimistic. The combination of robust fundamentals and ecosystem growth suggests a promising future for NYSE:VET and its stakeholders.

#VET/USDT Ready to go up#VET
The price is moving in a descending channel on the 1-hour frame and sticking to it well
We have a bounce from the lower limit of the descending channel, this support is at 0.04900
We have a downtrend on the RSI indicator that is about to be broken, which supports the rise
We have a trend to stabilize above the moving average 100
Entry price 0.05160
First target 0.05317
Second target 0.05633
Third target 0.06000

VETUSDT 1WVET Update ~ 1W
#VET If you still have Conviction on this coin,. Buy gradually within this support block,. This coin is still in a very bullish trend.

Golden Opportunity for VET; Ready for Big Targets!If you're looking for a strong upward move in the crypto market, VET has reached an exciting and critical point. It seems that the B wave correction has finished, and now it's entering the C wave. It's about to face the 9 cent resistance, and if this level breaks, it could trigger a powerful rally!
🎯 Targets:
1️⃣ $0.60 (560% profit)
2️⃣ $1.50 (1550% profit)
This opportunity could bring significant gains for those who have been waiting for the right moment. Always enter with precise analysis and proper risk management.
Important note: Once 9 cents breaks, be ready to enter, but also stay cautious of any potential corrections!
With careful attention, you can take advantage of this move. Stay successful! 💪

VET / USDT: rebounding towards trendline resistance VET/USDT: Rebounding Toward Trendline Resistance – Breakout Ahead?
VET/USDT is showing promising signs 📈 as it rebounds from a strong support level, making its way toward a critical trendline resistance 📊. This setup hints at a potential breakout 💥 that could pave the way for a bullish move 🚀. Stay alert for confirmation signals before taking action 👀.
Key Insights:
1. Support Bounce: VET/USDT has found solid support, fueling bullish momentum as it approaches trendline resistance.
2. Volume Watch: A surge in trading volume during a breakout will confirm buyer strength 🔥.
3. Momentum Build-Up: RSI and MACD indicators are trending upward ⚡, signaling increasing bullish pressure.
Steps to Confirm the Breakout:
Wait for a 4H or daily candle to close decisively above the trendline 📍.
Monitor for a significant volume spike during the breakout, indicating robust buying activity 📊.
A retest of the trendline as a new support will validate the breakout ✅.
Be cautious of false breakouts, such as sharp reversals or wicks above resistance ⚠️.
Risk Management Strategies:
Place stop-loss orders below the breakout zone or key support to manage risk effectively 🔒.
Ensure position sizing aligns with your trading plan 🎯.
This analysis is for educational purposes only and not financial advice. Conduct your own research (DYOR) 🔍 before making investment decisions.
