i was wrong but had a back up plan! #VETSo, i missed completely, but i had a backup plan. Had buy orders till 0.786 lvl
all filled up.
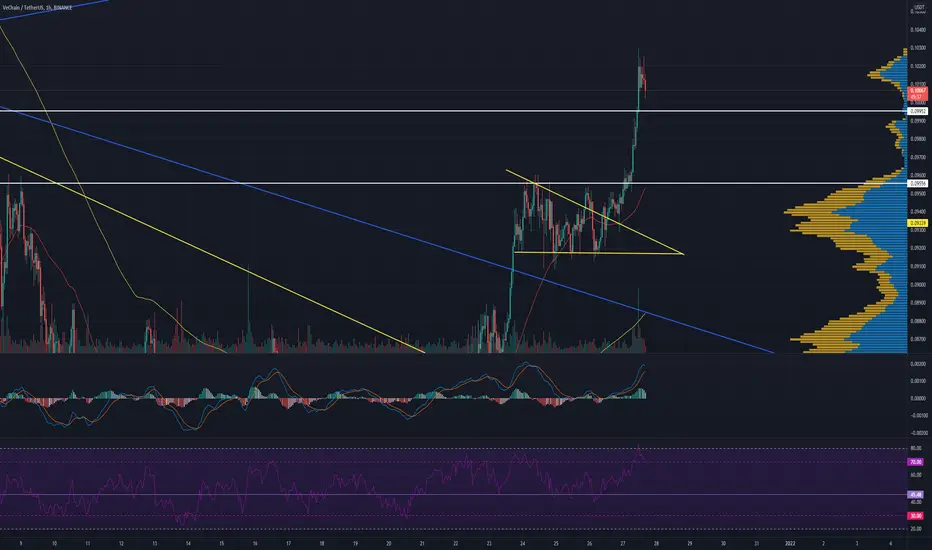
And now this is the plan.
Stop loss is at 0,0802
VETUSDT

Bitcoin Short 6H TA : 01.07.22 : $BTCLast analysis is still valid... All short-term targets reached ...
As we expected, the price break the trading range from the bottom and also lost its important dynamic support. Currently, the first very important support and bearish target is the (Swing Low) price, which is in the range of $ 42,000. Up to $ 42300, if this critical level is broken the next downside targets will be $ 40 ,000, $ 38,600 and $ 37,700 and if all 3 of these support will be lost , the Potential Reversal Zone (PRZ) could be the of 35,500 $ range ... (This analysis will be updated)
Follow our other analysis & Feel free to ask any questions you have, we are here to help.
⚠️ This Analysis will be updated ...
👤 Arman Shaban : @ArmanShabanTrading
📅 06.Jan.22
⚠️(DYOR)
❤️ If you apperciate my work , Please like and comment , It Keeps me motivated to do better ❤️

Vechain looks promising but only if !!!the wave that is mentioned as "1" is a significant break of structure. 18541 percent move is telling many things; however, in order to avoid any emotional trade, waiting for a good correction is necessary. R/R ratio is not satisfactory in current prices.
NOTICE:
IT IS NOT A FINANCIAL ADVICE

VET Huge Gains after Second Test of the ResistanceVET now is in a perfect triangle with a bearish breakdown. Now it test 1 time the resistance. If it test one more time after that we expect a massive brakeout. FIBO levels are the targets.


Will this become a crypto VET?Like many alts, VET has faced a strong pullback from its ATH in April dropping by >70% (never buy at an ATH). Since then, it has been trading within this weak triangle on the 4-day timeframe. VET seems to have found shallow ascending support along the black line and could make its way toward the upper resistance over the next few weeks.
The support looks strong but the main question is, will the support hold even if BTC drops to ~41/42k? Remember, any candle close below the black line means the idea is cancelled. For now, it is still trading above its 200 day EMA and is testing its 100 day EMA. I think it can move up.
Please note I am not a financial advisor and this is not financial advice. All ideas are for educational purposes only :)
Please feel free to leave your comments, questions and thoughts below!

VET Ready to movePrice is acting in a similar block of sideways priceactio, which is accumulation. --> ready for the bull run!

VECHAIN - The Final BreakdownVET is currently in a bigger ABC correction and approaching the final leg down of the C wave, after which we will be looking to buy and hold Vechain for the long term.
We have the -0.27 fibonacci at $0 which is very unlikely. However, if price drop close 0, it should be seen as a buying opportunity. There's a lot of hype behind VET so it is unlikely that it will die anytime soon.
Short Term SELL Trade Idea:
- Watch for bearish price action within the current bear flag
- Enter with stops above the bear flag
- Target the 0.50 to 0.60 region
Long Term BUY Trade idea:
- Watch for one more drop back down to the 0.06 level
- Enter with stops below that structure level
- Target the wedge resistance as first target
- Target ATH as second target.
- HODL the rest
Let us know what you think!
log chart and

VECHAIN - The Final BreakdownVET is currently in a bigger ABC correction and approaching the final leg down of the C wave, after which we will be looking to buy and hold Vechain for the long term.
We have the -0.27 fibonacci at $0 which is very unlikely. However, if price drop close 0, it should be seen as a buying opportunity. There's a lot of hype behind VET so it is unlikely that it will die anytime soon.
Short Term SELL Trade Idea:
- Watch for bearish price action within the current bear flag
- Enter with stops above the bear flag
- Target the 0.50 to 0.60 region
Long Term BUY Trade idea:
- Watch for one more drop back down to the 0.06 level
- Enter with stops below that structure level
- Target the wedge resistance as first target
- Target ATH as second target.
- HODL the rest
Let us know what you think!

VET UPDATEdon't miss this coin 200% profit chance
support
0.061$
0.081$
target
0.141$
0.153$
0.23$
0.28$

VETUSDT - 1W - LONG💡💡#INVEST 💡💡
VET / USDT
▶️ Buy in two Block
1Block (30%) 0.06758 - 0.05667
2Block (70%) 0.03974 - 0.02914
🔴 SLT -1W (Trigger, close 1W candle below)
SPOT ONLY!!!
It's going to be a long deal. I have placed limit orders in blocks. This deal is in case "everything is going to be bad."
#VETUSDT_INVEST_281121

VET (Not looking too good)Bulls couldn't break the resistance on the blue apex line. This is the first rejections. There might be more downside for VET if we get a second retest on resistance, and we failed to break it.
VET 1H


VET APEX Triangle (Retest)VET going for retest. Rsi fell below support 45.48. We need to reclaim back above this weekly timeframe support, so as to get continuous momentum towards the upside.
VET 1H

VET MovingVET broke out, a better entry would be to wait for a retest at 0.09952. Overbought on the RSI
VET 1H
VeChain VET with enough power to break MA Ribbon?VeChain VET with enough power to break MA Ribbon?
This daily MA Ribbon is more than well respected.
The RSI shows room to grow before reaching the resistance.
What do you think? 😎
Drop me a nice comment if you'd like me to analyze any other cryptocurrency.
*not financial advice
do your own research before investing

$VET /USD, Buy signals everywhere..$VET /USD
Buy signals everywhere..
Aiming for 10cents as 1st important level for this one
#VET


VETUSDT-LONGThere is a long position in VETUSDT VeChain
VETUSDT VeChain
🔵Long Now or set on Key Level 0.09400
🟢Target 1 0.09900
🟢Target 2 0.10400
❌Stop loss 0.09180
#K_Level
Please support our activity with your likes and comments.

VET - can buy it with these TPBYBIT:VETUSDT
1H trend chart
-
VET has broken out the triangle and it is testing Fib1
If price can take out 0.0961, trading strategy as below.
-
Profit Targets:
a) 0.0996~0.1010----Fib(1.272~1.382)
b) 0.1040----Fib(1.618)
c) 0.1089----Fib(2)
Stop losses:
a) 0.09275-----Red horizontal ray
-
If you like this analysis, smash the "like button" and leave a comment below to share your thoughts
or let me know what crypto you want to see!
Trading is a reflection of yourself. Learn more daily and be ready for every opportunity.
Have a nice trading!

VET Big Symmetrical Triangle reboundVET/USD (Daily)
Bullish Case
- Uptrend Support Line being held, seem to have found Support between $0.07-0.08 area which is previous supports and range for a while now.
- Symmetrical Triangle intact.
- MACD/Signal and Histogram reversing
- RSI low and reversing.
- Bullish Divergence with RSI.
- Market Cipher B shows a Big Bullish push-up with a print of multiple Green Dots printed at the lows.
Bearish Case
- Can see further drops to the next lows at $0.055-0.06
Thoughts?

VET cup and handle setup ready to popVET cup and handle setup is about to break,
Always do your own analysis, Good luck

VET/BTC 300% Potential from here If Break Resistance..?#VET/BTC TA Update:-
#VET is also Looking good and Bounced back from Support level.
Try to catch between 170-180 Satoshi
1st Target as per chart is 231 Satoshi (36% )
After If break upward 240 Satoshi then I can expect 500 Satoshi will be my 2nd Target (200% )
And if hold 250 Satoshi + then My Last Target will be 700 Satoshi ( 300% )
Stop Loss:- 149 Satoshi
Support:- 165 Satoshi
Resistance:- 240 Satoshi
