VET, READY TO GROW MORE ?!!
As you see in the chart above, Vet is still under the cloud and not recommended to open the long position. So we need a breakout, then a retest, and going to reach the prz zone asap.
VETUSDT

vet/usdt 4h chart vet/usdt 4h chart
2 diffrent idea for vet
.
.
.
.
.
.
enter after breakout long or short

#VET VeChain posting a bullish flag pattern#VET VeChain posting a bullish flag pattern
VECHAIN is printing a bullish flag on 4 hour time frame with price targets of:
0.11650
0.12880
0.14500

VET - is going to break this trend line🚀🚀Most coins show the same pattern on the graph. Almost all altcoins are near the trend line . A break or retest would be a good buying opportunity.
Write in the comments all your questions and instruments analysis of which you want to see.
Friends, push the like button, write a comment, and share with your mates - that would be the best THANK YOU.
P.S. I personally will open entry if the price will show it according to my strategy.
Always make your analysis before a trade.

VET bear divergencePrinted bear div on RSI and MACD histogram on 2hr chart, SRSI looks like death cross will be printed when this bar closes. So I am waiting to see which level will hold and waiting for possible bounce, if that support at 0.11381 is lost, 0.10333 could be in the cards again... Good luck traders

Vet usdt - Buy Hello traders
See vet / usdt Chart
There are two patterns
Cups and triangles
If the triangle pattern is done
And break the downtrend line
You will have Target 3.4
And if the comp pattern is done, Target 2.4

VETUSDT analysis 📊🔥Well this is a complete analysis of VET and everything is clear on the chart.
You can buy after breaking second black line.
If the daily candle closes below the white area, a big downward trend will be on the way.
For shorter positions
There is another resistance in the 1h time frame, which is marked with a blue line, you can buy after breaking the blue line and closing the daily candle above it, and sell it on the first black line.

SOLUSDT VETUSDT ETHUSDT BTCUSDT Pump & UpdateHey, Been a few days, i started a T-Shirt designing brand of all things. Obnoxiously Humorous T-Shirt and been doing that the last week or more while its been boring waiting for markets. Can find it by the same name on Facebook group & page.
Now, when the market pumps like this you might get more out of it over the weekend. But its a strong pump and a good point to take little profits off the table on those trades I recorded about last week or so ago on VETUSDT, DOTUSDT.
Take profits. Taking a profit is never a bad thing. A win is a win and you live to fight another day. If you die you can't fight at all. Any win is a good win.
SOL bounced amazing exactly as predicted. The evidence is in my prior vid.
Check ya next time. Be patient things will pick up into Christmas and after. Very surprised if it goes the other way.

VET/USD ChartWhat a day for crypto, the total market is up 8.5%, and my previous BTC prevision is starting to make sense (check it out, I might post another
BTC chart later). Vet is up 20% today, so it might get a drop in a next few days, but the predictions are still very bullish. A new ATH seems umprobable because if the market starts to get overvalued coins like VET will be sinking. Being greedy with profits is never a good thing. If your plan is to hold for +5 years the trading perspective doesn't really matter right now, but for a mid-short term investor a 2-5X your inicial investment in VET is so good so just take the profit before the next bear market. Keep in mind that I'm not a financial advisor, and that just my opinion. Comment, like and follow.


VETUSDTHello Crypto Lovers,
Mars Signals team wishes you high profits.
We are in a 4-hour time frame.
As you see, the price has broken its resistance line and experienced a rise. At the moment, we are considering that the price can start moving towards its target after a pullback again.
But in case of drop, and fall below the support line, we consider further fall to the next support line.
Warning: This is just a suggestion and we do not guarantee profits. We advise you analyze the chart before opening any position.
Wish you luck

If you wait, you winThis looks beautiful to me! also VET is a really good project with real-life application. Let's wait and win together. This setup is from daily perspective, time will be our friend.

💡Don't miss the great buy opportunity in VETUSDTrading suggestion:
". There is a possibility of temporary retracement to the suggested support line (0.08887).
. if so, traders can set orders based on Price Action and expect to reach short-term targets."
Technical analysis:
. VETUSD is in an uptrend, and the continuation of the uptrend is expected.
. The price is below the 21-Day WEMA, which acts as a dynamic resistance.
. The RSI is at 59.
Take Profits:
TP1= @ 0.09407
TP2= @ 0.09990
TP3= @ 0.11053
TP4= @ 0.11929
TP5= @ 0.12825
SL= Break below S2
❤️ If you find this helpful and want more FREE forecasts in TradingView
. . . . . Please show your support back,
. . . . . . . . Hit the 👍 LIKE button,
. . . . . . . . . . Drop some feedback below in the comment!
❤️ Your support is very much 🙏 appreciated!❤️
💎 Want us to help you become a better Forex / Crypto trader?
Now, It's your turn!
Be sure to leave a comment; let us know how you see this opportunity and forecast.
Trade well, ❤️
ForecastCity English Support Team ❤️

💡Don't miss the great buy opportunity in VETUSDTrading suggestion:
". There is a possibility of temporary retracement to the suggested support line (0.08887).
. if so, traders can set orders based on Price Action and expect to reach short-term targets."
Technical analysis:
. VETUSD is in an uptrend, and the continuation of the uptrend is expected.
. The price is below the 21-Day WEMA, which acts as a dynamic resistance.
. The RSI is at 58.
Take Profits:
TP1= @ 0.09407
TP2= @ 0.09990
TP3= @ 0.11053
TP4= @ 0.11929
TP5= @ 0.12825
SL= Break below S2
❤️ If you find this helpful and want more FREE forecasts in TradingView
. . . . . Please show your support back,
. . . . . . . . Hit the 👍 LIKE button,
. . . . . . . . . . Drop some feedback below in the comment!
❤️ Your support is very much 🙏 appreciated!❤️
💎 Want us to help you become a better Forex / Crypto trader?
Now, It's your turn!
Be sure to leave a comment; let us know how you see this opportunity and forecast.
Trade well, ❤️
ForecastCity English Support Team ❤️

VET - VECHAIN; PT 2; see pt1 success, the final stageVET - VECHAIN; PT 2; see pt1 success, the final stage
The final acts are near. Prepare yourself.
See part 1. I am refining this one a lil, reducing top options a bit.
Good luck on the EXIT
vet/usdt 4h chart long ideavet/usdt 4h chart long idea
falling wedge formed...enter after break the trendline
set stoploss for each trade

Vechain (VETUSDT) AnalysisHaving a close look at VETUSDT
Long is the price breaks above the blue line.
Short if the price breaks below the white line.
See where BTC takes us
We can see Bitcoin going down to 40k and lower tonight or maybe tomorrow.
Will keep you updated with targets and other jazz if there is a price break!

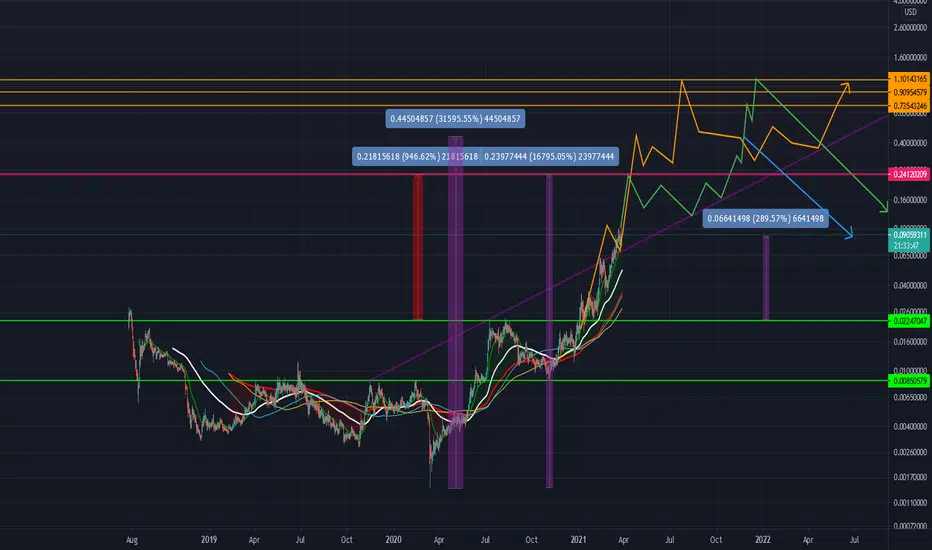
VeChain / USD Fibonacci Analasys 🎯I HAVE TWO SENARIO FOR ALMOST NEXT YEAR
The targets is bullish, but at different times we will see the influx of buyers near the new year, So which is indicated in the chart.
Please share your opinion with me in the comments. 🙏✌

VET/USD $2.50 on the next leg? (Weekly Perspective)VETUSD to $2.50 on the next leg? (Weekly perspective)
Great project. Great team. Extremely bullish in the long term.
What do you guys think?

VeChain (VET) - September 27Hello?
Welcome, traders.
By "following", you can always get new information quickly.
Please also click "Like".
Have a nice day.
-------------------------------------
(VETUSD 1W Chart) - Medium to Long-Term Perspective
Above the 0.03981204 point: the uptrend is sustainable.
Above 0.06265984 point: Expected to create a new wave.
(1D chart)
First support section: 0.06265984-0.08458101
Second support section: near point 0.03981204
First resistance section: 0.12610267-0.14187200
Second resistance section: 0.20955073-0.22890460
A move to break above the first resistance zone should be checked to see if there is a sideways movement within the support zone.
In particular, you should see if the volatility around September 28 (September 27-29) is moving upwards above the 0.09110688 point to break out of the downtrend line.
--------------------------------------
(VETBTC 1W Chart) - Mid to Long-Term Perspective
Above the 136 Satoshi-158 Satoshi section: The upward trend is sustainable.
(1D chart)
First support section: 177 Satoshi-193 Satoshi section
Second support section: 136 Satoshi-158 Satoshi section
It is necessary to check whether it can rise above the volume profile section formed near the 221 Satoshi point.
Therefore, it is necessary to check whether the price is maintained above the 221 satoshi-237 satoshi section.
------------------------------------------
We recommend that you trade with your average unit price.
This is because, if the price is below your average unit price, whether it is in an uptrend or in a downtrend, there is a high possibility that you will not be able to get a big profit due to the psychological burden.
The center of all trading starts with the average unit price at which you start trading.
If you ignore this, you may be trading in the wrong direction.
Therefore, it is important to find a way to lower the average unit price and adjust the proportion of the investment, ultimately allowing the funds corresponding to the profits to regenerate themselves.
------------------------------------------------------------ -----------------------------------------------------
** All indicators are lagging indicators.
Therefore, it is important to be aware that the indicator moves accordingly with the movement of price and volume.
However, for the sake of convenience, we are talking in reverse for the interpretation of the indicator.
** The MRHAB-O and MRHAB-B indicators used in the chart are indicators of our channel that have not been released yet.
(Since it was not disclosed, you can use this chart without any restrictions by sharing this chart and copying and pasting the indicators.)
** The wRSI_SR indicator is an indicator created by adding settings and options to the existing Stochastic RSI indicator.
Therefore, the interpretation is the same as the traditional Stochastic RSI indicator. (K, D line -> R, S line)
** The OBV indicator was re-created by applying a formula to the DepthHouse Trading indicator, an indicator disclosed by oh92. (Thanks for this.)
** Support or resistance is based on the closing price of the 1D chart.
** All descriptions are for reference only and do not guarantee a profit or loss in investment.
(Short-term Stop Loss can be said to be a point where profit and loss can be preserved or additional entry can be made through split trading. It is a short-term investment perspective.)

VET MASSIVE GAINS COMING? Potential buyzone is marked!VET might retest the buyzone mentioned and bounce from there, great to place some entries.

VET at the bottom of ascending channel but...my personal point of view is that VET is going to lose this ascending channel and drop down somewhere around 0.069$ . there are a bunch of reasons for seeing higher prices ( like breaking the recent down trend and even completing a nice pull back , receiving support at the bottom of the ascending channel and etc... ) but with taking a look at indicators and oscillators and also watching BTC movements you can see that there is no desire for VET to take any serious action about moving up .
so anyway , resistances and supports are showed in case of any correction or upward movements .

$VET at resistance#VeChain is facing heavy R after the latest bounce.
As you can see in the chart, the 200D EMA and year long trendline resistance is holding it down here.
Caution is needed here too.
