#VET/USDT#VET
The price is moving in a downward channel and sticking to it well
The price is expected to remain within it for some correction to the support level at 0.02400
The price is below moving average 100, so we have some correction to the support level
Entry price is 0.02400.
First target 0.02684
Second target 0.02940
Third goal 0.03212
Fourth goal 0.023461
VETUSDT

At the beginning of a big move, but wait, the accident is lurkinThis currency is ready to grow by 130% after breaking its important resistance range. This failure can be fake, so it is better to keep an eye on this currency and if it breaks the previous peak and stabilizes it, we can have a safe entry.

VETUSDT.1DBased on the given market data, the current price of VET (VeChain) against USDT (Tether) is at 0.031. The Relative Strength Index (RSI) for 4 hours, 1 day, and 7 days are 69.98, 63.0, and 66.22 respectively, which are near to the overbought territory (RSI of 70 and above). This might suggest that there could be a potential price pullback in the short term.
The Moving Average Convergence Divergence (MACD) for 4 hours, 1 day, and 7 days are positive, indicating a bullish market sentiment. The price is at the Bollinger Bands (BB) middle line for both 4 hours and 1 day, suggesting the market is in a neutral state.
The support levels are at 0.030, 0.028, and 0.027 for 4 hours; 0.028, 0.027, and 0.024 for 1 day; and 0.027, 0.021, and 0.014 for 7 days. Meanwhile, the resistance levels are at 0.031, 0.032, and 0.035 for 4 hours; 0.032, 0.034, and 0.036 for 1 day; and 0.032, 0.039, and 0.044 for 7 days.
In my opinion, although the RSI is nearing overbought levels, the positive MACD indicates bullish sentiment. However, traders should watch out for the resistance and support levels and also the RSI for any potential price reversals. As always, it is recommended to use these technical indicators in conjunction with other information and not rely solely on them for trading decisions.

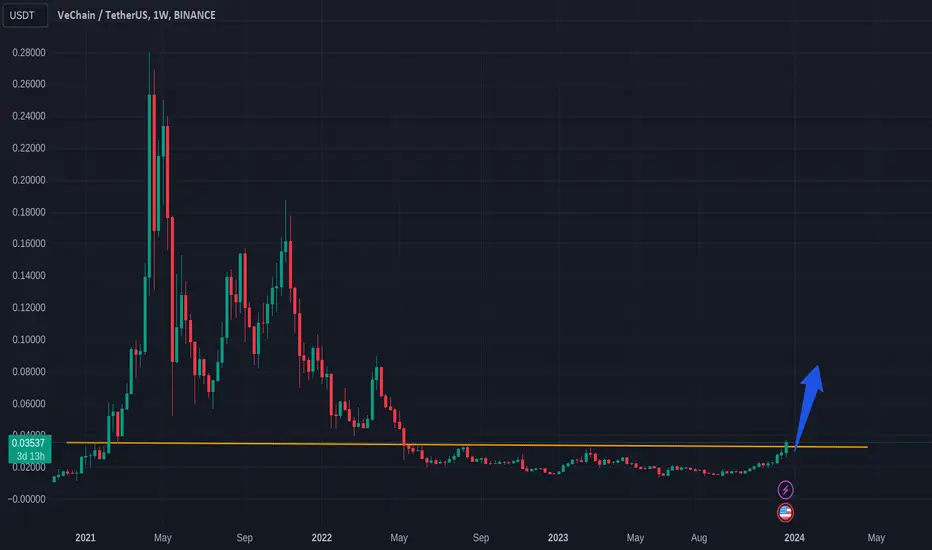
vechain getting ready for 3 to 4x bullish rally seems like has already bottomed out and preparing for solid recovery in coming weeks
Over All Consolidating In Symmetrical Triangle & Recently Breaks Range In Lower Tf Now Approaching Towards Multi Year Trend Line & Expecting Breakout Incase Of Successful Breakout Expecting Massive Recovery In Midterm Expecting 3-4x Bullish Rally


VET / USDT - Bearish SignsShow some weak signs:
1: Break Weekly 200 Moving average and retest which also resistance level at 0.02936
2: Break VWAP
if price continue down move
Target
1. Daily 200 MA
2. 0.02298 level

VET ANALYSIS (4H)On the chart, from where we entered "START", we seem to see a correction.
This correction seems to be a diametric.
There was a suitable place for the termination of the D wave on the chart, which we marked with red color.
If the price reaches this range, you can enter a sell/short position.
We have specified the targets on the chart. We also specified the invalidation level. Closing a daily candle above this level will violate the analysis
For risk management, please don't forget stop loss and capital management
When we reach the first target, save some profit and then change the stop to entry
Comment if you have any questions
Thank You

VECHAIN - Massive Drop Inbound!In our last analysis we identified that we were in wave 4 correction and were looking for one more move lower.
We successfully remained below the wave 4 invalidation level, making our current scenario valid.
We are expecting price to move lower to 0.013 to complete subwave 5 of wave C.
Trade Idea:
- look for shorting opportunities with stops above the wave 4 invalidation level (stops above 0.04)
- Target: 0.013 and then taper as we move lower
Goodluck and trade safe!

it's time to going down for VETUSDTbefore buying, please check for being sure about your opinion about this CRYPTOCURRENCY!!!
(in every target you want, closed the position but our target is the third one)
*Guy's the entry place is importance things in enter in a position and be careful do not going up your leverage over 7x ,all things it's about risk management*
*************************************************
if you want to enter in this position:
Enter Price: here
Target1: 0.03010
Target2: 0.02964
Target3(Final Target): 0.02889
Stoploss: 0.03184
*************************************************
Guy's if this idea was useful and it was intresting for you please follow for more
please do comment and like my idea
If you like my idea show me in comment section
doing and living in the best quality
thanks of all of you dear's ;)

🐮💹🚀 Vet/Usdt Trading Idea 🚀💹🐮
Vet/Usdt is currently showing bullish signs 📈. The market structure has turned into a bullish pattern, and the price is retracing to test a new demand area 🔄. This could signify a potential upward movement. I anticipate a rise in price from this point, potentially ranging between 15-30% 📈🔥.
Remember, this analysis is not financial advice ❌📉. Always conduct your own research (DYOR) and make informed decisions. Happy trading! 💪💰📊

Vechain (VETUSDT) (1W)Below the technical analysis of BINANCE:VETUSDT
Timeframe: 1 week
The main supports and resistances are indicated in the idea: the down green one is the most important; if we lost it, the project is almost done.
Today marketcap: 2.4B

VET is bullish on the daily chartIn the daily chart, VET is moving to the target of $0.073 after breaking its trend lines and main resistances.

🚀 VeChain Analysis: Navigating the Waves 📈VeChain (VET-USD) is showing promise on the 4-hour chart. We are currently in an upward 5-wave structure, specifically in Wave 4. Waves 1 and 2 were completed on September 11, 2023. Following a strong surge for Wave 3, we've observed a recent pullback since the end of last year for Wave 4. I anticipate this wave to find support between 38.2% and 50%. Subsequently, Wave 5 could propel us to possibly reach $0.055 USD. I'll keep you updated as the situation evolves. The Bitcoin spot ETF decision in three days will likely be crucial. 🔍🚀

#VET/USDT LONG#VET
Since July 2022 the price has been moving in a bearish flag
Support was adopted on the bottom border of the flag
Now the price is about to increase this model
And the moving of the Moving Average 100was broken.
Price Now 0.02571
First Goal 0.03265
Second Goal 0.03969
Representing 170% of the current price
You must pay attention to the rebound points to be used.

🚀VeChain (VET) Re-Accumulation Potential and Range Confirmation
#VET rallied +43% to Range High, confirmed to remain inside the range with new Monthly Close.
Potential re-accumulation range above major white breakout structure.
Possible move to tag Range Low as support for affirmation. 🚀📈
#VeChain #CryptoAnalysis

VET/USD Main trend. Accumulation / distribution. Pivot zonesThe main trend. Logarithm. Time frame 1 week.
This time frame is more for orientation, where the price (area to work or monitor now) is in the main trend and what is the potential for price decrease/increase from its values now. The exception, this work and analysis is for investors and position traders with large capital, who are not interested in short-term and medium-term price movements for a small %.
The average prices of the accumulation and distribution zones of the last cycle are marked. Previously actively traded this coin, the previous ideas fixed under this trading idea.
Secondary trend — downward wedge.
Local trend — a potential double bottom in the case of holding the existing support.
Decrease from the price peak -91%.
Profit from the average price of the last accumulation +320% at the moment.
Short work .
I would like to point out that the coin, unlike many cryptocurrencies, is in substantial profit. In case the existing support breaks through, there is a prospect of shorting to the designated reversal zones.
Work in the long.
I have marked the reversal zone support levels and percentage of them to the resistance zones.
Linear chart. Time frame is the same.
Secondary trend.

VET/USD Secondary trend. Wedge. Pivot zones.The secondary trend. Logarithm. Time interval: 3 days.
Secondary trend — downward wedge.
Local trend — a potential double bottom in the case of holding the existing support.
Decrease from the price peak -91%.
Profit from the average price of the last accumulation +320% at the moment.
Short work.
I would like to point out that the coin, unlike many cryptocurrencies, is in substantial profit. In case the existing support breaks through, there is a prospect of shorting to the designated reversal zones.
Work in the long.
I have marked the reversal zone support levels and percentage of them to the resistance zones.
Linear chart. Time frame is the same.
Local area of double bottom 40%
Major trend. Time frame 1 week.
VET/USD Main trend.Accumulation/distributionPivot zones

vet bullish on weekly !BINANCE:VETUSDT weekly reg broken. now it will pump very soon.
expecting a pullback.
you can buy and hold now or wait for a pullback
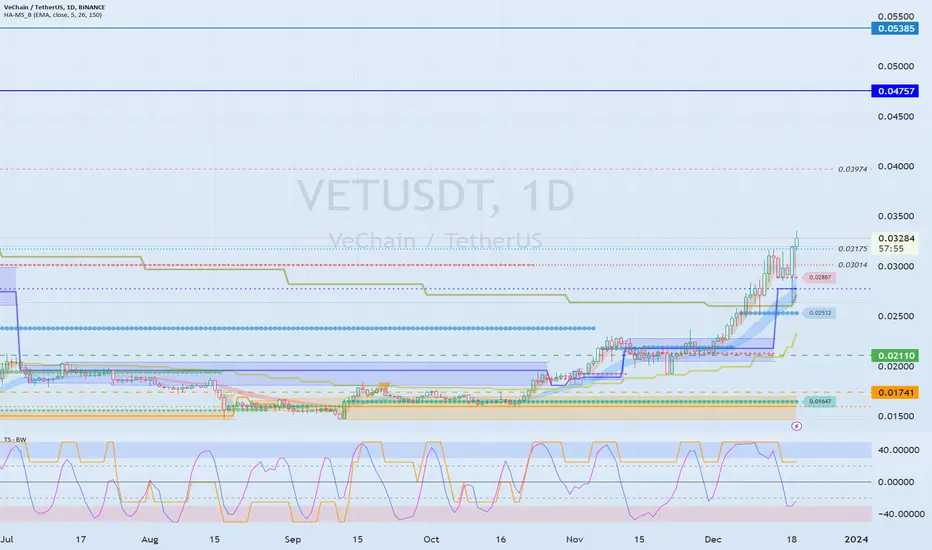
The key is whether the price can be maintained above 0.03175Hello traders!
If you "Follow" us, you can always get new information quickly.
Please also click “Boost”.
Have a good day.
-------------------------------------
(VETUSDT chart)
(1D chart)
As it rises above 0.02776, I think the possibility of a full-fledged upward trend has increased.
However, since the long-term moving average is still reversed, the key is whether the price can be maintained around 0.03175.
If that happens, it is expected to rise above 0.04757-0.05385 and escape the bottom range.
If it falls below 0.03014-0.03175,
1st: 0.02776
2nd: 0.02110
You need to check if you receive support near the first and second levels above.
--------------------------------------------------
- The big picture
The full-fledged upward trend is expected to begin when the price rises above 29K.
This is the section expected to be touched in the next bull market, 81K-95K.
-------------------------------------------------- -------------------------------------------
** All explanations are for reference only and do not guarantee profit or loss in investment.
** Trading volume is displayed as a candle body based on 10EMA.
How to display (in order from darkest to darkest)
More than 3 times the trading volume of 10EMA > 2.5 times > 2.0 times > 1.25 times > Trading volume below 10EMA
** Even if you know other people’s know-how, it takes a considerable amount of time to make it your own.
** This chart was created using my know-how.
---------------------------------
VET/USDT Bracing for Potential Breakthrough Resistance? 👀 🚀💎 Paradisers, focus on #VETUSDT as it showcases a promising development. The asset is approaching a crucial resistance level, with strong indications of an upward movement on breaching this barrier.
💎 Reflecting on #VeChain recent market behavior, it has consistently followed a descending channel pattern. Recently, it broke above this channel and is now gearing up to challenge the resistance at the $0.03793 zone. There’s a significant likelihood that NYSE:VET will embark on an upward journey, aiming to overcome this major resistance.
💎 #VET traders should remain versatile and ready for different outcomes. If it fails to sustain its upward trajectory and dips below the current demand level of $0.02741, the market's direction could shift. Traders may then need to pivot their focus towards a bullish recovery from a slightly lower demand level of $0.02653.
💎 Crucially, a fall below this lower demand level would be a signal to reassess the situation. Such a development could indicate challenges in maintaining the bullish trend, requiring a strategic reevaluation of the market approach. 🌴💰

VETUSDT Good Buy!VETUSDT Technical anlaysis Update
BINANCE:VETUSDT price is breaking through its major resistance line with high volume. We can expect a 50-100% upward move in the medium term.
Buy zone : Below $0.0307
Stop loss : $0.0272
Always Keep Stop Loss
Regards
Hexa

VET/USDT Bullish Outlook from Key Support Level? 👀 🚀VeChain💎 Paradisers, focus on #VETUSDT as it displays a promising pattern. The asset is currently maintaining a critical support level and is gearing up for a potential bullish movement.
💎#VeChain has shown a tendency to follow a descending trendline, breaking above it to initiate an upward trajectory. Presently, after retesting the trendline, it is demonstrating strong momentum at the key support level of $.02125. A break above the resistance at $.02188 could significantly increase the chances of a robust bullish movement. Should this upward momentum be sustained, NYSE:VET is set to target the resistance level at $.02262, with the possibility of extending to challenge further resistance at $.02372
💎 It’s also essential to be prepared for the scenario where #VET might fall below the support level of $.02123. In such an event, a bullish rebound from a lower support level of $.02071 could be expected. However, a descent below this level might raise questions about the sustainability of the bullish trend.
💎 In this dynamic trading environment, strategic insight and informed decision-making are crucial. Crafting a comprehensive trading strategy that encompasses effective money management and a thorough grasp of support and resistance levels is key to securing successful trading outcomes. 🌴💰

Clear exit liquidation ! #vetusdtBased on our ai analysis, it is about to visit 0.023 - 0.024 levels.
Long/short ratio also supports our idea !
Test the accuracy ! Use AI !
