Daily Bullish Signal $VIB #VIB #VIBBTC (5 March 2019)RED ARROW indicates the EXPECTED Time and Targets
Level Stoploss point up to maximize profit and reduce risk
I'm working all the time, even in Bearish Market
Vib

VIBBTCYou can see four different scenario but profitable. we hope pitchfork breakout and green boxes can bee available.

Pushing... $VIB Trying to break above the descending trendline in the chart. Volume slowly rising, Both MACD & RSI bullish. Stop loss can be placed below ~560sats and potential targets are 727-790-895sats. #VIB

There is a trading opportunity to buy in VIBETHTechnical analysis:
. Viberate/Ethereum is in a range bound and the beginning of uptrend is expected.
. The price is below the 21-Day WEMA which acts as a dynamic resistance.
. The RSI is at 42.
. The price downtrend in the daily chart is broken, so the probability of the resumption of an uptrend is increased.
Trading suggestion:
. There is a possibility of temporary retracement to suggested support zone (0.00017140 to 0.00013250). if so, traders can set orders based on Price Action and expect to reach short-term targets.
Beginning of entry zone (0.00017140)
Ending of entry zone (0.00013250)
Entry signal:
Signal to enter the market occurs when the price comes to " Buy zone " then forms one of the reversal patterns, whether " Bullish Engulfing ", " Hammer " or " Valley " in other words,
NO entry signal when the price comes to the zone BUT after any of the reversal patterns is formed in the zone.
To learn more about " Entry signal " and the special version of our " Price Action " strategy FOLLOW our lessons:
Take Profits:
TP1= @ 0.00023450
TP2= @ 0.00029250
TP3= @ 0.00034650
TP4= @ 0.00041500
TP5= @ 0.00049900
TP6= @ 0.00071490
TP7= Free

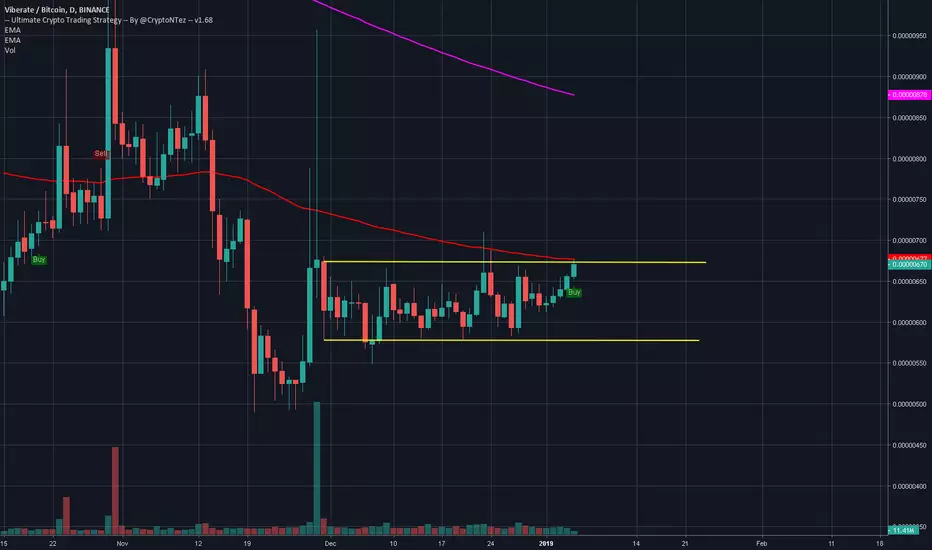
LONG - VIB - Trade OpportunityA lot of accumulation has been happening since the last crazy pump end of november, really nice MA confluence on multiple timeframes like the 2h and the daily.
This is one that's worth holding for some time.
ENTRY: 0.00000647 BTC each
1st TP: @ 0.00000710
2nd TP: @ 0.00000731
3rd TP: @ 0.00000786
4th TP: @ 0.00000893
Stop loss: @ 0.00000617
CryptoCue is not providing investment advice and is not taking subscribers’ personal circumstances into consideration when discussing investments. Investment involves a high degree of risk and should be considered only by persons who can afford to sustain a loss of their entire position.
CryptoCue is not registered, licensed or authorised to provide investment advice and is simply providing an opinion, which is given without any liability or reliance 1.71% whatsoever. The information contained here is not an offer or solicitation or recommendation or advice to buy, hold, or sell any security. CryptoCue makes no representation as to the completeness, accuracy or timeliness of the material provided and all information and opinions provided by CryptoCue are subject to change without notice and provided on a non-reliance basis and without acceptance of any liability or responsibility whatsoever or howsoever arising. You hereby irrevocably and unconditionally waive, release and discharge: (a) any and all accrued rights and/or benefits you may have against CryptoCue in respect of any opinion expressed or information conveyed by CryptoCue at any time; (b) any and all Claims you may have against CryptoCue arising out of any opinion expressed or information conveyed by CryptoCue at any time; (c) CryptoCue from all and any claims (whether actual or contingent and whether as an employee, office holder or in any other capacity whatsoever) including, without limitation, Claims you may have against CryptoCue arising out of any opinion expressed or information conveyed by CryptoCue at any time. ("Claims" shall include any action, proceeding, claim, demand, judgement or judgement sum of whatsoever nature or howsoever arising.) You hereby agree to indemnify and hold harmless CryptoCue in respect of any and all Losses paid, discharged, sustained or incurred by CryptoCue in the event of bringing any Claim against CryptoCue. (“Losses” shall include any and all liabilities, costs, expenses, damages, fines, impositions or losses (including but not limited to any direct, indirect or consequential losses, loss of profit, loss of earnings , loss of reputation and all interest, penalties and legal costs (calculated on a full indemnity basis) and all other reasonable professional costs and expenses and any associated value added tax) of whatsoever nature and/or judgement sums (including interest thereon).)
CryptoCue is not a broker-dealer or financial adviser and is not affiliated with an investment advisory firm and does not engage in activities that would require such registration or authorization by any governmental or regulatory or supervisory authority or body.
CryptoCue and/or any persons affiliated with CryptoCue, are not responsible for any gains or losses that result from the opinions expressed herein.
Investors should consult their registered authorised professional financial advisor before investing. Opinions discussed herein have not been reviewed by the securities and exchange commission or any state or other.


There is a possibility for the beginning of an uptrend in VIBETHTechnical analysis:
. VIBERATE/ETHEREUM is in a range bound and the beginning of uptrend is expected.
. The price is above the 21-Day WEMA which acts as a dynamic support.
. The RSI is at 56.
. The price downtrend in the daily chart and the RSI downtrend are broken, so the probability of the resumption of an uptrend is increased.
Trading suggestion:
. There is a possibility of temporary retracement to suggested support zone (0.00017140 to 0.00013250). if so, traders can set orders based on Price Action and expect to reach short-term targets.
Beginning of entry zone (0.00017140)
Ending of entry zone (0.00013250)
Entry signal:
Signal to enter the market occurs when the price comes to " Buy zone " then forms one of the reversal patterns, whether " Bullish Engulfing ", " Hammer " or " Valley " in other words,
NO entry signal when the price comes to the zone BUT after any of the reversal patterns is formed in the zone.
To learn more about " Entry signal " and the special version of our " Price Action " strategy FOLLOW our lessons:
Take Profits:
TP1= @ 0.00023450
TP2= @ 0.00029250
TP3= @ 0.00034650
TP4= @ 0.00041500
TP5= @ 0.00049900
TP6= @ 0.00071490
TP7= Free

There is a possibility for the beginning of an uptrend in VIBETHTechnical analysis:
. VIBERATE/ETHEREUM is in a range bound and the beginning of uptrend is expected.
. The price is above the 21-Day WEMA which acts as a dynamic support.
. The RSI is at 59.
. While the price downtrend in the daily chart is not broken, bearish wave in price would continue.
. The RSI downtrend is broken, so the probability of the resumption of an uptrend is increased.
Trading suggestion:
. There is a possibility of temporary retracement to suggested support zone (0.00017140 to 0.00013250). if so, traders can set orders based on Price Action and expect to reach short-term targets.
Beginning of entry zone (0.00017140)
Ending of entry zone (0.00013250)
Entry signal:
Signal to enter the market occurs when the price comes to " Buy zone " then forms one of the reversal patterns, whether " Bullish Engulfing ", " Hammer " or " Valley " in other words,
NO entry signal when the price comes to the zone BUT after any of the reversal patterns is formed in the zone.
To learn more about " Entry signal " and the special version of our " Price Action " strategy FOLLOW our lessons:
Take Profits:
TP1= @ 0.00023450
TP2= @ 0.00029250
TP3= @ 0.00034650
TP4= @ 0.00041500
TP5= @ 0.00049900
TP6= @ 0.00071490
TP7= Free

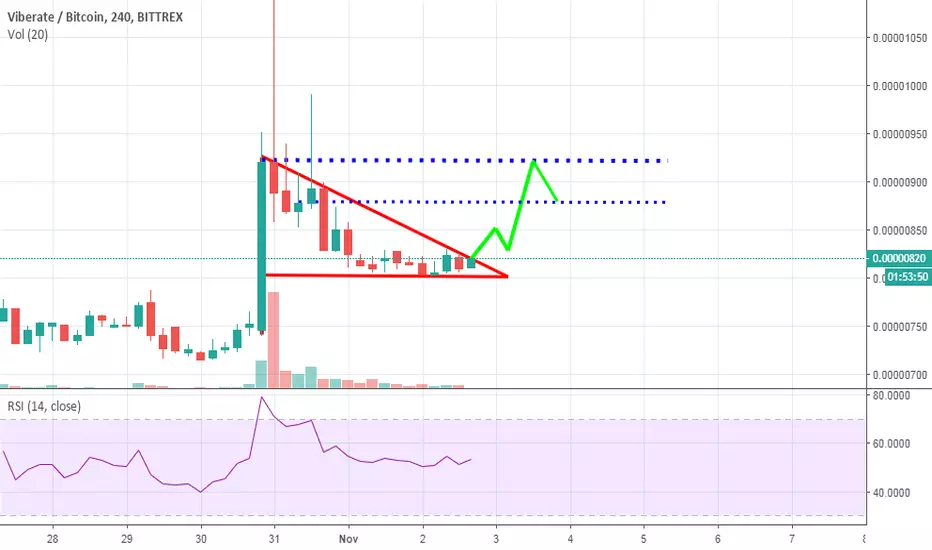
trying to break above horizontal channelSet up alerts at 700sats and wait.
Buy signal in the Ultimate Crypto Trading Strategy but great resistance till that level.

VIBBTC VIB that high volume in this area so VIB go to fist target at least
if VIB go to stop loss buy another from HVN

VIB will move higher and you will miss the analysisI see VIB coin will pump hard and growing 75-160% very very soon and I will explain why will this will happen.
First thing the buying order executed is very large amount exceeded 500 btc & the executed selling order is 40 btc only.
Second thing if you see the following chart we have a two triangle the biggest one in blue color well soon be broken and the small triangle in reed color also will be broken soon and we have a broken trend in green color.
this is a good sign to break the triangles soon and it will growing 75%-160% and the target is on the chart.
Third thing if you open the volume profile you will see a HVN area is broken and the price now fixed higher the HVN area.
don't forget to subscribe to my account and my telegram channel
t.me

Nice narrow channel
Look at this beauty. Such a long accumulation period. It gonna blow out soon. Hopefully UP.
Targets 660 - 720 - 780 - 840. All that for bullish BTC.
SL below 590.

VIB Trading AdviceBuy Price: Yellow Line
TP: Green Lines
Moon: White Line
Support: Blue Line
SL: Red Line
Invest Suggestion: 5-10 Percent
Profit Expectations: 5, 10 or >20 Percent
Just hold and watch. Sell when you get some profit. Good Luck!
Looks Good? Leave a like, share and tell me in comments if my trading advices are working for you.
Thanks for visiting.


[VIBBTC][360% PP] Viberate Inverted Hammer @alanmastersViberate (VIB) Overview
A SMARTER WAY TO EXPLORE LIVE MUSIC.
Viberate enables you to browse through the biggest music database in the world.
Compare the stats gathered here to determine who’s going to shoot up to the stars.
Viberate (VIB) Trade Analysis by Alan Masters
We are looking at VIBBTC for a long term trade. Let’s start with the weekly chart:
We have many altcoins creating new lows and breaking support on November but this isn’t the case for VIBBTC.
VIBBTC held its price creating a higher low in late Nov.
The weekly candle when this higher low was created is also a inverted hammer. This is a bullish signal when it comes at the bottom of a downtrend.
On top of the inverted hammer showing up at the bottom of the trend, there is also a huge volume bar, the biggest volume ever for VIBBTC on Binance, higher than January’s bull run volume.
With increasing volume and a clear uptrend, these signals are strong enough for us to trade… Let’s get started.
Trade Instructions (VIBBTC)
Buy in: 0.00000580 – 0.00000630
Next support: 0.00000530
Targets:
(1) 0.00000770
(2) 0.00000940
(3) 0.00001270
(4) 0.00001470
(5) 0.00001870
(6) 0.00002350
(7) 0.00002900
Stop loss: Close weekly candle below 0.00000430
Capital allocation: <10%.
WHEN YOU REALLY WANT SOMETHING YOU… ASK FOR IT, FIGHT FOR IT
Whenever you want something… ask for it.
Whenever you need anything… fight for it.
Because you have to ask to receive.
Don’t wait for it to magically come to you…
You must ask for it, fight for it…
If you really want it… that’s what you do.
Namaste.

Viberate Inverted Hammer (360% Profits Potential)Viberate (VIBBTC) Analysis by Alan Masters
We have many altcoins creating new lows and breaking support on November but this isn’t the case for VIBBTC.
VIBBTC held its price creating a higher low in late Nov.
The weekly candle when this higher low was created is also a inverted hammer. This is a bullish signal when it comes at the bottom of a downtrend.
On top of the inverted hammer showing up at the bottom of the trend, there is also a huge volume bar, the biggest volume ever for VIBBTC on Binance, higher than January’s bull run volume.
With increasing volume and a clear uptrend, these signals are strong enough for us to trade… Let’s get started.
Note: Hit LIKE if you enjoyed this article.
WHEN YOU REALLY WANT SOMETHING YOU… ASK FOR IT, FIGHT FOR IT
Whenever you want something… ask for it.
Whenever you need anything… fight for it.
Because you have to ask to receive.
Don’t wait for it to magically come to you…
You must ask for it, fight for it…
If you really want it… that’s what you do.
Namaste.


IT'S YOUR TURN VIB LEST GOBuy Above : 0.00000830
Flash Sell 1 : 0.00000850
Sell 2 : 0.00000880
Sell 3 : 0.00000920
Sell 4 : 0.00001000
VIBBTC "Viberate Strong Opportunity Upto 30-40% ProfitHere I have drawn Support Zone 550-650 which is strong support coming from 4Hr and 1Day Chart. Also Macd and Rsi are looking well.
We have to wAit a little correction may come to attract buy zone again. if there are long term investors they can buy on this rate and book profit on our primary target..

VIB Ready for 2nd run?Buy Price: Yellow Line
TP: Green Lines
Moon: White Line
Support: Blue Line
SL: Red Line
Invest Suggestion: 5-10 Percent
Profit Expectations: 5, 10 or >20 Percent
Just hold and watch. All targets will be reached within 24 to 72 hours as my prediction. Moon can take >15 days. But it's recommended to hold it for 6-7 days if any target not reached. Sell when you got some profit. I am sure, you will be get nice profit. Good Luck!
Looks Good? Leave a like, share and tell me in comments if my trading advices are working for you.
Show your love.
Please ask me for any coin address to make a donation.
Thanks for visiting.
Previous Idea:

$VIB / $BTC 4h: Inverse Head & Shoulders patternVIB - Inverse Head and Shoulders pattern. Low volume, but it can shoot out.
Breakpoint rate: 0.00000807
Take-profit rate: 0.00000893
Profit percentage (%): 10.66%
Stop-loss: 0.00000771
Breakpoint date : 2018-11-07 20:05:00
Timelimit date : 2018-11-10 20:05:00
Entry risk: -4.46%
Risk/Reward: 0.42

VIB Trading AdviceBuy Price: Yellow Line
TP: Green Lines
Moon: White Line
Support: Blue Line
SL: Red Line
Invest Suggestion: 5-10 Percent
Profit Expectations: 5, 10 or >20 Percent
Just hold and watch. All targets will be reached within 24 to 72 hours as my prediction. But it's recommended to hold it for 6-7 days if any target not reached. Sell when you got some profit. I am sure, you will be get nice profit. Good Luck!
Looks Good? Leave a like, share and tell me in comments if my trading advices are working for you.
Show your love.
Please ask me for any coin address to make a donation. I need donations for keep up this service.
Thanks for visiting.
