VIDT - UpdateVIDT is approaching the edge of its current trading channel. Caution is warranted, as a pullback to the first support level at $0.0009 remains a possibility. The next support level is less encouraging and would signal further weakness.
VIDT has struggled post-delisting, unlike projects such as ALPACA, VOXEL, and ARGO, which experienced a resurgence. At this point, VIDT is showing little sign of recovery and may even be considered a dormant or "dead" coin. ATM it is very indecisive.
That said, if buying interest returns, a move toward the $0.003–$0.006 range is feasible — a modest recovery that would place the market cap between $3M and $6M, still far below the FWB:30M cap it held before the major sell-off.
Vidt

Very likely x's on alpacaAlong with the pda and vin, alpaca may show good growth in the upcoming bullish cycle. This month, the token was not included in the delisting announcement, and an active set of positions began because it is in an extremely oversold position. Previously, many signals were left with attempts to return to 0.15, and this month there is a possibility of working out this goal under an optimistic scenario. At the moment, the main goal is an attempt to consolidate above 0.075, from where an increase in volatility is likely. When a new week or the second half of the month opens above the level, the reaction will not take long. I would like to draw your attention to the fact that, unlike vib and pda, this token has already changed the trend on the daily chart, which can lead to fairly stable growth.

VIDT - Die or FLYUPDATED Chart with travel channels:
VIDT got absolutely nuked after the Binance delisting announcement, leading to a brutal sell-off and a local ATL (all-time low). But now things are getting interesting...
🔻 Falling wedge has formed on the 4H chart — a classic bullish reversal pattern.
📉 RSI is printing bullish divergence, signaling momentum could be shifting.
📊 Volume has been fading since the dump, which often precedes a breakout.
Key Levels:
Resistance atm: ~0.0015 — needs to break this to confirm any recovery.
Target Zones: Multiple green lines overhead (based on prior structure / Fibs), with the highest one suggesting a 10x move from the local bottom.
Support: Around 0.0013 (11) — wedge support and recent lows.
The sentiment is in the gutter after the Binance news, but oversold setups like this sometimes lead to explosive relief rallies — especially if shorters get squeezed or speculators start bottom-fishing.
⚠️ Super high risk — but setups like this can offer high reward too.
🧠 Not financial advice — just watching for a potential bounce setup.
Let’s see if VIDT has one last dance in it.

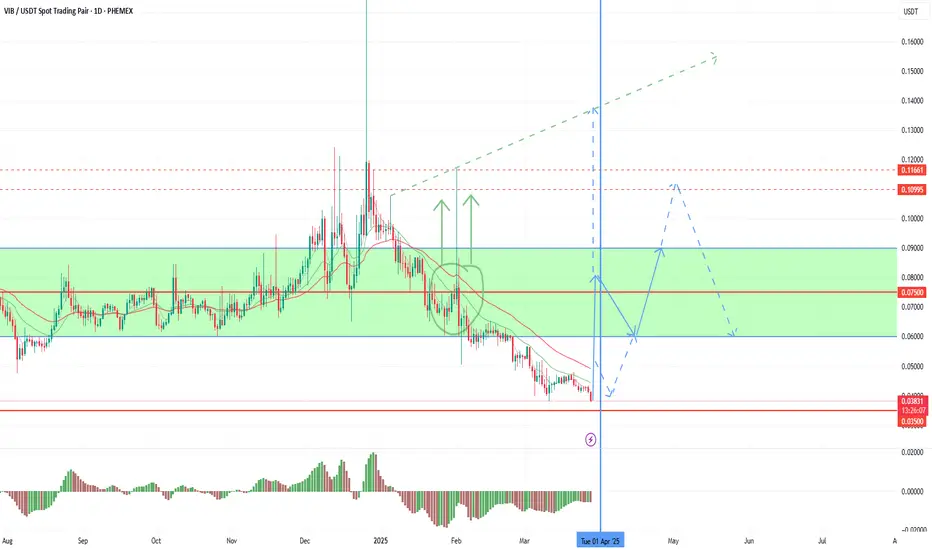
A new growth opportunity for VIBVIB is preparing a new growth momentum today. As I wrote in previous reviews, finding a token below the 0.035 level is appropriate when the ether is below 1500, even if there is a monitoring tag. At the moment, the breakdown is more likely caused by panic sales on tag assignment. However, the assignment of the tag was obviously already worked out by the price when it fell below the 0.075 support. At the moment, I expect to enter the more appropriate 0.050-75 zone, corresponding to both the current market position and the tag. The opportunity for a refund will appear as soon as the indicators stop extinguishing sales, which has already happened on small timeframes. That is, today and tomorrow there is a high probability of a weekly candle reversal above the key support of 0.0350–375, and in the case of a daily or weekly candle opening higher, attempts to grow to 0.075-100 are likely, which is the main non-closed retest zone after the January impulse and is highly likely to be worked out. A retest of 0.035-50 from the current level will bring up to 100%+ profit.

VIDT BIG looser from Binance Delisting, any chance for recovery?VIDT got absolutely nuked after the Binance delisting announcement, leading to a brutal sell-off and a local ATL (all-time low). But now things are getting interesting...
🔻 Falling wedge has formed on the 4H chart — a classic bullish reversal pattern.
📉 RSI is printing bullish divergence, signaling momentum could be shifting.
📊 Volume has been fading since the dump, which often precedes a breakout.
Key Levels:
Resistance atm: ~0.0015 — needs to break this to confirm any recovery.
Target Zones: Multiple green lines overhead (based on prior structure / Fibs), with the highest one suggesting a 10x move from the local bottom.
Support: Around 0.0013 (11) — wedge support and recent lows.
The sentiment is in the gutter after the Binance news, but oversold setups like this sometimes lead to explosive relief rallies — especially if shorters get squeezed or speculators start bottom-fishing.
⚠️ Super high risk — but setups like this can offer high reward too.
🧠 Not financial advice — just watching for a potential bounce setup.
Let’s see if VIDT has one last dance in it.

VIDT - I know it's being delisted IDEAWe all know by now that VIDT is being delisted from Binance, and yes, that’s a heavy hit. But seeing this crash from 35 sats to just 5 sats in a matter of hours—it’s hard to ignore. Honestly, the urge to scoop some up here is real.
There’s a clear bullish divergence on the chart, but let’s put that aside for a second. The real point is: VIDT was among the last coins expected to be delisted according to Binance’s own community voting. Only one other coin had fewer votes.
On top of that, VIDT is still actively listed on major exchanges like KuCoin and MEXC, so it’s not disappearing. You can still hold and move your tokens—this isn’t a total rug.
Now let’s talk volume. This selloff saw over 39M in volume, which is insane for a project sitting under a $5M market cap. That kind of flush doesn't happen often—and when it does, it can present a rare opportunity.
Yes, it’s getting delisted. But value and fundamentals didn’t disappear overnight. Binance is becoming increasingly aggressive with delistings, while ironically listing more meme or low-utility tokens. Time for them to rethink what they're doing—liquidity isn't everything.
✅ I’m buying here—not financial advice, but this setup is too tempting.
🎯 Short-term potential: 2x–3x 📦 Holding the rest for the long game—let’s see how this plays out.

Is VIDT about to drop? Don’t ignore the bearish signs! (3D)Note: The funding fee for this asset in futures is very high, and it's also a highly volatile and risky asset. Be cautious when taking positions on it.
Note: This coin is on Binance's delisting red list.
Since the point where we placed the green arrow on the chart, this asset has started forming a symmetrical pattern.The pattern has generally been upward, although it eventually transitioned into a sideways movement.
We are currently in the final bullish wave of this pattern, known as wave I. The red zone marks an optimized supply area. if the price reaches this zone, it presents a potential Sell/Short opportunity.
A daily candle closing above the invalidation level will invalidate this analysis.
For risk management, please don't forget stop loss and capital management
When we reach the first target, save some profit and then change the stop to entry
Comment if you have any questions
Thank You

Growth to 150-250% by pda in the coming week.As I wrote earlier, April is the most powerful seasonal growth period in the first half of the year. The first half of the month was under selling pressure against the background of the continuation of the trend of the previous month and quarter, but as we approach the middle of the month, the activity of buyers is likely to begin to increase and from the second half of this week we can expect breakouts in coins with a subsequent trend. To date, coins with the monitoring tag that are not included in the delisting announcement have a high probability of growth, because They are the most oversold due to concerns related to the announcement, but now they have time to wait for the next announcement. Wing was the first to react, and it retains the probability of a new wave of up to 50%+ this month. But today I want to focus on the pda, where the main goal is to retest the range of 0.021-25 at least and attempt a test of 0.035-50 with sufficient volatility. Even with growth towards the immediate goal, the profit will be up to 150%+. VIB and alpaca have similar potential.
More interesting assets for speculators are only the coins from the delisting announcement, because due to the minimal capitalization, even a small influx of buyers gives a large percentage of growth. In this regard, before the actual delisting, there is a possibility of powerful exit pumps this week, as it already was on vidt. In particular, according to uft, the momentum may reach several x's by the end of the week. Cream and troy have less potential, but they can also show profitable growth impulses in the event of increased customer activity in the market. I would like to note that uft and troy have very high non-closed targets on the retest of 0.21-25 and 0.0031-35, which may lead to growth after delisting from binance at the expense of other exchanges.

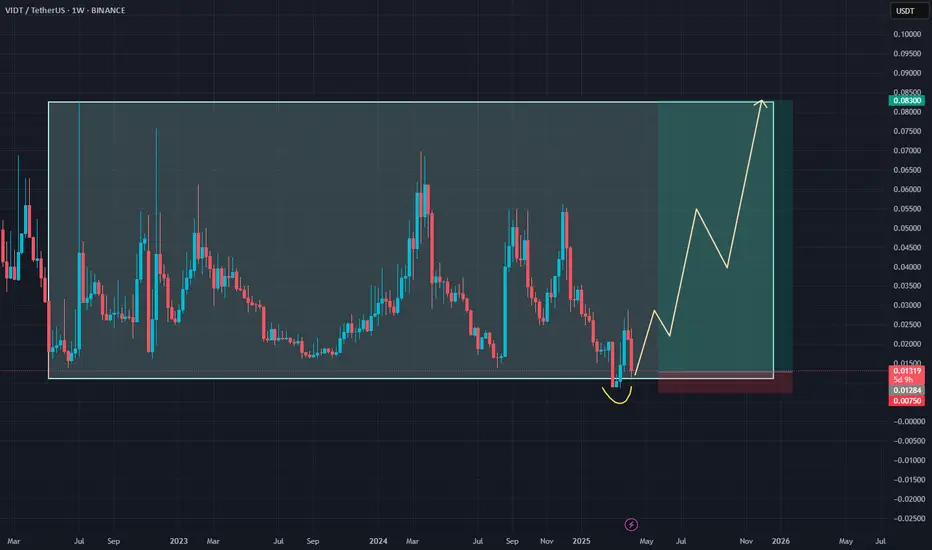
VIDT: High-Risk, High-Reward Setup at Range Low#VIDT is moving in a clear sideways range, and we’re now trading right at the lower boundary. This is a high-risk trade, but the potential reward justifies the setup—especially if we see a strong bounce from current levels.
Don’t miss the next moves—make sure to follow for more setups like this.
Entry: 0.013
TP: 0.083
SL: 0.0075
VIDT Datalink Hodl positionVIDT looks to clear the weekly descending trend-line at $0.04000 so it can commence its bull market structure.
Wait for break above and buy the strength

New opportunities for earning money on VIPTo date, we have come close to a change in the quarter and a high probability of increased volatility. The second half of the monthly candle on ether opened in the negative zone, which gives a signal to hold sales until the end of the quarter. However, in recent days, individual coins have the opportunity to work out their accumulated potential with a bullish reversal of the monthly candle. VIB is currently the most oversold coin without the monitoring tag. Against the background of the pinbar of the last monthly candle, there were few buyers this month, but technical buy signals were left up to a 0.1 retest even with the current market position.
In an optimistic scenario, today's daily candle may turn bullish with continued purchases until the end of the quarter. Negative statistics on the United States today may contribute to this. In the case of a reversal in the current quarter, the target may be a local breakout and retest of the trend line formed by the previous breakdown.
With less volatility and strong statistics coming out in the US today, the probability of a rebound from the retest of past hows in the range of 0.110-125 and a transition to a flat near the key long-term level of 0.075 +-15 prevails. In this case, the start of purchases may be delayed until the opening of a new quarter, or the next announcement on the assignment of the monitoring tag.
The main long-term support is 0.035, a hike below which is possible only under extraordinary circumstances with the withdrawal of ether by 1,500, the dominance of alcoins by 7.5% or the assignment of the monitoring tag. Given the current oversold conditions and high targets, assigning the tag will only give a temporary departure below 0.035 with further growth to 0.075, similar to vidt.
In addition to vib, among coins without the monitoring tag, so far I am considering only pda with a possible new wave of growth, especially if the tag is not assigned in the new month.
The coins that already have the monitoring tag are the most oversold on binance, due to which they have shown good growth impulses in the last two weeks against the background of attempts to reverse the quarter. Before the next delisting announcement, there is time for new waves to reverse the current quarter under an optimistic scenario, as vidt shows, and a pullback already in the new quarterly candle. The most interesting scalping companies among this group today are uft troy alpaca with a growth potential of up to 100%+ and cream nuls with a possible growth of up to 50%+.
VIDTUSDT(VIDTDAO) Updated till 28-03-25VIDTUSDT(VIDTDAO) Daily timeframe range. PA trying to hold above its 0.01233 level. it can have some relief if it gets a valid close above 0.02066. not so much retail interest it can see better day if market gets some volume.

A new opportunity to attempt a pullback on the quarterly candleToday, a new opportunity for market growth has emerged, and I want to consider it. First of all, I want to emphasize the discrepancy in fundamental factors. The crypt was brought down against the background of a trigger that I paid attention to first of all – wti oil went below 71 and at the opening of the new week, the crypt immediately reacted, in anticipation of a drawdown of the foreign exchange market and the growth of the dollar following oil. However, the subsequent mass of negative statistics on the United States completely offset the impact of oil and the euro went above 1.050 and even 75, which so far strengthens purchases. As a result, the crypto market remains in an oversold position relative to other markets.
Given the picture and binance's aggressive measures to keep the market at the bottom, the situation looks like another giveaway game. The Amers tried to bring down the market by selling oil. Against this background, ether opened the month below 2250, which gives a technical signal for sales up to 1900. At the same time, binance was not against helping to delay the pullback of the quarterly candle as close as possible to its close, which would open a new quarter above 2250 or 2500, giving a signal to maintain purchases. Such a picture and the negative opening of the month reduce the goals that we can achieve from above this quarter, we are no longer talking about 3,500 on the air. However, if the altcoin index goes from 8.5% to 10-11, according to my expectations, the ground will be sufficient for coin breakouts.
And so, after the sales in the first half of the month, against the background of the bearish last candle and the opening of this month below 2250, this week it is worth preparing for a new attempt to roll back the quarter, which will begin with the reversal of the month as it passes its middle. This week, there is a high probability of breakouts of similar rare pros or burger on many oversold coins.
First of all, it is worth noting uft vidt alpaca, which binance artificially pushed below the technically relevant market levels by assigning the tag monitoring. Given the assignment of the tag, it is worth calculating the upper limit of the flat at 0.25 for uft, 0.025 for vidt and 0.15 for alpaca. From attempts to test these levels, it is more reliable to reduce positions and move lower on the next market drawdown. There is a high probability that, under the pressure of the new tag, these instruments will flatten from marked loyalties to these resistances until the fall and reach higher targets only by the end of the year. In my opinion, there is also a high probability that the monitoring tag was added temporarily to create profitable entry points for large investors and reset the hamsters, since the tokens were trading with fairly good dynamics and futures were added to them at the end of the year for a specific purpose. The picture resembles manipulations with pros. These tokens are now in the most oversold position and are very interesting to work with, because in case of rollbacks they will give up to 50-100%+ growth.
Among the coins with the monitoring tag, I also consider troy and cream to work, but they are now inferior in growth potential by up to 50%. It should be borne in mind that, depending on the activity of buyers, troy can test the left technical signal at 0.0032-35 and repeat the pros pattern. There is no such goal for cream. The combo can also show up to 30-50% growth, but it is in a less oversold position and there is a possibility of testing supports at 0.100-125 and subsequent growth with the main resistance at 0.25. I am not considering other coins with the monitoring tag in the current market picture yet. I would like to remind you that there has been no delisting so far this month, and in the first half of the week before lunch, it is worth keeping a short stop at the current coin price with the tag monitoring in case of delisting.
After changing the frequency of operations with the monitoring tag from quarterly to monthly, coins without the tag are in danger of a double collapse. First on tag assignment, then in the case of delisting. We were finally prevented from identifying more reliable instruments among those that were oversold and had accumulated great potential for a rebound. After assigning a tag to more than fifty coins over the summer at such a pace, I think binance will start removing the tag for over-traded coins at the bottom, where we again lose the opportunity to determine which coins can fail in this case. However, based on indirect signs of past volatility and the addition of futures, I suspect that the tag may be removed from coins such as alpaca uft vidt pros ctxc combo troy aergo.
Among coins without the monitoring tag, vib still stands out strongly, according to which there is a high probability of an exit attempt to 0.1+. Until next month and the new assignment of the tag, the monitoring token is reliable, which can lead to a sharp influx of buyers at the turn of the quarter. Relative to the market, it is also in the zone of extreme oversold conditions, and at the current price of ether, the range of 0.075-90 is more appropriate for vib. Purchases are still rather sluggish under the pressure of indicators and a pullback after the breakdown of last month, but in the near future there is a high probability of leveling off into the specified range at least. In a negative scenario, without steady growth under market pressure this month and the assignment of monitoring in the new one, the token has nowhere to fall, which also makes investments from the current position quite reliable.
In addition to vib, among coins without the monitoring tag that are reliable until the new month, pda stands out strongly with a growth potential of up to 80%+. In case of general market growth, I also consider voxel farm og wing to scalping. For voxel and farm, there is a probability of a drawdown of up to 25-30% in the event of a negative market and the departure of ether to 1900, but with market growth, impulses of up to 30-40% are likely from current levels. According to wing and og, emission data from different sources began to diverge, which could lead to a drawdown to 1.5 and 2.5, respectively, with a negative market and falling ether. If the market grows from current levels, growth waves of up to 30-40% are also likely.

A new wave of VIB growthToday, another opportunity has formed for vib, which once again showed the best dynamics in January with a breakdown of 90%+. The year for the token opened quite positively above 0.0975, which gives a signal to consolidate above 0.01 in the future. The last impulse was given by the collapse of the last peaks, which gives a signal for at least a retest of strong resistance at 0.105, consolidation above which ensures an increase in volatility up to 0.15-25, especially considering the strong signal for a collapse left before the new year. At the moment, the price has traded near the long-term support of 0.055-625, a hike below which is likely only in the case of serious force majeure with a drop in ether by 1500-1750, bitcoin by 75k, or the assignment of the monitoring tag to the token (I expect the next tag changes in early April).
Given the successful opening of the second half of the quarter above the interim support at 0.06 and the time reserve before the possible assignment of the tag, there is a high probability of a repeat attempt to reverse the quarter. It is highly likely that we will see a strong resistance test at 0.075 by the end of the week with a likely breakdown, given the significantly higher final targets. If a new week opens above 0.075, there is a chance of stable support for purchases with breakouts at 0.0925, 0.105 and higher. To date, the token is the most oversold on binance and has the greatest growth potential of up to 100%+ among coins without the monitoring tag. There is also a possibility of adding futures, in which case growth up to 0.25 will not take long. In case of a fall below the 0.0550-625 support, a return to the retest of this resistance up to 0.075 is almost guaranteed, given the current oversold conditions, which makes investments quite reliable.
At the moment, the token is well suited for storing funds in an average amount along with og uft pda vidt.

Resumption of sales on the market before the end of the monthTo date, the market has passed an important boundary in the middle of the quarter, and therefore it is time to make another review of the prospects. Unfortunately, with a good opening of the year, there continues to be a deterrence of purchases in the market and the maintenance of the medium-term correction that has begun. The previous plan worked out according to the least volatile scenario with an increase in purchases only by the middle of the quarter. However, the activity of buyers was not enough even to open the second half of the quarter above 2750. Large investors are selective with investments and are in no hurry. With this picture, the probability of holding sales until the end of this month prevails, but the opening level of the quarter will play a role in the new monthly candle, on the basis of which I expect a good bull run on altcoins for the retest of the opening of the year along with ether aimed at 3250+.
There is no obvious sales signal, so I think the flat will remain quite technical. This week, I expect purchases to remain until the weekly candle closes. In the first days of the new week, it is also likely that purchases will continue based on the inertia of the current week, but from Tuesday to Wednesday, the probability of resuming sales to draw the second bottom on the daily chart around 2600 AETHER and resuming purchases as we approach the new month prevails. The main task of the bulls will be to keep the price above 2500 until the end of the month, which will be enough to turn the quarter around. There is still a possibility of a smooth release of ether above 3000 this month, however, the probability of this at the current opening of the second half of the month is rather weak in my opinion. Significant factors with a sharp drop in the dollar should contribute to this.
With the current picture of coins showing good growth, the probability of a pullback to the second bottom from the nearest resistances prevails. In particular, for alpaca from 0.175-190 or for OG from 4.75-90. Also, the probability of a pullback prevails for combo and slf, which is likely to make it possible to re-borrow more profitably with further higher levels in the medium term.
First of all, in the remaining time until the middle of the new week, I am considering coins that have not yet shown good growth, such as vib uft pda vidt ast with possible breakouts of up to 50%+ in the coming days. I can also show growth impulses for coins with the monitoring tag, which often give growth last on weekends. The most oversold among them are vite troy amb cream.

Stable purchases on OGFollowing the alpaca testing, OG is ready to give a similar picture with an attempt to overtake the previous impulse. The previous impulse has already rechecked the opening level of the year with a local overlap, which opens the way for a test of levels 6 and 7.5. With the current market and the continuing likelihood of a new general drawdown, we are unlikely to see a hike above 6 on the first attempt. On the eve of passing through the middle of the quarter in the next two or three days, there is a high probability of a breakdown attempt of 5 with a stable continuation of the trend until the end of the month. With a more negative market, the volatility of the token may not be sufficient for a breakdown, in which case the probability of smooth growth prevails until the end of the month with a chance to open a new monthly candle above 5.
In the medium term, the token remains a reliable tool for storing funds, as the year opened above the 4.75 support near the key level for volatility growth of 5. Such an opening gives a flat signal for a retest of loyals due to an opening below 5, but also an exit to the 5-7.5 range in the medium term due to an opening above 4.75. Full-time support for a reversal With the current market, it is 3.5, from which there is a probability of a trend up to 7.5+ before the summer. There is a possibility of a test of a lower level of 2.5, but this will happen only in an extremely negative market with a drawdown of bitcoin by 75k or ether by 1500-1750. In this scenario, the token is likely to remain fairly stable and will give a smaller drawdown relative to the rest of the altcoin market, providing an excellent opportunity for topping up.
Along with og, vidt vib PDAs occupy an interesting position, which I primarily consider for storing funds in the mid-range due to the opening of the annual candle above key levels, which gives a signal for its bullish reversal in the future. The main goal for them, similar to alpaca and og, is so far a retest of the opening of the year followed by a rollback.
I am also considering uft wing slf burger ast quick pivx for scalping with a continuing growth potential of up to 30-50%.
Coins with the tag monitoring vite hard cream amb troy with a growth potential of up to 100%+ also retain a high potential for breakouts. Let me remind you that when working with these assets, I recommend keeping a short stop under the price in the first half of the week until noon to insure against delisting, or to hire them from the middle of the week.

UFT are preparing for a trend reversalFollowing the alpaca testing, OG is ready to give a similar picture with an attempt to overtake the previous impulse. The previous impulse has already rechecked the opening level of the year with a local overlap, which opens the way for a test of levels 6 and 7.5. With the current market and the continuing likelihood of a new general drawdown, we are unlikely to see a hike above 6 on the first attempt. On the eve of passing through the middle of the quarter in the next two or three days, there is a high probability of a breakdown attempt of 5 with a stable continuation of the trend until the end of the month. With a more negative market, the volatility of the token may not be sufficient for a breakdown, in which case the probability of smooth growth prevails until the end of the month with a chance to open a new monthly candle above 5.
In the medium term, the token remains a reliable tool for storing funds, as the year opened above the 4.75 support near the key level for volatility growth of 5. Such an opening gives a flat signal for a retest of loyals due to an opening below 5, but also an exit to the 5-7.5 range in the medium term due to an opening above 4.75. Full-time support for a reversal With the current market, it is 3.5, from which there is a probability of a trend up to 7.5+ before the summer. There is a possibility of a test of a lower level of 2.5, but this will happen only in an extremely negative market with a drawdown of bitcoin by 75k or ether by 1500-1750. In this scenario, the token is likely to remain fairly stable and will give a smaller drawdown relative to the rest of the altcoin market, providing an excellent opportunity for topping up.
Along with og, vidt vib PDAs occupy an interesting position, which I primarily consider for storing funds in the mid-range due to the opening of the annual candle above key levels, which gives a signal for its bullish reversal in the future. The main goal for them, similar to alpaca and og, is so far a retest of the opening of the year followed by a rollback.
I am also considering uft wing slf burger ast quick pivx for scalping with a continuing growth potential of up to 30-50%.
Coins with the tag monitoring vite hard cream amb troy with a growth potential of up to 100%+ also retain a high potential for breakouts. Let me remind you that when working with these assets, I recommend keeping a short stop under the price in the first half of the week until noon to insure against delisting, or to hire them from the middle of the week.

Pullback to the second bottom on ALPACAAs we approach the middle of the quarter, there is an increase in purchases of altcoins, in preparation for which I recommended purchases in the second half of last week. To date, I have pleasantly shown the alpaca token, on the example of which I want to consider further scenarios for the development of events.
The token has opened an annual candle above the key level of 0.15, which gives a signal for a hike to the levels 0.25-35-50 . However, the market has been overbought since last year and there is still a possibility of further drawdown of the tops up to 75k and below for bitcoin. In this regard, a reliable scenario for altcoins is so far only a retest of the opening of the year with a further pullback to draw the second bottom, from where we can expect a more confident trend towards a reversal of the annual candle. In particular, for alpaca, the probability of a rollback prevails with an attempt to reverse the month again before closing the monthly candle. If a new monthly candle opens below 0.15 and, moreover, 0.14, growth may linger until the second half of March.
Today, a more interesting position is occupied by og vidt vib PDAs, which I primarily consider for storing funds in the mid-range due to the opening of the annual candle above key levels, which gives a signal for its bullish reversal in the future. The main goal for them, similar to alpaca, so far is a retest of the opening of the year followed by a rollback.
I am also considering uft wing slf burger ast quick pivx for scalping with a continuing growth potential of up to 30-50%.
Coins with the tag monitoring vite hard cream amb troy with a growth potential of up to 100%+ also retain a high potential for breakouts. Let me remind you that when working with these assets, I recommend keeping a short stop under the price in the first half of the week until noon to insure against delisting, or to hire them from the middle of the week.

Preparing for powerful purchases at the turn of the quarterTo date, the market has come to a new opportunity for purchases and another market review. For the bear market, the pullback on the last monthly candle worked well, vib cream og troy performed well with growth impulses up to 30%+. However, as I emphasized, we still have the potential to go to 75k in bitcoin and below, and therefore we continue to catch only pullbacks on large charts against the bear market. I still recommend carefully weighing the top-up for large-cap coins, as such assets may continue to fall until the fall.
In the coming week, we are approaching the key bifurcation point – the middle of the quarter. There is still time before this day for the bears to attack, however, the opening of the month on ether above 3250 is likely to compensate for the attempt of a new loy test in the new week. Due to this picture, there is a fairly high probability of a pullback and an attempt to change the trend today. If the successful extinguishing of sales continues, we can expect an exit to 3100 on ether by the end of the week and in the case of opening a new weekly candle above 3000-3100, continued purchases with the aim of turning the monthly candle into a bullish one. In a more negative scenario, customer activity will remain rather weak with an increase in purchases as we approach the middle of the quarter. In this case, at the beginning of the week, there is a possibility of new sales attempts on the 2600 retest with an increase in purchases from the middle of the week.
Depending on the opening of the second half of the quarter above / below 3250, it will be possible to make a forecast about the further movement of the market.
To date, ether has tested the main medium-term support of 2500, for a fall below which there are no arguments yet when bitcoin is held above 90k, the euro above 1.025 and wti oil above 70. If one of the assets goes below one, there will be a risk of the alt market sinking to an additional 30-40% from current levels. At the moment, the probability of holding these assets above the levels with a gradual reversal of the altcoin market and attempts to turn the quarterly candle into a bullish one for individual coins prevails. That is, in the second half of the quarter, there is a probability of a large bull run with coin impulses up to 100%+.
To date, coins such as vib og alpaca pda vidt have reached the medium-term bottom, which I primarily consider for storing funds in the medium term and additional scalping. In case of market disruptions, drawdowns of no more than 20-25% are likely when tested with ether 2500-2600. The growth potential for these coins is to exceed the opening level of this month with an increase of up to 50% in the short term and a reversal of annual candles in the medium term with an increase of up to 100%+. We also reached powerful supports for uft wing combo slf quick pivx ast, which can slide to 30-35% lower in the event of ether disruptions, but they also look good in the mid-range with a growth potential of up to 70%+ in the event of a bullish reversal of the annual candle in the future.
Coins with the monitoring tag are still the most oversold. Among them, vite stands out, which gave good breakouts at every opportunity. The growth potential remains up to 0.021-25, which can give up to 300% profit. Cream troy amb hard remains in an extremely oversold position with a growth potential of up to 100%+. Troy stands out strongly, which, unlike cream, did not retest the drop level by 0.0031-35, this rebound can bring up to 150%+.
Let me remind you that coins with the monitoring tag are subject to the threat of delisting, which most often occur in the first half of the week, and therefore it is worth keeping short stops at the current price at the beginning of the week or taking assets into operation in the second half of the week.

VIDTUSDT %180 DAILY VOLUME SPIKE! - Potential Downtrend Ahead!VIDTUSDT Analysis Potential Downtrend Ahead
Bad days might be on the horizon for VIDTUSDT. The price is approaching critical levels, and caution is key.
Highlights:
Key Levels: If the price reaches these zones, I’ll shift focus to lower time frames for potential short setups.
Market Structure: I’ll specifically look for downward market structure breaks to confirm the bearish sentiment.
Risk Management: Always prioritize risk management when trading such scenarios.
Key Observations:
"When price enters these levels, I will monitor for lower time frame market structure breaks supported by volume profile and CDV before considering any trades."
Stay sharp, and let’s see how this setup evolves! 📉
Let me tell you, this is something special. These insights, these setups—they’re not just good; they’re game-changers. I've spent years refining my approach, and the results speak for themselves. People are always asking, "How do you spot these opportunities?" It’s simple: experience, clarity, and a focus on high-probability moves.
Want to know how I use heatmaps, cumulative volume delta, and volume footprint techniques to find demand zones with precision? I’m happy to share—just send me a message. No cost, no catch. I believe in helping people make smarter decisions.
Here are some of my recent analyses. Each one highlights key opportunities:
🚀 RENDERUSDT: Strategic Support Zones at the Blue Boxes +%45 Reaction
🎯 PUNDIXUSDT: Huge Opportunity | 250% Volume Spike - %60 Reaction Sniper Entry
🌐 CryptoMarkets TOTAL2: Support Zone
🚀 GMTUSDT: %35 FAST REJECTION FROM THE RED BOX
🎯 ZENUSDT.P: Patience & Profitability | %230 Reaction from the Sniper Entry
🎯 DEXEUSDT %180 Reaction with %9 Stop
🐶 DOGEUSDT.P: Next Move
🎨 RENDERUSDT.P: Opportunity of the Month
💎 ETHUSDT.P: Where to Retrace
🟢 BNBUSDT.P: Potential Surge
📊 BTC Dominance: Reaction Zone
🌊 WAVESUSDT.P: Demand Zone Potential
🟣 UNIUSDT.P: Long-Term Trade
🔵 XRPUSDT.P: Entry Zones
🔗 LINKUSDT.P: Follow The River
📈 BTCUSDT.P: Two Key Demand Zones
🟩 POLUSDT: Bullish Momentum
🌟 PENDLEUSDT.P: Where Opportunity Meets Precision
🔥 BTCUSDT.P: Liquidation of Highly Leveraged Longs
🌊 SOLUSDT.P: SOL's Dip - Your Opportunity
🐸 1000PEPEUSDT.P: Prime Bounce Zone Unlocked
🚀 ETHUSDT.P: Set to Explode - Don't Miss This Game Changer
🤖 IQUSDT: Smart Plan
⚡️ PONDUSDT: A Trade Not Taken Is Better Than a Losing One
💼 STMXUSDT: 2 Buying Areas
🐢 TURBOUSDT: Buy Zones and Buyer Presence
🌍 ICPUSDT.P: Massive Upside Potential | Check the Trade Update For Seeing Results
🟠 IDEXUSDT: Spot Buy Area | %26 Profit if You Trade with MSB
📌 USUALUSDT: Buyers Are Active + %70 Profit in Total
🌟 FORTHUSDT: Sniper Entry +%26 Reaction
🐳 QKCUSDT: Sniper Entry +%57 Reaction
📊 BTC.D: Retest of Key Area Highly Likely
This list? It’s just a small piece of what I’ve been working on. There’s so much more. Go check my profile, see the results for yourself. My goal is simple: provide value and help you win. If you’ve got questions, I’ve got answers. Let’s get to work!

VIDTUSDT: The Tipping Point Every Trader Is Watching - VIDT DAO◳◱ On the BINANCE:VIDTUSDT chart, the Td Sequential pattern suggests a pause in volatility, potentially gearing up for a breakout. Traders might observe resistance around 0.04192 | 0.05218 | 0.06923 and support near 0.02487 | 0.01808 | 0.00103. Entering trades at 0.03207 could be strategic, aiming for the next resistance level.
◰◲ General Information :
▣ Name: VIDT DAO
▣ Rank: 1044
▣ Exchanges: Binance, Kucoin, Mexc
▣ Category / Sector: N/A
▣ Overview: VIDT DAO project overview is currently unavailable. I'll try to update this in the upcoming analysis.
◰◲ Technical Metrics :
▣ Current Price: 0.03207 ₮
▣ 24H Volume: 2,649,650.101 ₮
▣ 24H Change: 0.564%
▣ Weekly Change: N/A%
▣ Monthly Change: N/A%
▣ Quarterly Change: N/A%
◲◰ Pivot Points :
▣ Resistance Level: 0.04192 | 0.05218 | 0.06923
▣ Support Level: 0.02487 | 0.01808 | 0.00103
◱◳ Indicator Recommendations :
▣ Oscillators: NEUTRAL
▣ Moving Averages: STRONG_SELL
◰◲ Summary of Technical Indicators : SELL
◲◰ Sharpe Ratios :
▣ Last 30 Days: N/A
▣ Last 90 Days: N/A
▣ Last Year: N/A
▣ Last 3 Years: 1.77
◲◰ Volatility Analysis :
▣ Last 30 Days: N/A
▣ Last 90 Days: N/A
▣ Last Year: N/A
▣ Last 3 Years: 2.17
◳◰ Market Sentiment :
▣ News Sentiment: N/A
▣ Twitter Sentiment: N/A
▣ Reddit Sentiment: N/A
▣ In-depth BINANCE:VIDTUSDT analysis available at TradingView TA Page
▣ Your thoughts matter! What do you think of this analysis? Share your insights in the comments below. Your like, follow, and support are greatly valued and help sustain high-quality content.
◲ Disclaimer : Disclaimer
The content provided is for informational purposes only and does not constitute financial, investment, or trading advice. Always conduct your own research and consult a qualified professional before making any financial decisions. Use of the information is solely at your own risk.
▣ Explore the Power of Charting with TradingView
Unlock a wide range of financial analysis tools, data, and features to elevate your trading experience. Take a tour and see the possibilities. If you decide to upgrade your plan, you can receive up to $30 back. Discover more here - affiliate link -

VIDT/USDT: Momentum Building for a Breakout
VIDT/USDT is approaching a pivotal moment, hovering near a key trendline resistance. The current structure indicates increasing pressure, suggesting that a decisive move could be on the horizon. The price action and momentum are worth monitoring closely as we await confirmation of the breakout.
Key insights:
- Trendline resistance is being tested, and a successful breakout could pave the way for a significant bullish move.
- Indicators like RSI and MACD hint at strengthening momentum, aligning with the potential for a breakout.
- Volume will play a critical role in validating the move.
Tips for trading this setup:
- Wait for a confirmed breakout with a 4H or daily candle closing above the trendline.
- A retest of the breakout zone as support can offer a safer entry point.
- Monitor trading volume for a noticeable spike, as it often confirms the breakout's strength.
- Manage risks with a stop-loss just below the trendline to minimize potential losses.
Potential targets can be identified based on nearby resistance zones, offering attractive opportunities if the breakout succeeds. This analysis is for educational purposes only—always conduct your own research and trade responsibly. Keep VIDT/USDT on your watchlist for this exciting setup!

vidtusdt - short term trading ideaInitially, I anticipate Litecoin moving towards $0.037 or $0.033, followed by a potential pump above $0.06. There's a possibility it could dip even lower, especially with Bitcoin showing weakness at current levels If Bitcoin drops bellow $80K all hell will break loose. Patience is key—observe the market closely. After breaking above $0.06, we could see a push beyond $0.1. I know Vidt is lagging behind, but I still believe it could be gainer in near future. Vidt usually pumps with delay.
