Undervalued gem to buy now! Bought some $VIDT which is very undervalued coin, uses blockchain technology to protect sensitive data all over the world.
Customers like IBM, AmSpec, Siemens, Krohne, Procentec uses the service of VIDT. Expect it to show some X-ses within this bull cycle
Vidt

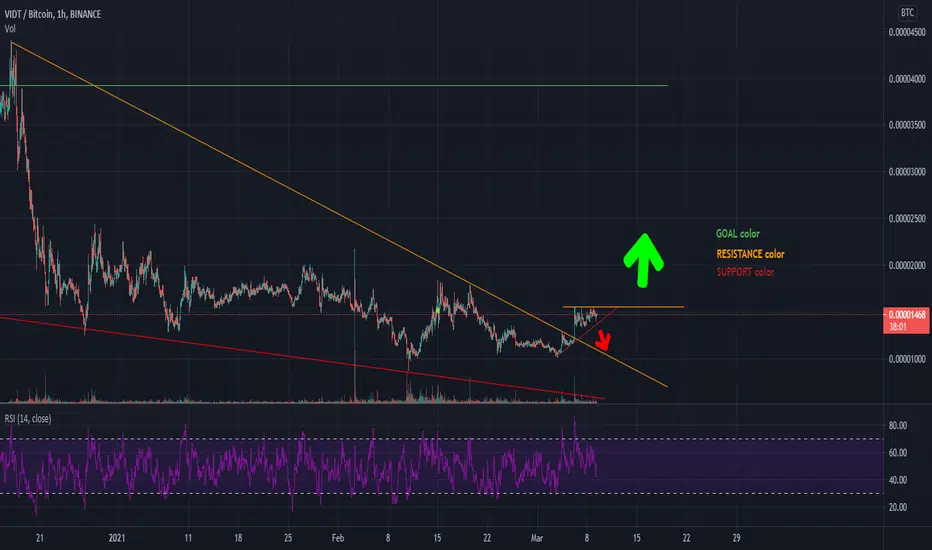
🆓VIDT Datalink/BTC Analysis (24/3) #VIDT $VIDTVIDT has conquered the 2000sts zone and it is ready to move up to 3000sts, 4800sts or even 8000sts in next months
📈BUY
-Buy: 1900-2100sts. SL if B 1700sts
📉SELL
-Sell: 3000-3200sts. SL if A
-Sell: 4700-4900sts. SL if A
-Sell: 7800-8200sts. SL if A
♻️BACK-UP
-Sell: 175-185sts if B. SL if A
-Buy: 135-145sts. SL if B
❓Details
Condition A : "If 1D candle closes ABOVE this zone"
Condition B : "If 1D candle closes BELOW this zone"

VIDT Datalink (VIDT) Chart Analysis (125% Potential Fast)The level that was lost in December for VIDTBTC is opening up again.
This level is sitting around 4400 satoshis with a 125%+ potential for profits.
We have a bullish setup here with prices moving above the blue EMA100 line today.
Just 4 days ago there was a rejection at EMA100 but EMA10/50 worked as support...
Today things are looking way better, it is likely VIDTBTC will go straight up.
The targets are marked on the chart.
Wishing you a great week, highly profitable and successful.
Namaste.

VIDTBTC | Support/Resistance FlipIncoming s/r flip with a final 50% retracement before breakout. Rising volume with an excellent profit target. Do your own research and good-luck.

VIDT/BTC potenial reversal zoneVIDT/BTC
price brokeout from gaint falling wedge
This could be a reversal zone
The best buy will be If the price drop a little or do a retest and show bullish small time frames
then we after that set a nice buy orders
Good luck

VIDT short term predictionBreaking resistance line in this bull trend should be obligatory. Especially for a coin that has been one of the rare ones that slept during all season. Especially for a coin that was acquired by LTO Network and is having a real life value. Will this project that is suffering from erectile disfunction finally stand out?

Time for VIDT is near? This coin with supper great fundamentals, acquired by LTO NETWORK, really did not have a great bull season. We could say it was bull resistant :) But is its time finally upon us. Today LTO had very good day, shall VIDT follow? Goal is not modest, but it is only result I am satisfied with. Great for long term hodl.

VIDT ( VIDT/USD-BUSD) 200% - 250%200% - 250% : After 2 Week - 1.5 Month
+1000% : After 1.5 - 3 Months

VIDT Datalink (VIDT) Bear Is Over | Time For The BullsWe have a nice formation between the 6-14 Feb., we can see a reversal pattern taking place.
We have a Doji at the bottom of the trend.
We have very strong volume coming in.
5 Green consecutive days.
Bullish RSI.
Prices trading above EMA10 and EMA21.
These signals are pointing to the end of the consolidation phase.
A few more days and we should see VIDTBTC print its bullish move.
Thanks for reading.
Namaste.


VIDT IS BULLISHWe have seen down & down since its listed on binance , I think its ready to pop .
buy some & hold for a few weeks.

VIDT/BUSD Binance30' hollow candles
Price breakout at the end of the yellow descending triangle.
VIDT Datalink Price (VIDT) = $0.4945
0.00001043 BTC
0.0002807 ETH
+5.10%
Good Luck
#CryptoHellas

Descending triangle, VIDT still bullish.Given how bullish we all are on VIDT, I think it's safe to say we can expect an upwards breakout from this descending triangle considering we are in a bull market and a lot of other coins are running. If you follow VIDT closely, you may have become aware of recent FUD regarding a potential token merger between LTO and VIDT in the future. It has already been clarified by LTO CEO that a merger will only happen IF IT BENEFITS BOTH VIDT AND LTO HODLERS. No need for worries, VIDT staking soon - 20% monthly token burn, good partnerships and use case, low maximum supply - very bullish on VIDT and we expect this to rocket to the moon very soon.
Volume is good
Still in accumulation zone, good time to buy. Been hovering around in this accumulation zone for 78 days.
Descending triangles can break upwards or downwards; but current bull market sentiment suggests upwards.
Edit: Have to throw this in. No matter what, the burn fundamentals suggest that VIDT has NO CHOICE but to moon in the future :)

AMB forming cup and handle patternAMB prepping up for going to higher levels. I somehow like and dislike this coin at the same time. Communication between community and team is lacking. Supply is increasing. So ... undetermined about how I feel about this coin. Still good shorterm trade.


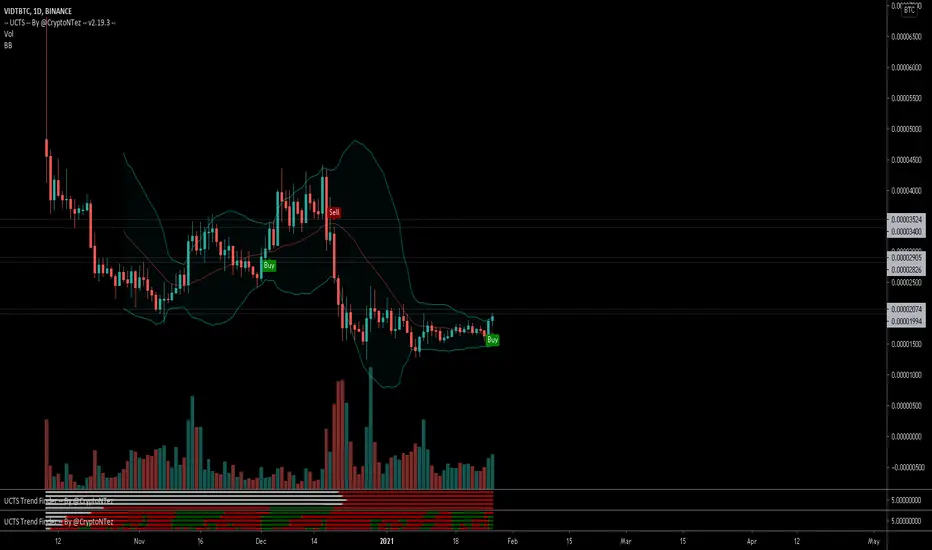
$VIDT, If manages to cross over ~2k sats...$VIDT
If manages to cross over ~2k sats, it may get some momentum to the upside...
UCTS Buy flashing on the daily (closes on 15 min)
#VIDT
VIDT Consolidating With A Bullish BiasVIDTBTC is now in consolidation mode with a bullish bias.
The bullish bias is based on recent higher lows and a bullish RSI.
Also, its price recently closed above EMA10/21.
The consolidation phase can continue for days or weeks before prices move higher.
Above the consolidation box, we go GREEN.
Below it, we go RED... Pretty simple. 😊
Namaste.

Shitcoin Small love potion (SLP) trading opportunity This is probably coin with smallest mc on @binance. In my opinion it's gonna be pumped really hard in near future. Goals are set very modestly :) Remember, this is shit(coin)

Can LTO break this resistance lineLTO is probably the most undervalued coin. Fundamentals are off the charts, Top 10 in tx, real business transactions, real clients. It's almost too good to be true. Partnership/merger with VIDT is only making them stronger. In my opinion real unicorn over here. If it breaks this resistance line, sky is the limit. Let's be patient.

VIDT trading ideaVIDT is probably one of the coins with the best tokeneconomics (tokenomics). Besides LTO is one of the currencies that has best fundamentals in whole cryptocurrency world. For now it's probably going to 0.00002500 btc/coin. if it breaches that level ... This one is also long time hodl coin.


VIDT Datalink 4H Chart - Potential coin to reach to the MOOOON..VIDT Datalink 4H Chart - Potential coin to reach to the MOOOON..
