Visa pointing up soonHistorically when the coppock curve reaches this level the stock gains a an average of 5.11% over the next few weeks. Because Visa has had 4 consecutive days of solid gains, it may drop over the next 1-2 trading days. Buying the dip would be a great options play. The pink zone is the target area for the price to reach. My conservative play is a move to at least 83.70 which has been a frequent area of resistance.
Visa


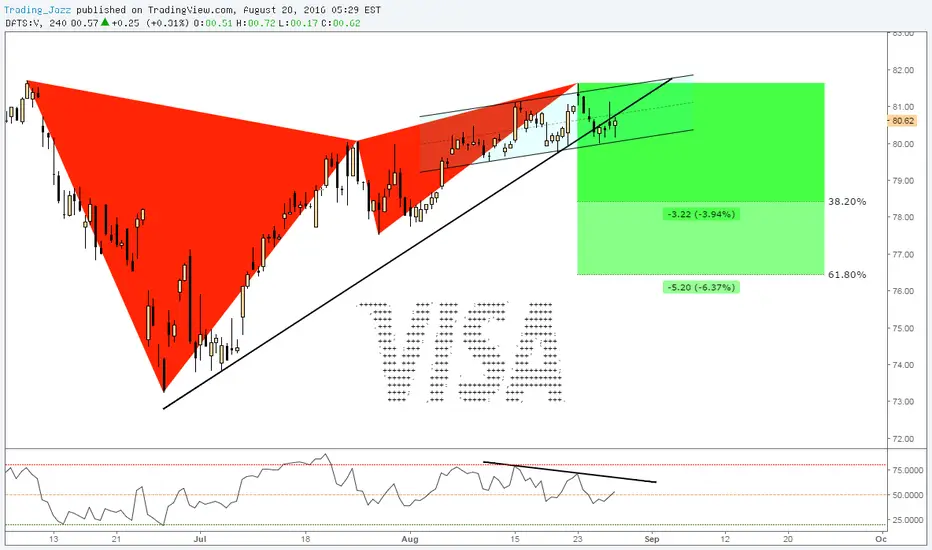
VISA is in critical price level. Bull or Bear will dominant? Visa is trying to make fourth test to break and close above $82 on weekly chart.

VISA,V at critical level (Weekly Uptrend Channel Support) VISA: Critical Support Level. Price unable to make new high after several attempts.
Potential for bullish reversal, but chances to break below channel is there. # However, do not short Visa as it is Strong Fundamental Stock. Overall performance is uptrend since IPO.
Enter for long position if price break above R=82, SL level set below S=75 or below uptrend channel.

Just day-trade the trend. H&S pattern forming the right shoulder.. after that a descent to lower price points.

$V Long and shorts $V seems like it is breaking down, I've marked long levels and potential shorting level/area. I don't think it can go anything below 55.xx, means downside risk is smaller, favouring longs myself.

VISA TO DROP AT LEAST ANOTHER PERCENTHistorically, when RSI reaches its current mark, this stock drops at least another 1%. On average it is actually 4.34% with the minimum drop of 2.64%.
A conservative play is a drop of 1.70% to fall in line with the bottom of the trend channel. Anticipate a 10-30% minimum profit from a solid PUT.

VISAmoney.cnn.com
en.wikipedia.org
visa is a short candidate. It is making a triangle pattern. If you see the red dotted line and the light green dotted line then this triangle formation may continue till next quarter of 2017 latest. But technical indicators are weak anyway. Charles Scharf need to sell his VISA stock and options as soon as possible to avoid any loss.

V: Following AXP's footstepsWe have an interesting signal here, potentially very bullish breakout to come after earnings in V.
You can take the long position following my stop loss reccomendation, or simply size it to risk 0.5-1% based on this stop loss distance. Risk would come at $3.01 per share give or take.
For more setups like this, message me or Tim West, or visit the Key Hidden Levels chatroom.
Good luck!
Ivan Labrie.

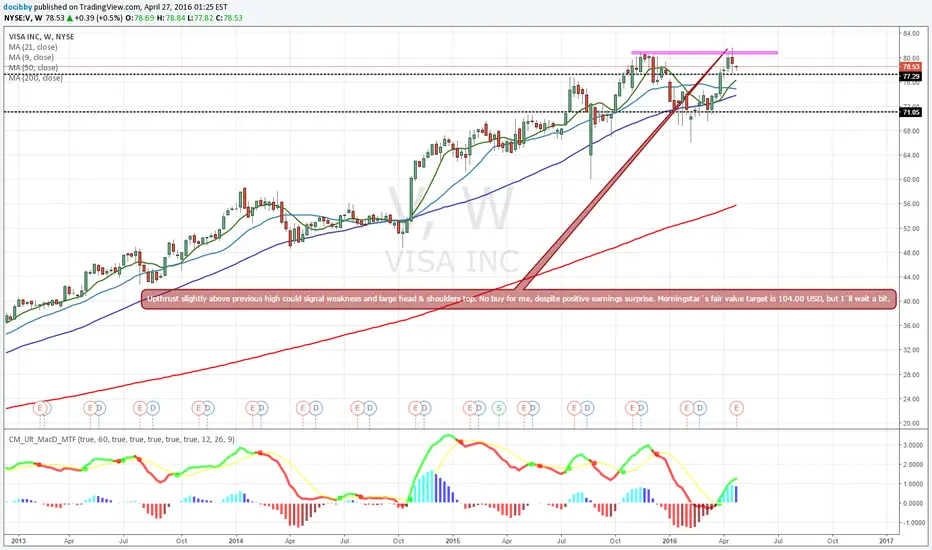
V ( VISA ) - topping formation on weekly or new buying ?VISA had a strong run-up during the bull phase of 2009 - 2015. We will see if this is topping out like the general market, or if buyers take it above recent highs. Patience is best, I`ll keep it on my watchlist.
V $70.16: Rallies towards 5-month rising wedge upper boundsV forms a 5-month rising wedge as shown on the weekly chart while posting new record highs. Further strength would open 72.74 (0.618x 48.80/67.33 from 61.29), near the wedge upper bounds, ahead of 75.07 (0.618x 16.23/58.88 from 48.71). The 66.84 area (near April 6, 2015 weekly range high and rising wedge lower bounds) should support dips. Only a break below the latter would caution for further weakness towards 64.35 (April 13, 2015 weekly low).
Outlook:
Short term: bullish
Long term: bullish

Ready to declineVisa has unfolded in a clear impulse wave since its 2009 low and regardless if we stutter higher the next big move of consequence will be on the downside towards 200.
I am bearish overall and Visa does not seem to be able to close above the upper trendline bolstering my confidence it is rollling over.
How it will reach the previous 4th wave zone ( 230-200 ) will tell us if there's more upside for long term but for now I am bearish and watching the basket carefully.
