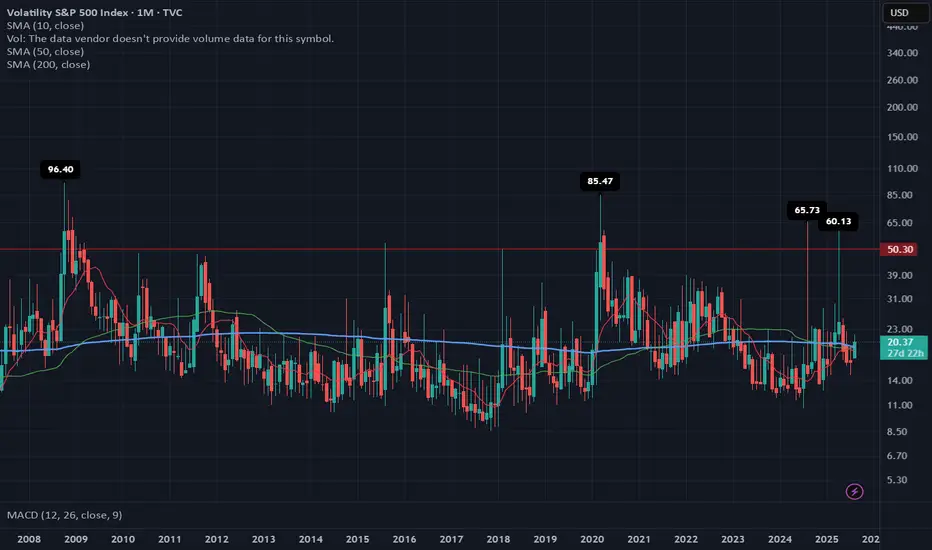
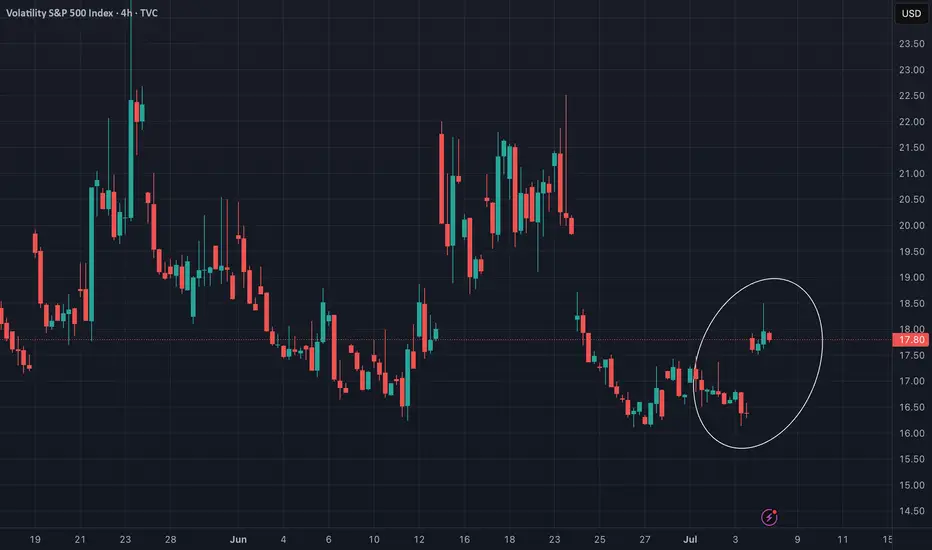
VIX: From “Calm Tension” to a ReboundWhy does a small uptick matter today… if we’ve already seen 60+ readings four times in the past 17 years?
The first week of August 2025 brought back a familiar market force: volatility.
The VIX, which tracks expected fluctuations in the S&P 500, jumped 21% in just a few days, rising from 17.4 to 20.37, with an intraday high of 21.9 on August 1.
At first glance, the move may seem minor. But it broke through key long-term moving averages (SMA 50 and 200) and exited its recent comfort zone (14–19 pts). That alone is enough to make portfolio managers and traders pay attention again.
🔙 Historical context: when the VIX truly spiked
📅 Date 🔺 VIX intraday 🧨 Trigger
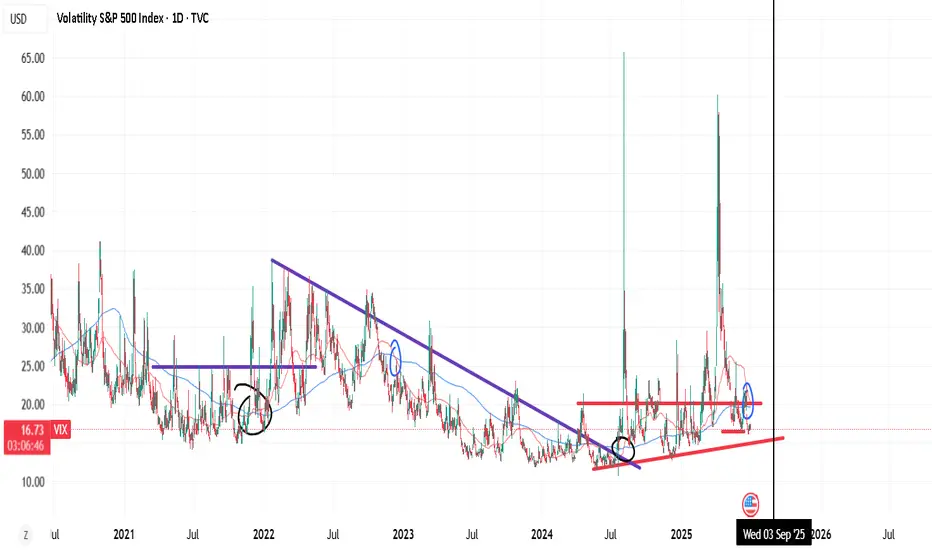
Oct 1, 2008 96.40 Subprime mortgage crisis, Lehman collapse, AIG bailout
Mar 2, 2020 85.47 COVID-19 global spread, border shutdowns
Aug 5, 2024 65.73 Surprise Fed rate hike + overheated jobs data
Apr 7, 2025 60.13 Panic over new U.S. tariffs on global partners
Compared to those moments, today's VIX levels look “mild.” But the technical and macroeconomic signals suggest that volatility may be establishing a new baseline.
1. 📊 Breakdown: First week of August 2025
Weekly increase: from 17.4 → 20.37 (+21%).
Technical breakout: monthly close above both the 50-day and 200-day simple moving averages (SMA 19.25 and 19.45).
MACD on the monthly chart has flipped positive for the first time since March 2023.
Key drivers:
🏛️ The Fed left interest rates unchanged on July 30, but two dissenting votes favored a rate cut.
👷♂️ Softening jobs data: July NFP came in at only +73,000 jobs (vs. +110,000 expected).
🧾 New U.S. tariffs, announced on August 1, reignited inflation concerns.
2. ⚖️ Comparing August 2025 to the August 2024 storm
Factor August 2024 August 2025 (Week 1)
🔺 VIX peak 65.73 21.9
🏛️ Fed stance Surprise 25 bp rate hike Rates unchanged, internal division
👷 Labor market Hot, wage pressures Cooling down
📉 S&P 500 reaction −12% in 3 weeks Approx. −3% decline underway
💧 Market liquidity Very low (pre-market) Normal
Conclusion:
2024 was a systemic shock.
2025 is more of a volatility warning sign—but one that matters for risk management.
3. 📍 Technical signals to monitor
The monthly MACD just turned positive, which historically precedes sustained volatility spikes.
Key short-term range: 18–22 pts. A sustained close above 22 could trigger heavy selling in high-beta stocks.
Options expiration (OPEX, Aug 16) may amplify moves via gamma flows.
4. 🔮 What could move the VIX next?
📅 Date 📌 Event ⚠️ Volatility Risk
Aug 14 Core CPI (July) Reading above 0.3% m/m could reignite hawkish Fed bets
Aug 22–23 Jackson Hole Symposium Powell’s speech could reset the policy outlook
End of Aug Q2 GDP revision Confirm whether slowdown = soft landing or stagflation
📌 Note: The VIX cannot be traded directly. Exposure is typically obtained through futures, options, or ETNs—each with specific risks like contango, low liquidity, and roll decay.
📌 Final thoughts
The VIX doesn’t need to hit 60 to send a message.
The fact that it’s breaking above long-term averages, reacting sharply to macro data, and threatening key levels is enough to suggest that the era of ultra-low volatility may be ending.
History shows us that major VIX spikes come fast and unannounced.
If you remember 2008, 2020, or even April 2025—you know that preparation beats prediction.
VIX CBOE Volatility Index
SPY to continue fallingSPY reached a top (resistance) fork line and started to fall. Based on this I entered long on VIX on July 28, when VIX was at its lowest point. I expect this fall of the market to continue.
VIX will save you! Learn how to trade itHave been trading the VIX for years and it is absolutely gorgeous how well it performs when everything else tanks! Check out monthly spikes, it's trend, and cycles going back over 30 years. For details DM on the ABCs of using leverage without taking on any directly yourself and trading entry / exits with backtesting algorithmic support!
Soon we will get to the 20s and then it's when the fun begins....30s and 40s is very much a real scenario and the economy is doing far worse than people think. Most stocks are trailing below SMA 200 and only a dozen companies are holding the ship afloat. This is not sustainable!
The S&P is highly correlated, most in 5 years, which means that diversification has less impact. VIX has a beta of 0.1! Let that sink in, use it to your advantage before the massive correction happens. Not financial advise, always do your own due diligence, but have beaten the market multiple times over :)

What will go down VIX or SPX?When SPX pushes fresh highs while the VIX floor makes higher lows, fragility rises.
This post is for informational/educational purposes only and is not investment advice or a solicitation to buy/sell any security. Past performance is not indicative of future results. I may hold positions related to the instruments mentioned.
I told you so....VIX is the golden goose! All this fake pump in the market was just not sustainable. It is very clear that there are holes and the money printing can't last forever. The S&P fake pumps, and artificial tariffs (which Americans pay 90%) are created out of thin air. The reality is that defaults are very high across the board for most debt classes, VIX is at a YEAR LOW (doesn't happen to often, signaling massive complacency), and now the song will end and all the retailers will be holding the bag! Learn how to trade the VIX! DM me for details.
Always do your own due diligence, but historically this is a good time to get out :) You need to see and take action when you see red flags....

SPY Imagine the SmellImagine the smell from the Bulls if the $514 gap is filled.
Bearish divergence galore.
Not a matter of if this wedge breaks.
Its when.
Expect Correction august/septemberMarkets MUST correct, everything is overbought and sentiment is Extreme greed. RSI points to extreme overbought territory, VIX very low and not going any lower (reached bottom).
Usually august/september the market corrects. so i expect a correction around 5-8%.
Be prepared, dont chase FOMO. Be careful.
SP:SPX TVC:SPX CBOE:SPX CBOE:XSP AMEX:SPY

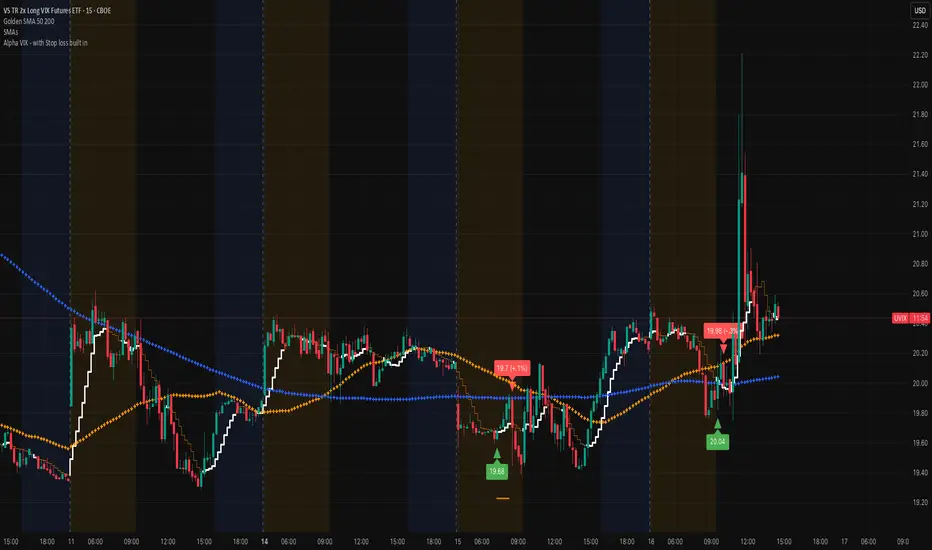
UVIX marching on (VIX proxy)Very nice spike this morning, that's typically a sign that there's more volatility in the works. Remember that we are at record lows on the VIX and that doesn't stay in this region for a long time. Add the Alpha VIX indicator to help you get an entry. The economy is brittle and staying focused on the VIX is a very nice play!
Best of luck and DM if you have any questions.....
$VIX Volatility Extremes, Narratives, Booms & Busts!TVC:VIX volatility index extremes have always been an important factor when assessing the cyclical nature of financial markets.
I demonstrate in this chart what values and narratives to look out for at these extremes. This can help ignore the noise when buying during low social mood / fearful events when everyone else is panic selling, and, selling during exuberance and booms when everyone else is FOMO buying.
This is the cyclical nature and intertwined relationship between media, events and financial markets that traders and Investors want to take advantage of.
Good times create positive social mood, exasperating over leveraging and booms with extreme positive news / silly price targets 'New Golden Age / Paradigm shift' style reporting.
This unwinds aggressively creating negative social mood which the media exasperate with 'fear and doom' reporting.
VIX is a useful tool to hedge against market uncertainty.
Safe trading

VIX Breakout: Forex Traders, Buckle Up for Volatility!🚨 VIX Surge: What Currency Traders Need to Know Right Now 🌪️💱
📊 Chart Context & Technicals:
The recent breakout in the VIX signals a major shift in global risk sentiment! 📈 The index has leapt off its base, showing markets are bracing for uncertainty. For forex traders, this is a flashing signal: volatility in equities often spills over into FX, amplifying moves in major pairs and risk-sensitive crosses. ⚡️
🌍 Geopolitical & Macro Backdrop:
This VIX spike is fueled by President Trump’s aggressive new tariffs on BRICS-aligned nations. 🏛️🔥 These moves have reignited global trade war fears, rattled equity markets, and triggered a broad risk-off wave. Historically, VIX surges = sharp swings in USD, JPY, CHF, and commodity-linked currencies. The USD, usually a safe haven, is now under pressure from both trade uncertainty and looming Fed rate cuts as the U.S. economy slows. 🏦📉
💱 FX Market Implications:
USD: The dollar is caught between safe-haven demand and worries over U.S. growth and deficits. Initial VIX spikes can boost USD, but ongoing trade tensions and dovish Fed signals are weighing it down. 💵⚖️
JPY & CHF: Classic safe-haven currencies! As VIX rises, expect flows into JPY and CHF, especially against high-beta currencies like AUD, NZD, and EM FX. 🗾🇨🇭
EUR, GBP, AUD, CAD: European currencies are outperforming in 2025, thanks to fiscal stimulus and capital inflows. Commodity currencies remain volatile, tracking risk appetite and global growth swings. 💶💷🇦🇺🇨🇦
🛠️ Trading & Strategy Takeaways:
Volatility = Opportunity: Elevated VIX means wider ranges and more frequent breakouts in FX. Prime time for breakout and momentum strategies, but demands tighter risk controls and dynamic position sizing! 🚦
Watch Correlations: Rising VIX typically strengthens JPY and CHF, while risk currencies (AUD, NZD, EM FX) weaken. USD direction is more nuanced—initially bid, but vulnerable to U.S. policy missteps and data misses. 🔄
Event Risk: With Trump’s tariff policy in flux and central banks diverging, expect FX volatility to stay high. Stay nimble around news releases and be ready for headline-driven whipsaws! 📰⚡️
🎯 Pro Takeaway:
The VIX is flashing a clear warning for currency traders: risk sentiment is deteriorating, and volatility is back in force. This environment rewards disciplined, adaptive trading—favoring safe-haven currencies, tactical hedges, and a readiness to pivot as policy headlines evolve. For those trading USD/JPY, EUR/USD, and cross-rates, expect bigger intraday swings and more false breakouts. Use the VIX as your real-time risk barometer and adjust your strategies accordingly! 🧭
VIX break-outs using GC, DC.VIX break-outs using a simplistic, effective approach, probabilities. Market themes or regimes based on markov chains?
keeping it simple.
Can Geopolitics Redefine Market Risk?The Cboe Volatility Index (VIX), which analysts widely dub the "fear gauge," currently commands significant attention in global financial markets. Its recent surge reflects profound uncertainty, particularly from escalating geopolitical tensions in the Middle East. While the VIX quantifies market expectations for future volatility, its current elevation signals more than mere sentiment. It represents a sophisticated repricing of systemic risk, capturing the implied probability of significant market dislocations. Investors find it an indispensable tool for navigating turbulent periods.
The dramatic escalation of the Iran-Israel proxy conflict into a confrontation, involving the United States, directly fuels this heightened volatility. Israeli airstrikes on Iranian military and nuclear facilities on June 13, 2025, prompted swift Iranian retaliation. Subsequently, on June 22, the U.S. launched "Operation Midnight Hammer," conducting precision strikes on key Iranian nuclear sites. Iran's Foreign Minister immediately declared diplomacy over, holding the U.S. responsible for "dangerous consequences" and vowing further "punishment operations," including a potential closure of the Strait of Hormuz.
This direct U.S. military intervention, particularly targeting nuclear facilities with specialized munitions, fundamentally alters the conflict's risk profile. It moves beyond proxy warfare into a confrontation with potentially existential implications for Iran. The explicit threat to close the Strait of Hormuz, a critical global chokepoint for oil supplies, creates immense uncertainty for energy markets and the broader global economy. While historical VIX spikes from geopolitical events often prove transient, the current situation's unique characteristics introduce a higher degree of systemic risk and unpredictability. The Cboe VVIX Index, measuring the VIX's expected volatility, has also risen to the higher end of its range, signaling deep market uncertainty about the future trajectory of risk itself.
The current environment necessitates a shift from static portfolio management to a dynamic, adaptive approach. Investors must re-evaluate portfolio construction, considering long exposure to volatility through VIX instruments as a hedging mechanism, and increasing allocations to traditional safe havens like U.S. Treasuries and gold. The elevated VVIX implies that even the predictability of market volatility is compromised, demanding a multi-layered risk management strategy. This specific confluence of events might signify a departure from historical patterns of short-lived geopolitical market impacts, suggesting geopolitical risk could become a more ingrained and persistent factor in asset pricing. Vigilance and agile strategies are paramount for navigating this unpredictable landscape.

How to use $VIX as a Family Investor?VIX Zones for Family Investors (Fortnightly Review)
1. BTFD Zone (Buy the Fear Dip):
• VIX above 22
• This is a buying opportunity. The higher the VIX, the greater the market fear—take advantage if you have capital available.
2. Cruise Control Zone:
• VIX between 18 and 22
• Do nothing. No buying or selling—just stick to your routine and monitor the market.
3. Profit-Taking Zone:
• VIX below 18
• Consider taking profits from higher-volatility stocks and reallocating to more defensive, large-cap stocks. This helps protect your gains in case of a sudden market drop.

VIX Trade Plan – May 23, 2025⚠️ VIX Trade Plan – May 23, 2025
📊 Instrument: VIX (Volatility Index)
🎯 Strategy: Long Exposure via Direct Shares
📈 Confidence: 70%
📅 Time Horizon: 3–4 Weeks
📌 Technical & Sentiment Snapshot
Price @ Entry: $21.88
Chart Structure:
• M30 / Daily: Bullish – above 10/50/200 EMAs
• Weekly: Mixed, but showing upward bias
• RSI: Neutral to slightly overbought
• MACD: Bullish cross on intraday; flattening on higher timeframes
Volatility Context:
• VIX up +26.9% over 5 days
• Backwardation in VIX futures
• Elevated VIX/VVIX ratio hints at further fear pricing
Headline Risk:
• Geopolitical + macroeconomic uncertainty
• Trade war tensions and surprise policy risk driving implied vol
🔽 TRADE RECOMMENDATION
Parameter Value
🔀 Direction LONG
💵 Entry Price $21.88
🛑 Stop Loss $20.14 (–8%)
🎯 Target Price $25.62 (+17%)
🧮 Size 100 shares
🏦 Risk Level ~1.5% of account
⏰ Entry Timing Market Open
📆 Hold Time 3–4 weeks
🧠 Rationale Behind the Trade
All 5 models agree on a moderately bullish short- to mid-term trend in VIX.
Momentum is supported by:
Rising geopolitical risks
Backwardated futures curve
Technical setups across intraday/daily charts
Entry point near $21.88 gives strong R/R if VIX spikes toward $25–$27 range.
⚠️ Key Risks to Watch
VIX Mean Reversion: VIX tends to drop quickly if risk subsides.
Overbought Intraday: May cause short-term pullbacks even in a bullish context.
Headline Dependency: Any peace deal, central bank surprise, or good news may instantly crush implied vol.
Liquidity Spreads: Use limit orders on open — VIX ETPs (e.g., VXX, UVXY) can see wide bid/ask gaps.
🧾 TRADE_DETAILS (JSON)
json
Copy
Edit
{
"instrument": "VIX",
"direction": "long",
"entry_price": 21.88,
"stop_loss": 20.14,
"take_profit": 25.62,
"size": 100,
"confidence": 0.70,
"entry_timing": "open"
}
💡 If VIX holds above $21.50 with momentum, this setup offers asymmetric upside. Stop placement near $20.14 helps protect against false breakouts or mean reversion traps.

VIX June 2025 Monthly Support & Resistance Lines Valid till EOMOverview:
These purple lines act as Support and resistance lines for VIX for the entire month of June, when the price moves into these lines from the bottom or the top direction. Based on the direction of the price movement, I will take long or short entries in QQQ or SPY.
Trading Timeframes
I usually use 30min candlesticks to swing trade options by holding 2-3 days max. Some can also use 3hr or 4hrs to do 2 weeks max swing trades for massive up or down movements.
I post these 1st week of every month and they are valid till the end of the month.

VIX Call Trade Setup – Volatility Spike or Mean Reversion? (202⚡️ VIX Call Trade Setup – Volatility Spike or Mean Reversion? (2025-06-13)
Ticker: TVC:VIX | Strategy: 🔼 Weekly CALL Option
Bias: Moderately Bullish | Confidence: 65%
Expiration: June 18, 2025 | Entry Timing: Market Open
🔍 Technical & Sentiment Snapshot
• Current Level: ~20.96
• Short-Term Trend: Strong — Price above all EMAs (5m, 30m, Daily)
• Momentum: MACD bullish, 5m RSI >90 (overbought)
• Resistance Zone: $22.00 – $22.56
• Max Pain: $20.00 → potential magnet if reversal kicks in
• Sector Sentiment: S&P downtrend + macro risk keeping VIX supported
• OI Clusters:
– Puts: Heavy at $20.00
– Calls: Building interest at $22.00 and $23.00
🧠 AI Model Summary
✅ Grok + Gemini:
• Bullish bias, expect continued upside
• Favor calls: $22–$23 strikes
• Trade VIX strength on S&P weakness
⚠️ Llama + DeepSeek:
• Mean-reversion view → overbought conditions
• Suggest puts at $20.00 for reversion to max pain
📊 Consensus: Moderately Bullish
→ Ride momentum with tight risk controls
✅ Recommended Trade Plan
🎯 Direction: CALL
📍 Strike: 22.00
📅 Expiry: June 18, 2025 (Weekly)
💵 Entry Price: $0.97
🎯 Profit Target: $1.45 (+50%)
🛑 Stop Loss: $0.73 (–25%)
📏 Size: 1 contract
📈 Confidence: 65%
⏰ Entry Timing: Market Open
⚠️ Risks & Considerations
• RSI >90 → short-term pullback possible
• $22.00 resistance could cap the move
• VIX mean-reverting nature may drag it toward $20.00
• Equity stabilization (e.g. SPY bounce) = bearish for this call trade
• Manage size — weekly VIX options are very volatile
🔥 Volatility trades are fast and furious.
📣 Will VIX explode higher… or revert hard back to $20? Drop your setup below 👇
📲 Follow for daily AI-backed trading plans + option signals.

BVOL (Bitcoin Historical Volatility Index) Weekly TF 2025 Summary:
BVOL (Bitcoin Historical Volatility Index) remains compressed near historic lows. This analysis explores the potential for a volatility expansion cycle, key Fibonacci retracement levels, and how shifts in volatility may precede directional moves in BTC and the broader crypto market.
Chart Context:
Timeframe: Weekly (1W)
Current BVOL: ~13.23
Historical Support Zone: ~11.76–15 (consolidation base since 2022)
Resistance Area: ~25–35 (marked breakout threshold)
Fibonacci Retracement (from peak ~192.79):
23.6% = 56.17 → 2nd TP
38.2% = 89.01 → 3rd TP
48.6% = 99.74 → Intermediate fib zone
61.8% = 123.63 → Cycle expansion cap (potential BTC top region)
100% = 192.79 → All-time spike (rare volatility events)
Key Technical Observations:
Consolidation Floor: Since mid-2022, BVOL has hovered near extreme lows often a prelude to sharp directional moves.
Support-turned-Resistance: Past volatility surges often topped near fib clusters (23.6%, 38.2%, 61.8%). These will likely act as TP zones during volatility spikes.
Expected Path:
Base breakout above 25 → TP1 = 35
Acceleration phase → TP2 = 56–60
High volatility climax → TP3 = 85–89
Volatility Trend Commentary:
Current Phase: Low volatility compression, common in accumulation phases.
Volatility Expansion Signal: A break above the 25–35 band may signal the start of a high-volatility impulse (typically aligned with large BTC directional moves).
Dotted Paths on the chart reflect the two key expansion possibilities:
Straight rally up to TP3 (85)
Mid-stage pullback post-TP2 (bear trap scenario)
Macro Correlation:
BVOL vs BTCUSD: Historically, BVOL lows precede strong BTC trends — both bull and bear cycles.
BVOL vs BTC.D: BVOL surges often shift dominance; either BTC leads during volatility or altcoins rotate post-BTC move.
BVOL vs TOTAL / TOTAL2 / TOTAL3:
Volatility compression in BVOL is directly tied to range-bound TOTAL3.
Total:
Total2:
Total3:
BVOL expansion is often mirrored by strong TOTAL2 & TOTAL rallies.
Confluence seen between BVOL TP zones and critical fib levels in TOTAL charts.
Bias & Strategy Implication:
Volatility Expansion Expected: Current structure is unsustainable; expansion is highly probable in coming weeks/months.
Watch BTC Price Action: If BTC breaks key levels while BVOL rises → Confirmed trend.
Portfolio Strategy: Prepare for volatility-driven liquidation zones. Use BVOL to gauge position sizing and risk.
Notes & Disclaimers:
This analysis is part of the BitonGroup Macro Series.
BVOL is not a directional indicator but a volatility proxy. use in combination with price and dominance metrics.
Always combine volatility forecasts with proper stop-loss and leverage management.

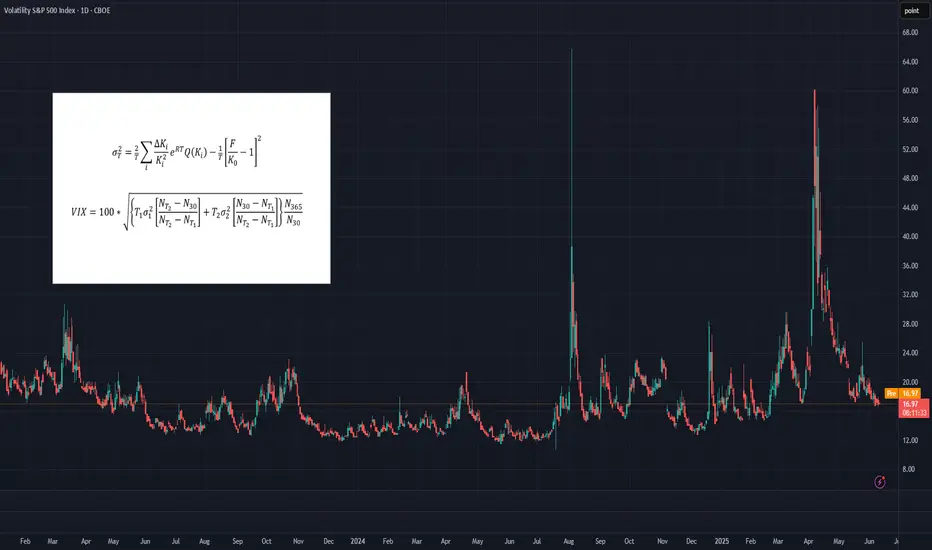
Trading the VIXOften dubbed the "fear index," the VIX gauges SPX options' implied volatility, typically rising during equity market declines and vice versa. It quantifies investor anxiety, demand for hedging, and market stress, crucial for traders and risk managers seeking to measure turbulence.
The VIX calculates a constant 30-day implied volatility using SPX options expiring over the next two months. Unlike simple weighted averages of equity indices, its methodology is more complex, involving implied variance calculation for the two nearest monthly expirations across all strikes. For detailed formulas, refer to the introductory chart or visit the CBOE’s official VIX Index page.
While the VIX Index itself isn’t tradable, exposure can be gained through VIX futures or exchange-traded products (ETPs) like VXX, UVXY, and SVXY. However, these instruments come with their own unique risks, pricing behaviors, and structural nuances, which can make directional VIX trading considerably more complex than it might initially appear.
What You Need to Know About Implied Volatilities
• In calm or uptrending markets, the volatility curve typically slopes upward (contango), indicating higher implied volatility with longer maturities.
• In declining or turbulent markets, the curve can invert, sloping downward (backwardation), as shorter-term implied volatilities rise sharply.
• This pattern can be observed, comparing VIX9D, VIX, and VIX3M against the SPX. In stable markets: VIX9D < VIX < VIX3M. In stressed markets, this relationship may reverse. The VIX9D and VIX3M are the 9-day respectively 3-month equivalent to the 30-day VIX.
What You Need to Know About VIX Futures
• When the volatility spot curve is in contango, the VIX futures curve will also slope upward.
• In backwardation, the futures curve slopes downward, reflecting heightened short-term volatility and short-term volatility spikes.
• While in contango, VIX futures "roll down the curve," meaning that—independent of changes in volatility—futures tend to decline in value over time.
• In backwardation, the opposite occurs: futures "roll up the curve," potentially rising in value over time even without volatility changes.
• VIX futures’ responsiveness to VIX Index movements – the beta of VIX futures against the VIX index - declines with longer expirations; front-month futures may react to 70-80% of VIX changes, compared to 40-60% for third or fourth-month futures.
Key Consequences for Traders
• Directional trading of VIX futures can be strongly influenced by the shape of the futures curve.
• Contango in low-VIX environments creates strong headwinds for long VIX futures positions, caused by the “roll-down-effect”.
• Conversely, backwardation in high-VIX environments creates headwinds for short positions.
• These effects are more pronounced in front-month contracts, making timing (entry and exit) for directional trades critical.
• There's a trade-off in directional strategies: front-month futures offer greater exposure to VIX movements but suffer more from negative roll effects.
How to Trade VIX Futures
• Due to these structural challenges, directional VIX futures trading is difficult and requires precision.
• A more effective approach is to trade changes in the shape of the futures curve using calendar spreads (e.g., long VX1, short VX2). This reduces the impact of roll effects on individual contracts.
• In low-VIX, contango conditions, a rising VIX typically leads to VX1 increasing faster than VX2, widening the VX1–VX2 spread—an opportunity for spread trading.
• While VX1 may initially suffer more from roll-down than VX2, this can reverse as the VIX rises and VX1 begins to “roll up,” especially when VIX > VX1 but VX1 < VX2.
• The opposite dynamic applies in high-VIX, backwardation environments.
• More broadly, changes in the shape of the futures curve across the first 6–8 months can be profitably traded using calendar spreads. Roll-effects and the declining beta-curve can also be efficiently traded.
How to capture the Roll-Down-Effect
One of the more popular VIX-trading strategies involves capturing the roll-down effect,, while the curve is in contango. It is a positive carry strategy that is best applied during calm or uptrending market conditions. Here’s a straightforward set of guidelines to implement the Roll-Down-Carry trade:
• Entry Condition: Initiate during calm market conditions, ideally when VIX9D-index is below VIX-index (though not guaranteed).
• Choosing Futures: Use VX1 and VX2 for calendar spreads if VX1 has more than 8-10 trading days left; otherwise, consider VX2 and VX3.
• Spread Analysis: Short VX1 and long VX2 if VX1–VIX spread is larger than VX2–VX1; otherwise, VX2 and VX3 may be suitable.
• Contango Effect: VX1’s roll-down effect typically outweighs VX2’s during contango.
• Relative Beta: VX1 shows higher reactivity to VIX changes compared to VX2, mimicking a slight short position on VIX.
• Exit Strategy: Use spread values, take-profit (TP), and stop-loss (SL); consider exiting if VIX9D crosses over VIX.
________________________________________
Conclusion
Directional trading of the VIX Index—typically through futures—demands precise timing and a good understanding of the volatility curve. This is because curve dynamics such as contango and backwardation can create significant headwinds or tailwinds, often working against a trader’s position regardless of the VIX’s actual movement. As a result, purely directional trades are not only difficult to time but also structurally disadvantaged in many market environments.
A more strategic and sustainable approach is to trade calendar spreads, which involves taking offsetting positions in VIX futures of different maturities. This method helps neutralize the impact of the curve's overall slope and focuses instead on relative changes between expirations. While it doesn’t eliminate all risk, calendar spread trading significantly reduces the drag from roll effects and still offers numerous opportunities to profit from shifts in market sentiment, volatility expectations, and changes in the shape of the futures curve.
What else can be done with VIX instruments
VIX indices across different maturities (VIX9D, VIX, VIX3M), along with VIX futures, offer valuable insights and potential entry signals for trading SPX or SPX options. In Part 2 of the Trading the VIX series, we’ll explore how to use these tools—along with VIX-based ETPs—for structured trading strategies.
$UVXY target still +$100, different path to get thereWe've seen an incredibly large rally in stocks, which has taken UVXY lower than I expected, but as long as we bounce at support here, the idea is still valid.
The support on the chart is retesting the move that we broke out from end of March. There was a lack of balance on the chart as we saw a 130% move over a 5 day period. So we're going back to retest that region.
I think once we retest the region we broke out from, we'll base for a few days and then start the last leg higher. I think this is going to be the biggest move yet and this move will get us to break the lows in SPY. I'm looking for $437-441 to mark the low in the market with an extreme low at $400.
I think VIX will see new highs and UVXY will go to $100+ with the resistance targets on the chart.
Not sure what the catalyst will end up being for this one, but all of the positive news around tariffs seem to be priced in after today.
Most of my UVXY options are stacked from 6/6-6/20 as I think we'll see this move play out by then.
Let's see what happens.

$VIX target $88-103TVC:VIX looks to be bottoming here and I think the next move higher is going to be the big one I've been waiting for.
We did well last month catching that move into April 7th via UVXY calls. I started buying calls again April 24th for 5/30 - 6/20 and have continued buying as VIX has declined.
Now the chart is finally looking like it's bottoming and I'm getting short signals on a lot of the charts -- therefore my conviction is growing that we're close to a reversal here.
I think this move will be a move that happens once every 10+ years and the gains have the potential to be massive if it happens.
Let's see if it plays out.

VXX LongAfter SPY quick UP, VIX is Low, there might be next SPY move to the downside.
Long entry 51.5
stop 50. buy Option, Max risk is same as stop 50.
Target 65
Risk management is much more important than a good entry point.
I am not a PRO trader.
In my trading plan, the Max Risk of each short term trade should be less than 1% of an account.

Quiet before the storm: $VIX eerily at low levels. TVC:VIX since the unusual April spike to 60 has been making new lows. It is surprisingly coincidental that the S&P 500 bottomed at 4900 @ which is 0.618 Fib retracement level if we chart the Fib level form the August 2024 spike to the lows of the Nov 2024. Since Feb 2025 highs have come down to 17. With VIX at 17 and SP:SPX almost 6000 which is 2.5% away from Feb 2025 ATH. And the disturbing part is that the TVC:VIX is very quietly going lower.
So how does the future look like. VIX can go down to the lows of 16 before it breaks down below the upward sloping. This can result in violent reversal. The reversal can result in that TVC:VIX spikes to levels of 24 and next level 32. TVC:VIX above 32 is always a very good opportunity to buy $SPX. There you have my suggestion for the pair trade.
Verdict : TVC:VIX can spike to 24 or 32 if the reversal trade takes hold. Go long SP:SPX with TVC:VIX @ 32.

Weekly Volatility SnapshotVolatility, expressed through standard deviation, quantifies market elasticity and presents a level of probability and precision that humbles us all.
In my analysis, I track trending volatility to discern historical patterns (HV) and utilize them to anticipate future outcomes (IV). This weighted indicator provides a comprehensive and accurate range for observation.
When trending historical volatility expands or contracts around implied volatility, price action can be interpreted as positively or negatively compounded within the predicted implied range.
I measure this concept using the ‘strength’ of IV and calculate my implied range based on the current market elasticity. This system is adaptable to any IV condition, as it allows for a fair assessment of market movements and potential outcomes.
__________________________________
Last week, volatility increased slightly as bi-weekly trends picked up over monthly values -- the same near term trends with the major indices show strength within 8% of IV into this next week.
One thing to note: NASDAQ:MSFT NASDAQ:NVDA and NASDAQ:TSLA all show near term contraction under stated IV within the magnificent 7 while the rest show shorter term volatility as expansive.
What do you think the CBOE:VIX will do this next week?
___________________________________
For those interested in volatility analysis and the application of my system using weighted HV ranges to IV, I encourage you to BOOST and share this post, leave a comment, or follow me to join me on this journey!
We will weekly analyze our ranges under the VIX and engage in discussions.
