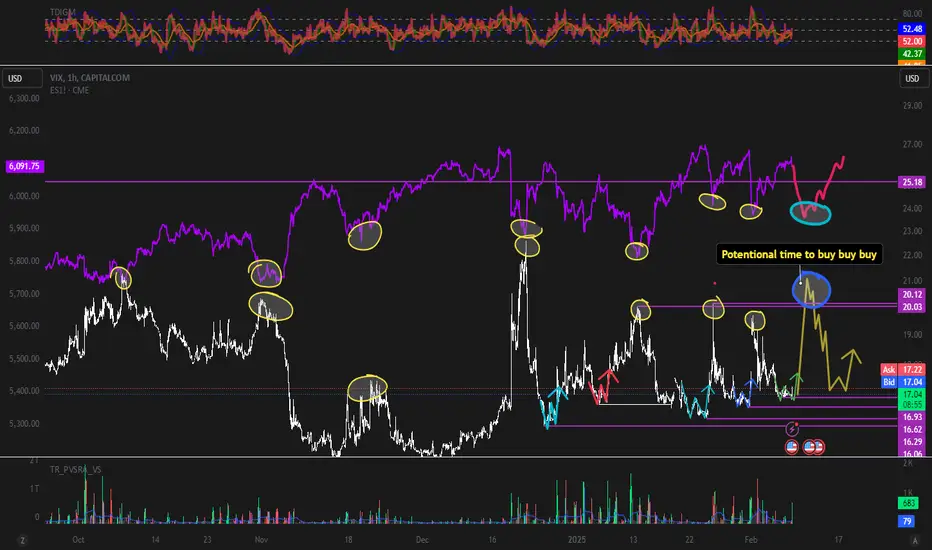
VIX PARABOLIC means MAJOR DROP, we are on that zone now.
After VIX's massive breakout this past few weeks -- rendering the market helpless bringing forth a bleeding season, VIX is bound for a major drop after tapping a strong resistance level.
That parabolic move should warrant a weighty trim down ahead in the next few weeks.
Expect markets across the board, from equities/crypto/fx majors/gold to bounce big from here on.
Ideal opportunity to enter here relative to your preferred asset to trade.
Spotted at 27.85
Interim target 20.0
Mid Target 15.0
VIX CBOE Volatility Index

Nasdaq Bank Index 2025 Edition — Let's Make Sh#t Great Again.President Donald Trump's aggressive tariff policies, we at @PandorraResearch Team characterize as a term "Tariff Bazooka", have significantly destabilized the Nasdaq Bank Index NASDAQ:BANK , reflecting broader financial sector vulnerabilities and investor anxiety.
These tariffs, including a 25% levy on imports from Canada and Mexico, a 20% duty on Chinese goods, and proposed reciprocal tariffs, — have triggered cascading multi effects on banking stocks through several paths.
Market Volatility and Investor Flight
The Nasdaq Bank Index, which tracks major U.S. financial institutions, has been disproportionately impacted by tariff-driven uncertainty:
Sharp Equity Declines. Since Trump announced reciprocal tariffs in February 2025, the Nasdaq Composite NASDAQ:IXIC dropped over 10% from its December 2024 peak, erasing $1 trillion in tech-sector value. Banking stocks, sensitive to macroeconomic shifts, mirrored this downturn as investors fled equities for safer assets.
Risk-Off Sentiment. Bonds rallied as tariffs sparked fears of stagflation—a combination of stagnant growth and rising inflation—prompting a 30-basis-point drop in 10-year Treasury yields. This flight to safety squeezed bank profitability, as narrower yield curves reduce net interest margins.
Economic Contagion Mechanisms
Interest Rate Pressures.
Tariffs have raised input costs for businesses, contributing to inflationary pressures. The Federal Reserve now faces a dilemma: tolerate higher inflation or hike rates to curb it. Either scenario harms banks. Elevated rates could suppress loan demand and increase default risks, while delayed rate cuts prolong financial tightening.
Trade Retaliation and Sectoral Risks.
Canada, Mexico, and China have retaliated with tariffs on $155 billion (Canada) and unspecified billions (China, Mexico) of U.S. goods. For banks, this raises exposure to sectors like agriculture, manufacturing, and automotive - industries heavily reliant on cross-border trade. Loan defaults could surge if protected industries fail to offset higher costs.
Global Financial System Strain.
Trump’s tariffs risk fragmenting the rules-based trading system, undermining the stability that banks depend on for international transactions. The EU and other regions may retaliate by restricting U.S. financial services, directly impacting revenue streams for Wall Street firms.
Sector-Specific Impacts
Tech-Finance Nexus. Many Nasdaq-listed banks have significant exposure to tech firms, which face disrupted supply chains due to tariffs on Chinese components. This dual pressure — higher operational costs for clients and reduced tech-sector valuations — weakens banks’ asset quality.
Consumer Credit Risks. Tariffs on everyday goods (e.g., 25% on Mexican produce, 10% on Canadian energy) could elevate household expenses, straining consumer creditworthiness and increasing delinquency rates for retail banks.
Projected Outcomes
Economists estimate Trump’s tariffs could reduce U.S. GDP growth by 1.5 percentage points in 2025, with a stagflationary shock amplifying equity sell-offs. For the Nasdaq Bank Index, this implies prolonged volatility, compressed earnings, and potential credit rating downgrades as macroeconomic headwinds intensify.
Technical challenge
The main technical graph of Nasdaq Bank Index NASDAQ:BANK indicates on further Bearish trend in development, since major supports (nearly 5-month flat bottom and 52-weeks SMA) have been recently broken.
Conclusion
In conclusion, Trump’s tariff strategy has acted as a destabilizing force for financial markets, with the Nasdaq Bank Index serving as a barometer for sector-wide risks. By exacerbating economic uncertainty, inflation, and trade fragmentation, these policies have eroded investor confidence and heightened systemic vulnerabilities in the banking sector.
--
Best 'sh#t hits the fan' wishes,
@PandorraResearch Team 😎

VIX againUVXY is landing in a short term trendline. SPY is heading to a resistance zone. I bought the ETF (no calls this time) I'll keep buying if it gets to the support at 18.30. I think the market is consolidating and we will have ups and downs like crazy. I'll take advantage of it. My first TP at 22, then will see.

Chop Chop - VIX and DXY tell the tale An elevated VIX along with a declining DXY signals a choppy market and a great deal of uncertainty.

Greatest Volatility of all times is approaching...#vix the volatility index has been accumulating since covid 2020 crash. In higher time frame, TVC:VIX has broken out in 5th August 2024 and it was just a test!.. Then continued consolidation till this time , also doing the retest. at this zone, accumulation of the 2020 covid crash for a new impulsive wave!..
In lower time frame , several days ago VIX broke out the accumulation zone coming from 5th August and this warns you about your greedy positions my friends. We haven' t seen a real great volatility since covid crash and VIX chart is getting alarming. You' ve been warned. Not financial advice.
Temporary INVALIDATION: If VIX dumps below 13 zone , this will be more secure. Below 10 is the main invalidation.

VIX/USDT.D - Is crypto the next volatility? I like to follow unusual ratios.
I also regularly follow those that make sense for at least a few years.
VIX/USDT.D is one of them.
What I see when I examine the chart actually makes me think that no matter how positive I try to think, there is a high probability of a southward price movement for crypto assets.
I predict that we will see more volatility in crypto assets than in the classical markets in the coming period and that this will be bearish for crypto assets.
Good luck to everyone.

S&P500 Index Goes 'Draconian', ahead of Roller Coaster ExplosionThe S&P 500's "roller coaster" behavior stems from its sensitivity to various economic, geopolitical, and market-specific factors that influence investor sentiment and corporate performance.
Economic Factors: Changes in interest rates, inflation, and Federal Reserve policies significantly impact the index. For example, rising interest rates can reduce corporate earnings and valuations, leading to market sell-offs. Conversely, expectations of rate cuts can boost optimism and drive rallies.
Investor Sentiment and Volatility: The S&P 500 is closely tied to the CBOE Volatility Index (VIX), often called the "fear gauge." The VIX rises during market downturns as investors seek portfolio protection, amplifying price swings. This inverse correlation highlights how fear or optimism can drive sharp movements in the index.
Global Events: Geopolitical tensions, natural disasters, or pandemics can disrupt markets by creating uncertainty about future economic performance. Such events often lead to sudden spikes or drops in the S&P 500 as investors react to perceived risks.
Valuation Cycles: Overvaluation or bubbles in specific sectors can lead to corrections. For instance, high price-to-earnings ratios combined with slower economic growth can result in prolonged periods of stagnation or volatility.
These factors collectively create the "roller coaster" effect begun in the S&P 500.
// Life is like a roller coaster, as you don't know what's going to be thrown at you next, so all you can do is give us your best shot.
--
Best wishes,
@PandorraResearch Team 😎

VIX going higher: Sector Rotation UnderwayTVC:VIX is the tool I use for market timing. It tells us a lot. When it spikes to a Resistance (often 50% of the last major high) that tends to be a market bottom. But when you see what it is doing the last few weeks: Closing sustainably higher each bar... you know the market is pricing in more volatility.
VIX is known as the "fear index" and you can extrapolate that out to see that fear is increasing. The VIX is also the most forward looking indicator I have found for the stock market. All signs point to more broad market downside.
Another thing going on in context is a clear Sector Rotation. I noticed this last week but today's look at the Sector ETFs make it more clear. Not everything is down; AMEX:XLP and AMEX:XLU are up even as AMEX:SPY makes new lows. What this tells me is that investors are fleeing into "quality" stocks with low volatility and that pay dividends.
I'm currently sitting in cash, waiting for opportunities, and hedged some of my long term tax advantage accounts in AMEX:SH

Trump Pump. Trump Dump. Trading Family,
We had our Trump pump. Now, we are seeing a Trump dump. Tariffs and other geopolitical events are causing market uncertainty. Let's take a look at our charts to find out how much more pain we are in for. And, a positive sign. Smaller cap altcoins and many memecoins appear to be holding strong!
✌️ Stew

VIX daily - opex weekend at 28th FebWe are heading into an OPEX this 28th of Feb.
Volatility is running and seems like fear is all over.
Crypto is crashing and people are talking about fear and losing everything....
Well, the big whales are buying the dip and Eric Trump just tweeted about buying the dips.
For having a bottom process, it is essential to see the TVC:VIX hit that 23-25 area while its #RSI should be around 70 on the Daily chart.
In that way, we are more likely to have the bottom area and see the market turn and hard.
The US10Y is now at 4.3% which is going down and pushes the NASDAQ:TLT to higher prices.
I lean to the local bottom around 580-585 in the AMEX:SPY with a nice capitulation move that seems to be coming exactly with the OPEX and with liquidity issues in the entire market and in crypto.
I am looking to buy the dip and keep adding to my long positions in crypto.
CRYPTOCAP:AVAX CRYPTOCAP:ETH CRYPTOCAP:BTC $PAAL $DSYNC $AINTI AMEX:NHC LSE:ALU MYX:ASTRA $XBG and much more.

VIX MODEL Gave a BUY SPY today The chart is the 4 hr and daily VIX model I have Buy signal in the SPY as a result of it . BUT SOON we will move from it being a BUY to just a very bearish signal this is coming rather soon . BUT NOT YET , Best of trades WAVETIMER

Market Open: VXX Pops...This morning, the VIX popped to $19.26, not seeing levels like this since the Jan. 27th, 2025 jump to $19.93, where the SPY saw an almost 3% drop, NASDAQ dropped 5%.
We saw concerns of heightened market uncertainty, with investors weighing robust consumer spending against mixed economic signals. There were murmurs that the subdued durable goods orders and emerging signs of slowing GDP growth might signal that the current momentum is hard to sustain. Additionally, dovish cues from the Fed—which hint at a more cautious approach to rate hikes—raised questions about whether these measures could ultimately mask underlying inflationary pressures and economic challenges.
On the corporate front, the market was further rattled by underwhelming earnings reports from several key technology players, a sector that had previously driven much of the market’s optimism. This divergence in performance—where defensive sectors such as consumer staples and financials held their ground while growth stocks stumbled—added to the overall anxiety.
Finally, the backdrop of ongoing geopolitical tensions and sporadic trade disputes continued to contribute to a risk-off sentiment, ensuring that market volatility remains elevated.
Follow us for more Financial & Investment News at @MyMIWallet

Prepere yourself for buying opportunities ... So there we are ... CPI little bit higher than exceptating , powel clearly talks about monetary policy and Trump goin wild with tarrifs ... what to except in this macro&political economic driven environment ? I don't think it will grow to extreme values now. Rather, there will be some more carving and from a short-term perspective an opportunity to buy at a good price ... Well, it is very important, at least for me in this environment of a trade war combined with a period when historically the Fed has raised rates and not lowered them as many expect. It is important to take profits and hold losses short and uncompromisingly exit losing positions. The year 2025 will be full of opportunities, which goes hand in hand with pain. What is heaven for one guy is hell for another guy. I am a fan of everyone who tries to make money in this environment and I hope to rob you of your money. Because that is what the market is about. Good luck and enjoy your game

[02/03] SPX Weekly GEX OutlookSPX shifted into a strong sideways trend after recent market whipsaws, but premarket today saw a sharp sell-off.
Now, let’s break down the GEX levels set for Friday’s weekly expiration (first weekly expiry). These are already reflected in today’s GEX data—check them on your indicator!
COMMENT: This week, we’ve started updating our seamless GEX & options indicators before the market opens . This has been a long-standing request from users—especially 0DTE traders, who will likely benefit the most.
Key GEX Levels for SPX
📍 Highest Positive Call Wall (Call Resistance): 6075
Acted as resistance last Friday, as it often does initially.
📍 Sideways Zone: 6000-6070 (Transition Zone with GAMMA flip)
Wide Transition Zone → Expect high volatility or slow drifting within this range.
Easy flow between positive and negative GEX profiles, meaning potential sharp moves in either direction.
📍 Put Support (Sum 4DTE): 5900
Very deep support—market is clearly pricing in fear of a potential future drop.
📌Below 6000, there are only negative NetGEX strikes down to 5900, which signals a lack of strong support until that level.
What This Means for the Week
📊 SPX opened (gapped down) in negative GEX territory—if buyers don’t reclaim this zone, we are in for a highly volatile week, potentially with a spiking VIX.
🚫 No reason for bullish optimism unless we break above 6070—until then, expect uncertainty and potential downside pressure.
PS: FINAL GEX ZONE COLORING SHEET

VOLATILITY is loading...#vix the volatility index is gaining momentum for another strike to markets. Take care on your risky positions and assets like #stocks and #crypto

VIX & SXP There is some W on actual lows in VIX , so if it will play out ...It will be next higher low on VIX. It could lead in to higher high. Time will show how markets react on today employment data .I think it was little bit pro inflation with can lead in to stronger DXY situation ...
Golden Pocket March Rally? Downside Gap Fill by 2/28? $SPYA break of the current High would invite a straight shot to the 1.61 Golden Pocket Above. Anything Below leaves room for Election Rally Gap Fill. Keep an eye on the fib. Don't try to be a HERO inside of the box. Wedge forming. March may lead to a large decline. Be wary.

THE SKEWED GAMES. UNDERSTANDING CBOE SKEW INDEX (SKEW)The CBOE Skew Index (SKEW, or "BLACK SWAN" Index) is a financial metric developed by the Chicago Board Options Exchange (CBOE) to measure the perceived tail risk in the S&P 500 over a 30-day horizon.
Tail risk refers to the probability of extreme market movements, such as significant declines or "black swan" events, which are rare but have severe consequences.
Here's a detailed explanation of its role and implications in financial markets:
Key Features of the CBOE:SKEW Index
Measurement of Tail Risk. The SKEW Index quantifies the likelihood of returns that deviate two or more standard deviations from the mean. It focuses on outlier events, unlike the VIX (Volatility Index), which measures implied volatility around at-the-money (ATM) options.
Implied Volatility Skew. The index is derived from the pricing of out-of-the-money (OTM) S&P 500 options. It reflects the market's demand for protection against downside risks, which leads to higher implied volatility for OTM puts compared to calls.
Range and Interpretation
The SKEW Index typically ranges from 100 to 150.
A value near 100 suggests a normal distribution of returns with low perceived tail risk.
Higher values (e.g., above 130) indicate increased concern about potential extreme negative events, with heightened demand for protective options.
How It Works
The SKEW Index is calculated using a portfolio of OTM options on the S&P 500. The methodology involves measuring the slope of implied volatility across different strike prices, capturing how much more expensive OTM puts are relative to calls. This steepness reflects market participants' expectations of asymmetric risks, particularly on the downside.
To make a picture clear, we just simply use 125-Day SMA of SKEW Index. Since multi year high has occurred, market turbulence come as usual.
Practical Implications
Market Sentiment.
A rising SKEW Index signals growing fear of extreme downside risks. For example, during periods of economic uncertainty or geopolitical tensions, investors may hedge portfolios more aggressively, driving up the index.
Conversely, lower readings suggest calm market conditions with balanced expectations for future returns.
Portfolio Management
Investors use the SKEW Index as a barometer for hedging costs. High SKEW levels indicate that protecting against tail risks has become more expensive (and probably active).
It also helps traders assess whether market pricing aligns with their own risk expectations.
Historical Context
Historically, spikes in the SKEW Index have preceded major market downturns or volatility events, such as the "Flash Crash" in 2010, Bear market in early 2000s (dot com collapse), WFC in 2007-09, market falls in late 2018 and in 2022.
Complement to VIX
While both indices measure risk, they address different aspects: VIX captures overall market volatility, while SKEW focuses on asymmetry and extreme event probabilities.
Limitations
In summary, the CBOE Skew Index provides valuable insights into market participants' perception of tail risks and their willingness to pay for protection against extreme events. It complements other volatility measures like the VIX and serves as a critical tool for risk management and market analysis.

Traded UVIX This Morning, Just After Open. Position Closed NowIs CBOE:UVIX right for you? Would you also like to earn when the market is down? If so check it out, I traded $UIVX right after the open and have already closed the position. I usually don't day trade, but on a down day like today I couldn't resist trying the downside with Ultra Short Futures Options. These instruments aren't for everyone, & most people who own them lose money over time, so please be careful and only risk as much as you can afford to lose.

VIX indicates trouble aheadDisclaimer: This idea is not intended as investment advice and should not be interpreted as an offer to sell or a recommendation to purchase any asset. Any decisions made based on the information presented in this idea are the sole responsibility of the individual. All investment decisions should be made independently, taking into account your financial situation and objectives.

VIX ready to explode higherLook at the last 2 Monthly candles. They are bullish candles and short term volatility would explode higher in Feb 2025.
All the best.
Marketpanda
Disclaimer: The information provided is for general informational and educational purposes only, and does not constitute financial, investment, or legal advice. None of the content shared should be relied upon as the sole basis for making investment decisions. Prior to making any financial or investment decisions, it is strongly recommended that you consult with a qualified financial advisor, accountant, or other professional who is familiar with your individual circumstances and risk tolerance. Any reliance you place on the information presented is strictly at your own risk, and we are not responsible for any losses, damages, or liabilities resulting from your investment or trading activities.

VIX Will GO DOWN|SHORT|
✅VIX is trading in a local
Downtrend and we are now
Seeing a bearish breakout
Of the rising support line
So we will be expecting a
Further bearish move down
SHORT🔥
✅Like and subscribe to never miss a new idea!✅

VIX putsUVXY is hitting an important resistance level. It is usually rejected from that level. I bought some puts Jan 31, strike 22.
