VIX Breakout: Forex Traders, Buckle Up for Volatility!🚨 VIX Surge: What Currency Traders Need to Know Right Now 🌪️💱
📊 Chart Context & Technicals:
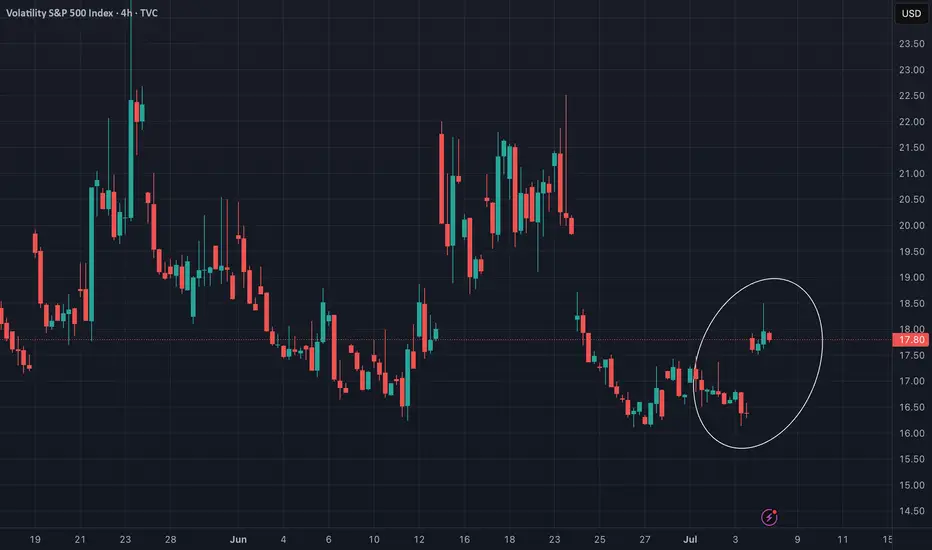
The recent breakout in the VIX signals a major shift in global risk sentiment! 📈 The index has leapt off its base, showing markets are bracing for uncertainty. For forex traders, this is a flashing signal: volatility in equities often spills over into FX, amplifying moves in major pairs and risk-sensitive crosses. ⚡️
🌍 Geopolitical & Macro Backdrop:
This VIX spike is fueled by President Trump’s aggressive new tariffs on BRICS-aligned nations. 🏛️🔥 These moves have reignited global trade war fears, rattled equity markets, and triggered a broad risk-off wave. Historically, VIX surges = sharp swings in USD, JPY, CHF, and commodity-linked currencies. The USD, usually a safe haven, is now under pressure from both trade uncertainty and looming Fed rate cuts as the U.S. economy slows. 🏦📉
💱 FX Market Implications:
USD: The dollar is caught between safe-haven demand and worries over U.S. growth and deficits. Initial VIX spikes can boost USD, but ongoing trade tensions and dovish Fed signals are weighing it down. 💵⚖️
JPY & CHF: Classic safe-haven currencies! As VIX rises, expect flows into JPY and CHF, especially against high-beta currencies like AUD, NZD, and EM FX. 🗾🇨🇭
EUR, GBP, AUD, CAD: European currencies are outperforming in 2025, thanks to fiscal stimulus and capital inflows. Commodity currencies remain volatile, tracking risk appetite and global growth swings. 💶💷🇦🇺🇨🇦
🛠️ Trading & Strategy Takeaways:
Volatility = Opportunity: Elevated VIX means wider ranges and more frequent breakouts in FX. Prime time for breakout and momentum strategies, but demands tighter risk controls and dynamic position sizing! 🚦
Watch Correlations: Rising VIX typically strengthens JPY and CHF, while risk currencies (AUD, NZD, EM FX) weaken. USD direction is more nuanced—initially bid, but vulnerable to U.S. policy missteps and data misses. 🔄
Event Risk: With Trump’s tariff policy in flux and central banks diverging, expect FX volatility to stay high. Stay nimble around news releases and be ready for headline-driven whipsaws! 📰⚡️
🎯 Pro Takeaway:
The VIX is flashing a clear warning for currency traders: risk sentiment is deteriorating, and volatility is back in force. This environment rewards disciplined, adaptive trading—favoring safe-haven currencies, tactical hedges, and a readiness to pivot as policy headlines evolve. For those trading USD/JPY, EUR/USD, and cross-rates, expect bigger intraday swings and more false breakouts. Use the VIX as your real-time risk barometer and adjust your strategies accordingly! 🧭
Vixforecast
Market Open: VXX Pops...This morning, the VIX popped to $19.26, not seeing levels like this since the Jan. 27th, 2025 jump to $19.93, where the SPY saw an almost 3% drop, NASDAQ dropped 5%.
We saw concerns of heightened market uncertainty, with investors weighing robust consumer spending against mixed economic signals. There were murmurs that the subdued durable goods orders and emerging signs of slowing GDP growth might signal that the current momentum is hard to sustain. Additionally, dovish cues from the Fed—which hint at a more cautious approach to rate hikes—raised questions about whether these measures could ultimately mask underlying inflationary pressures and economic challenges.
On the corporate front, the market was further rattled by underwhelming earnings reports from several key technology players, a sector that had previously driven much of the market’s optimism. This divergence in performance—where defensive sectors such as consumer staples and financials held their ground while growth stocks stumbled—added to the overall anxiety.
Finally, the backdrop of ongoing geopolitical tensions and sporadic trade disputes continued to contribute to a risk-off sentiment, ensuring that market volatility remains elevated.
Follow us for more Financial & Investment News at @MyMIWallet

$VIX: THE FED FUD'STERS ARE AT IT AGAIN! THE FED FUD'STERS ARE AT IT AGAIN! 🛑
All I have to say is the TVC:VIX is forming a beautiful Bear Flag right now! Look what's happened in the past!
Bear flags form then break to the downside and we plummet. Stay patient friends!
Not financial advice

VIX Aug 12 2024VIX call inflows were huge today! Support held.
There is also a bullish reversal doji candle on the close.
Watch for the strong reversal to come next

VIX Apr 17th updateVIX is holding its resistance; expect a dive down to the 15.50-16.50 level
Maj resistance box is holding well and the price is in topping formation

VIXPair : Volatility S & P 500 Index
Description :
Consolidation Phase in Long Time Frame
Completed Impulsive Waves " 123 " Impulsive Waves
Break of Structure
Symmetrical Triangle as an Corrective Pattern in Short Time Frame with the Breakout of the Lower Trend Line and Retracement

Volatility S & P 500 Index Next MovePair : Volatility S & P 500 Index
Description :
Completed " 123 " Impulsive Wave
C & H
Bullish Channel in Short Time Frame as an Correction
Fibonacci Level - 78.60% / 100%
Demand Zone

VIX is self-explanatory viewIts just a matter of time, and that time is coming up very soon!
We have very successfully shorted Fri close and covered in pre-market today!

VIX💥1D -TIMEFRAME ANALYSISVIX💥1D -TIMEFRAME ANALYSIS
💗Hello ladies and gentlemen
This is my new idea for 💥VOLATILITY S&P 500 INDEX
I hope my idea is clear
Support me by like and share thank you
Stay Safe💯💲💲💲
Good luck💰😍

Will history repeat again?Look at the VIX chart here; we are again in the VIX 18th zone. In 2022 it was an excellent indicator to spot the bottom; it works during the bear markets only!
So if we are still in a bear market, it should bounce from the 18 level hard and Indexes to fall. If we are entering a bull market, this setup can fail right here.
I doubt it will fail until we see Q1 lows in markets. I might be wrong, and this setup can fail in a grand style.
The VIX bottoms have an excellent correlation with SPX highs (at the bottom orange colour); look for the yellow marked pointers for the 2022 patterns from VIX 18 level. I think we will repeat the same pattern again.

VIX is reapeating the patternA rule of 2 gives a perfect VIX long setup into Q1 on 2023 rally.
The markets are not over with the downside and VIX didn't get even one bottoming signal in 2022. It was intermediate bottoms, but no panic
Im going to add more VIX calls, Apr expiration this coming week.
Its in consolidation mode and should end soon with the breakout

VIX is coiling, almost ready for its primetimeVIX is in triangle and needs above 24.9 to confirm the new bullish explosive move.
I do believe this will do 3x or so before the market makes its final capitulation low

VIX is getting close to its support level, againAs mentioned before, I dont expect VIX to move till mid Jan, than i expect it to explode!
Im still long with 35 Apr calls and will be adding those to max size mid Jan as I expect the price to 3x from around here

VIX BULL$VIX is creating a Bullish 1-2-3 Pattern at its previous market structure bottom (Support marked by the grey box). Price is currently consolidating at support and what historic price action tells us is that price usually has a period of consolidation known as a pullback or "Retracement" before it continues in its overall direction. I have price returning to an older higher-low Level @25.50 and beyond.

VIX closed above the maj bull trendline!Its a very important close for the VIX, all in one day!
VIX closed at HOD and the markets closed above HOD!
Tomorrow's expected move 3.7% on average
- If CPI comes at 7.8% it will be 5% down day
- If CPI comes at 6.9% then it should go up 6-7%
My bet is we go lower or the vice versa from Oct 13th, where it gap down and then bid all day. So if second scenario then we should gap up in markets tomorrow and sell all day!

VIX as a reminderWhen this baby starts moving, it will be too late to enter!
Im accumulating Apr 35 calls

Is Volatility the New Normal? Hi I'm Goose and I'm apparently obsessed with the VIX this week. I would say I've reached a point of borderline stalker, going through historical data, working up average all time range theories, and ultimately writing a script that will give me a bar count inside and outside of a date and price range and the percentage of time during that period that the VIX has gone wild. I used this script compare these statistics across the daily chart in different sections of time. Now, I did this because I am anticipating a return to mean with the VIX any moment now. I'm tapping my fingers and getting impatient. And not because I'm waiting for a rally, I mean, a rally would be cool, but because this has gone on long enough really.
So I decided to compare the 2008 Crash historical data with the more recent Covid data. If you haven't read the in's and out's, the timeline and the reasons why, go do that right now. Or just watch The Big Short a couple of times for the cliff notes. But for the sake of this chart, I marked up some of the important moments during what is now known as the Housing Crisis/Great Recession. Theoretically I could have made arguments to drag this period out to 2014, but comparably it makes little sense and frankly, even further drives my theory, so I ended the period when the market had recovered its 50% losses from pre crash peaks. Keep in mind, current markets recovered and S&P Futures made a new high in just under 6 months from the Covid Crash. So this is already an unfair comparison. And that is kind of my point. Comparable factors like unemployment and U.S. Homeownership are actually contradictory for the most part if you omit the summer of 2020. And if you're in the group, as I am, that believes low unemployment numbers promote higher inflation numbers, then we could argue inflation begun, albeit transitory, in May and July of 2018 when unemployment dropped below 4% and really got a foothold in 2019. All it needed was a supply chain interruption. And I know Covid takes the blame for that, but that had started also. China trade, pine beetles, metal shortages, coffee , etc... So when Covid whooped the employment numbers 10 points from March at 4.4%, to April at 14.7%, it basically created a sling shot effect with equities. Come August of 2020 when those numbers rapidly dropped to 8.4% we made brand new highs. And within a year we had dropped back to where we started in the upper 4% range. I know I'm on a tangent, but why is this important? Because in the Covid Market, we turned those numbers around in 1 year, as opposed to the 5 years it took to recover AFTER the end of the Recession and its 5 year recovery. Soooo... That's why I'm not counting that period, and why I'm calling out VIX on is behavior.
So lets get to my point. Is the new normal volatile AF ? As it currently stands, and based on a range of $10-$20 dollars which I determined to be fair visually for the initial part of this work up, the VIX has spent 5% more days above the standard range. Now 5% isn't a deal breaker. We can find dramatic headlines that will excuse random volatility but I will argue we are at a crossroads. If we continue to stay above $20, we risk having to work hard and longer to get that figure back down. Remember calculating your GPA , but in reverse. Eventually the shock and awe of a +$30 VIX won't induce the same FOMO reaction and things may get really weird. When VIX goes into the new year, the powers that be will need to reign her in to avoid decoupling on any given Wednesday instead of just low liquidity holidays. My theory actually goes further down the rabbit hole when I narrowed down a true 50% average range, wait for it.... $10 - $16.75! YES! The overall, from inception, average high of range sits at $16.75. And pop on the tin foil hat because with that range, both the Housing Crisis/Great Recession AND the Covid Market are sitting at 91% above range. I checked that 3 times to be sure and I did not include that in the frame of this chart as it already had enough scribbling all over it, but if you explore to the bottom of the chart you will see a smashed up mess of it. So if your listening Market Makers, shut it down, shut it down now. And if that is what you are setting up to do as I have already speculated in a previous work up, well done! Keep it up. I know for a fact that the VIX is heavily relied upon by many successful traders in many different products for directional bias, let's not ruin it shall we...
On this chart you will see the table bar counts for inside and outside of price range for the specified period as well as the total bar count and the percentage of bars outside of that range.
That means up OR down so the period between the Recession and Covid has 12% outside of range, but you will notice that it goes below the range as well. When the price range was moved down
beneath the lows to $8, it lowered the percentage by 3 points.
I have also labeled some fun facts that occurred during the historical period to show a bit about why I choose the dates that I did.
Leave a comment for a heated debate, or to tell me how cool I am, or that I'm just a silly Goose.
en.wikipedia.org
www.statista.com
data.bls.gov

VIX is in bulling mode - zoomed outGetting close to its main support for the year.
All the time it got hit (this year) it reversed hard to the upside
VIX is in clear uptrend for a while now.
Check how and what the reaction was each time VIX gets above the trade range.
Expect VIX to hit 3x plus on the next upside!
Im accumulation 35 Apr calls, not going to sell those till the high, ideally in Jan or Mar
More SPX, NQ and BTC charts to follow...


VIX is getting for its own prime timeWatching 20-21 zone for a support.
Historically VIX 20 zone is the bear/bull line.
I expect that to me either tested or even broken for a fake move down and then start to explode.
When VIX is at 45+ watch for the market capitulation. Ideal target for the VIX is 65+ early next year.
When its moving above 35 and especially 45, no no longs for me period, only sell the rips (if there will be any)
Im in with Apr VIX 35 calls, will add tomorrow and on the 28th

S&P500 / VIX - Black Swan Incoming? 🔮Taking a look at the SP500 Daily with our US Equity Gaps indicator, next to the VIX Weekly.
Looking back to the start of 2022, we can see a series of "controlled" selling, on our grind from the 4700s, down to 3500-3600.📉
Compare that to the VIX, we can see the stock market has yet to experience a true black swan. See the 2020 mega spike in the VIX.
Whether it's due to geopolitical tensions, financial data, etc., we'll see. But you can almost feel that the market is teetering on a knife's edge. Or at least that's how we feel! 😬
Throw these against the Equity Gaps indicator, and it shows we have plenty to fill to the downside.🤯
Who knows. Maybe we're just being cynical. However, we feel there's a 10-30% downside vs a smaller 1-5% upside.
If that's the case, we're happy to be sitting on our hands for the time being.
-TucciNomics
Chief Overlord, AlgoBuddy

VIX is still getting ready for its prime timeI like how VIX is coiling, when it goes it will hit 65 area conservatively
I have started some Apr 35 2023 calls today

VIX Red, Markets Down, Nothing makes sense anymore:)VIX is waiting for its prime time and its coming soon imo
Im bullish with VIX and will start buying Apr 2023 40 calls on Monday.
There was no capitulation on the markets so is the VIX 2-3x rally!
Means the markets have more down to go and the next move will be very violent!
Things will start to move after the elections, means very soon!
