NZDCHF BUYSPrice was in a long downtrend, but sellers eventually lost strength. After a sharp selloff, the market began moving sideways — showing signs that larger players were quietly building positions while keeping price in a range.
Price then dipped below the range and quickly reversed, followed by strong buying that broke previous highs and shifted the overall structure from bearish to bullish. If that same buying pressure returns, we could see a continuation of the upward move as momentum builds.
Entry: 0.47629
Take Profit: 0.48139
Stop Loss: 0.47490
Volatility

ETH to Lead BTC Over Next 6 Months, Says Galaxy CEOIn a bold forecast that has reignited the debate over crypto market leadership, Galaxy Digital CEO Mike Novogratz stated that Ethereum (ETH) is poised to outperform Bitcoin (BTC) over the next six months, citing improving fundamentals, institutional tailwinds, and critical network upgrades.
Novogratz, a long-time crypto advocate with deep ties to both traditional finance and blockchain innovation, made the statement during an interview at the Digital Asset Summit in New York, sparking renewed discussion about the shifting dynamics between the two largest digital assets by market capitalization.
Ethereum’s Evolving Investment Case
“Ethereum is becoming more than just a smart contract platform,” said Novogratz. “It’s evolving into a foundational layer for the future of finance.”
This confidence is underpinned by Ethereum’s transition to proof-of-stake, reduced energy consumption, and growing usage of Layer 2 scaling solutions like Arbitrum and Optimism. These developments, Galaxy argues, have made Ethereum more attractive to institutional investors who previously stayed away due to scalability concerns and environmental critiques.
Stronger Fundamentals, Expanding Utility
Ethereum’s network revenue—driven by transaction fees and on-chain activity—has consistently outpaced competitors. According to Galaxy’s internal research, Ethereum generated over $2.1 billion in protocol revenue in the first half of 2025, compared to just under $1.5 billion for Bitcoin.
Additionally, the rise of real-world asset (RWA) tokenization, DeFi resurgence, and the adoption of Ethereum-based stablecoins by traditional finance platforms have significantly enhanced ETH’s long-term value proposition.
“Ethereum is no longer a tech experiment. It’s infrastructure,” Novogratz stated.
Bitcoin Still Dominates, But ETH Momentum Grows
While Novogratz remains bullish on Bitcoin, he emphasizes that BTC is now more of a macro hedge than a dynamic growth asset. With institutional investors already heavily exposed to Bitcoin via spot ETFs, the marginal capital over the next cycle may shift toward Ethereum, particularly as ETH-based ETF products gain traction.
“Bitcoin remains the king of store-of-value assets in crypto. But Ethereum is where innovation and yield are happening,” Novogratz added.
Six-Month Outlook
Galaxy projects that ETH could outperform BTC by 20–30% in the second half of 2025, driven by upgrades like Proto-Danksharding, expanding Layer 2 activity, and Ethereum’s role in cross-chain interoperability.
Novogratz also hinted that Galaxy is allocating more capital into Ethereum-based venture projects and staking infrastructure, in anticipation of a “second-layer boom” later this year.
Conclusion
While Bitcoin remains the undisputed anchor of the crypto economy, Ethereum’s expanding utility, institutional relevance, and revenue-generating capabilities position it to lead performance in the near term.

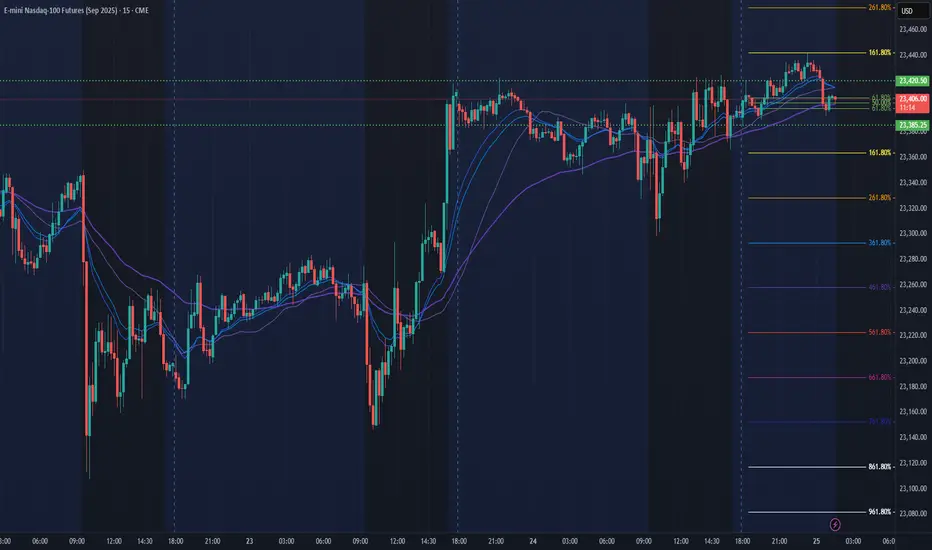
NQ Power Range Report with FIB Ext - 7/25/2025 SessionCME_MINI:NQU2025
- PR High: 23420.50
- PR Low: 23385.00
- NZ Spread: 79.5
Key scheduled economic events:
08:30 | Durable Goods Orders
Session open ATH break and retrace
Session Open Stats (As of 12:45 AM 7/25)
- Session Open ATR: 248.86
- Volume: 20K
- Open Int: 274K
- Trend Grade: Long
- From BA ATH: -0.0% (Rounded)
Key Levels (Rounded - Think of these as ranges)
- Long: 23811
- Mid: 22096
- Short: 20383
Keep in mind this is not speculation or a prediction. Only a report of the Power Range with Fib extensions for target hunting. Do your DD! You determine your risk tolerance. You are fully capable of making your own decisions.
BA: Back Adjusted
BuZ/BeZ: Bull Zone / Bear Zone
NZ: Neutral Zone
Bitcoin Slips Under 200-Day Moving Average – Will the Downtrend Bitcoin (BTC), the largest cryptocurrency by market capitalization, recently slipped below its 200-day simple moving average (SMA)—a key technical indicator widely used by traders to assess long-term market trends. This breakdown has raised concerns among investors that the current correction could turn into a more sustained downtrend.
What Does the Break Below the 200-Day SMA Mean?
The 200-day SMA is traditionally viewed as the dividing line between bullish and bearish market phases. When BTC trades above this level, it signals strength and long-term bullish momentum. However, a drop below it is often seen as a warning sign that sentiment is shifting and sellers are gaining control.
As of writing, BTC is trading around $57,000, below the 200-day SMA, which stands near $58,400. Trading volumes have decreased, while technical indicators like the RSI and MACD are pointing to weakening momentum.
Reasons Behind the Decline
Several factors are contributing to BTC’s current downward movement:
Increased regulatory pressure – Recent actions by the SEC and other regulatory bodies targeting exchanges and token classifications have spooked markets.
Macroeconomic uncertainty – Market expectations of more hawkish monetary policy by the U.S. Federal Reserve, including possible interest rate hikes, have added to investor anxiety.
Decreased institutional interest, as capital flows shift back toward traditional assets like gold and bonds.
Profit-taking by large holders (whales), especially after the strong performance during the spring rally.
Will the Downtrend Continue?
From a technical perspective, the next key support zone lies around $54,000–$55,000. A breakdown below this area could open the door to $50,000 and possibly lower levels. On the flip side, if BTC quickly recovers and closes above the 200-day SMA, the move could turn out to be a false breakdown, preserving the broader uptrend.
Traders should watch for:
Volume on rebounds: A bounce accompanied by rising volume could signal renewed buyer interest.
Altcoin behavior: In periods of uncertainty, capital tends to flow out of altcoins and into BTC or stablecoins.
Fundamental catalysts, such as ETF approvals or major institutional investments, which could quickly shift sentiment.
Conclusion
The drop below the 200-day SMA is a bearish technical signal and could mark the beginning of a medium-term downtrend. However, given the volatility of the crypto market, a swift recovery is always possible. Investors should remain cautious, closely monitor key levels, and keep an eye on both macro and on-chain developments.

Can Gold Regain Its Recent Highs or Does a Shakeout Loom?Gold has seen its price volatility increase across the first three trading days of this week. The initial move was a 3% spike higher from opening levels at 3339 on Monday, to a one month high of 3439 early on Wednesday morning, as traders sought out Gold as a safe haven hedge against renewed political attacks on the independence of the Federal Reserve and more specifically its Chairman, Jerome Powell.
Then on Wednesday, the outlook for Gold changed again, almost instantaneously, and prices reversed their course, dropping 1.7% to touch a low of 3381 after President Trump announced a trade deal with Japan, which agreed tariffs of 15% on Japanese imports into the US, a number better than many traders and investors had anticipated. Taken alongside a Bloomberg report released on Wednesday afternoon suggesting a similar agreement could be reached with the EU using the Japan deal as a blueprint, and suddenly the need for Gold as a safe haven hedge didn’t seem quite so necessary.
However, while Gold has traded as low as 3374 this morning, prices remain around 1% higher on the week (around 3380 at time of writing 0700 BST), supported on dips by an on-going theme of dollar weakness, which has continued as risk sentiment has shifted to a more positive stance. The challenge for traders is to determine whether this will remain the case into the weekend.
Looking forward, President Trump still needs to agree any trade deal negotiated with the EU, which could be a stumbling block keeping Gold volatility elevated, as could updates on the strength of the US economy when the Preliminary PMI Surveys for July are released later today at 1445 BST. Any print below 50 = economic contraction, while any print above 50 = economic expansion, and the direction of service activity in the US economy may be what draws the most headlines, especially if it moves back to the downside.
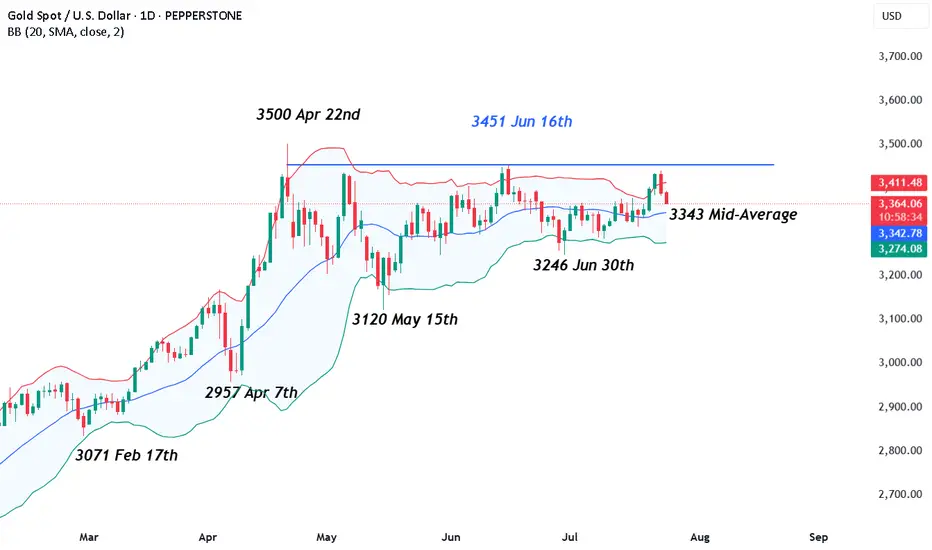
The failure of Gold ahead of the June high at 3451 may also be potentially important from a technical perspective and this is discussed further below.
Technical Update: 3451 June Highs In Focus
Having previously encountered selling pressure leading to price weakness after being capped at the June 16th high of 3451, this level remains a potential resistance focus for traders. These themes may also have been strengthened after Wednesday’s failure below this level (the session high was 3439), which has prompted the latest downside price activity, as the chart below shows.
This activity may see traders question the sustainability of the recent price strength, even looking for fresh price declines. With this in mind, let’s consider what support or resistance levels could be monitored to help establish the direction of the next possible price move.
Possible Support Levels:
The first support level if price declines are seen over the balance of the week may be marked by 3343, which is equal to the Bollinger mid-average.
Closing breaks under the 3343 support, while not a guarantee of a more extended phase of price weakness, might then open potential for a move towards 3246, the June 30th session low.
Possible Resistance Levels:
As we have suggested, it’s possible the 3451 June 16th session high represents the first resistance focus for traders, if attempts at price strength are again seen.
However, closing breaks above 3451 may be required to suggest the potential of a more extended phase of price strength to challenge the 3500 April 22nd all-time high and possibly further if this is broken on a closing basis.
Pepperstone doesn’t represent that the material provided here is accurate, current or complete, and therefore shouldn’t be relied upon as such. The information, whether from a third party or not, isn’t to be considered as a recommendation; or an offer to buy or sell; or the solicitation of an offer to buy or sell any security, financial product or instrument; or to participate in any particular trading strategy. It does not take into account readers’ financial situation or investment objectives. We advise any readers of this content to seek their own advice. Without the approval of Pepperstone, reproduction or redistribution of this information isn’t permitted.
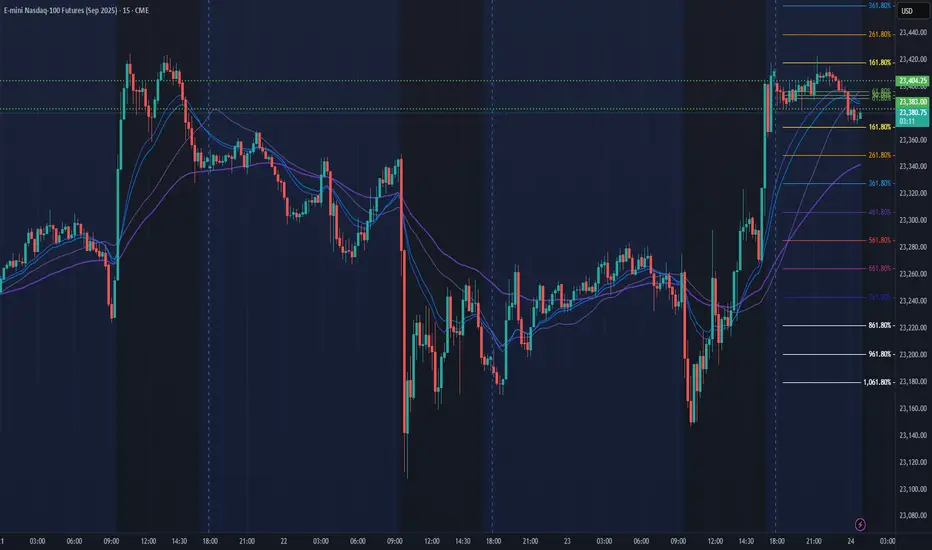
NQ Power Range Report with FIB Ext - 7/24/2025 SessionCME_MINI:NQU2025
- PR High: 23404.25
- PR Low: 23383.00
- NZ Spread: 47.75
Key scheduled economic events:
08:30 | Initial Jobless Claims
09:45 | S&P Global Manufacturing PMI
- S&P Global Services PMI
10:00 | New Home Sales
Front run ATH, advertising breakout potential
Session Open Stats (As of 12:15 AM 7/24)
- Session Open ATR: 258.10
- Volume: 18K
- Open Int: 271K
- Trend Grade: Neutral
- From BA ATH: -0.1% (Rounded)
Key Levels (Rounded - Think of these as ranges)
- Long: 23811
- Mid: 22096
- Short: 20383
Keep in mind this is not speculation or a prediction. Only a report of the Power Range with Fib extensions for target hunting. Do your DD! You determine your risk tolerance. You are fully capable of making your own decisions.
BA: Back Adjusted
BuZ/BeZ: Bull Zone / Bear Zone
NZ: Neutral Zone
Nothing lasts forever, Not even this IdeaI would short now, but I'd also put my Stop-loss close, and my TP open, and shift my Stop-loss gradually. this position is risky, but hey no trade is too expensive when you are learning constantly, and acting accordingly.

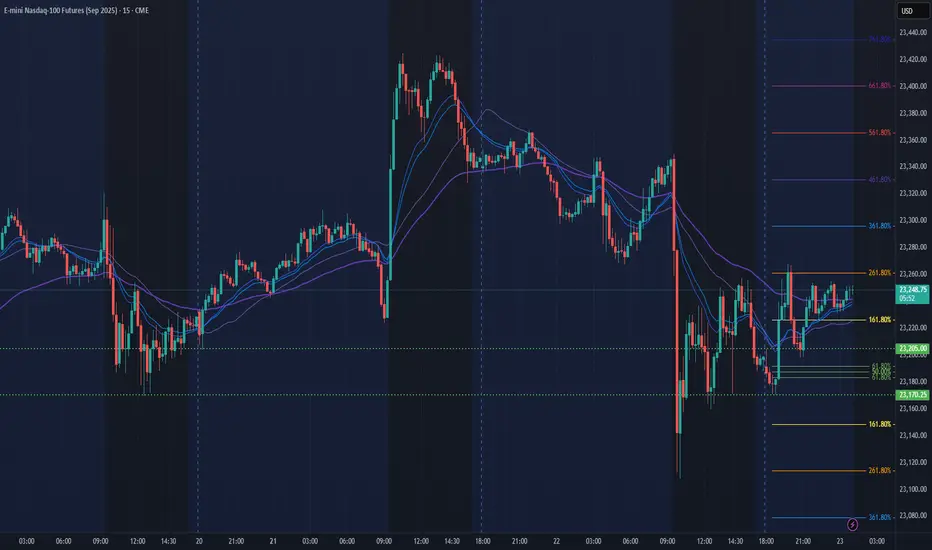
NQ Power Range Report with FIB Ext - 7/23/2025 SessionCME_MINI:NQU2025
- PR High: 23205.00
- PR Low: 23170.25
- NZ Spread: 77.75
Key scheduled economic events:
10:00 | Existing Home Sales
10:30 | Crude Oil Inventories
Session Open Stats (As of 12:25 AM 7/23)
- Session Open ATR: 261.82
- Volume: 34K
- Open Int: 270K
- Trend Grade: Neutral
- From BA ATH: -0.7% (Rounded)
Key Levels (Rounded - Think of these as ranges)
- Long: 23811
- Mid: 22096
- Short: 20383
Keep in mind this is not speculation or a prediction. Only a report of the Power Range with Fib extensions for target hunting. Do your DD! You determine your risk tolerance. You are fully capable of making your own decisions.
BA: Back Adjusted
BuZ/BeZ: Bull Zone / Bear Zone
NZ: Neutral Zone
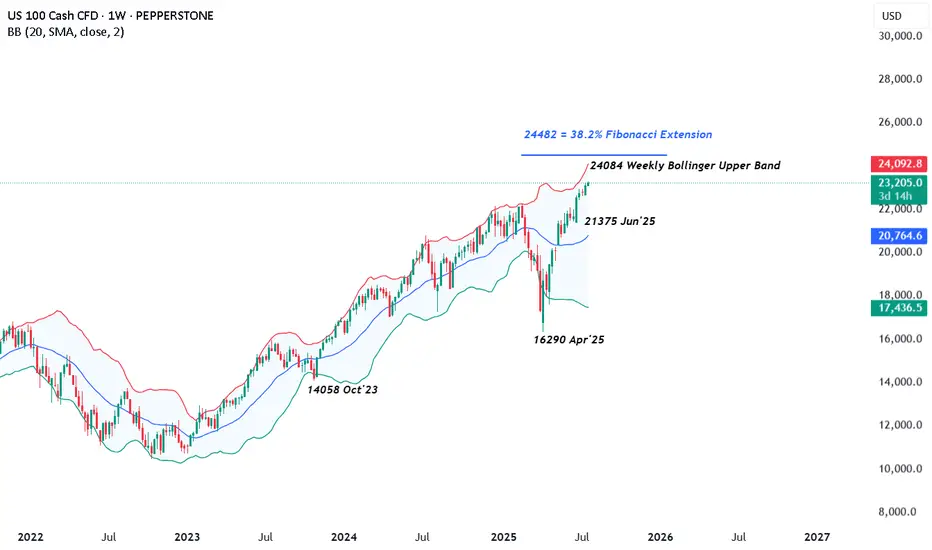
US 100 – All Eyes on Tariffs, Trade Deals and Tech EarningsRenewed demand for US assets has been evident throughout July so far and this has helped to lift the US 100 index to new heights with gains of over 2.5% across the month. The technology heavy index has risen from opening levels around 22650 on July 1st, then recorded several all time highs, before eventually finding some selling interest after printing the most recent record peak at 23282 yesterday afternoon.
This upside has been supported by fresh trader hopes of interest rate cuts, after Federal Reserve (Fed) policymaker Waller suggested last Thursday that he would consider a 25bps (0.25%) reduction at their next meeting on July 30th, despite Fed Chairman Powell maintaining the view that the US central bank are currently pursuing a wait and see approach, as they look for more information on inflation and growth trends to assist them to determine the on-going impact of tariffs.
Part of the reason for the Fed’s reluctance to cut rates has also been the resilience of US economic data. With US consumers still spending and employment yet to feel the negative impact of President Trump’s tariff policies, leading to a potential positive knock-on impact for growth and corporate earnings, when considered against prior downbeat market expectations.
This all leads nicely onto what could be a key sentiment driver for the direction of the US 100 this week, the start of earnings updates from the ‘Magnificent Seven’ tech companies, two of which, Alphabet and Tesla, report their earnings after the market close tomorrow. These are then followed by Microsoft and Meta on Wednesday July 30th, then Amazon and Apple on Thursday July 31st.
Traders will be keen to judge actual earnings against market expectations, alongside updates on AI spending and investment, forward guidance on the impact of tariffs and more specifically for Tesla, the time Elon Musk may dedicate to the company, rather than the distractions of politics.
The technical outlook could also be important.
Technical Update: Can The Positive Trend Extend Further?
There appears to be no clear-cut signs of a negative sentiment shift in the US 100 index yet, as fresh buying has continued to develop above support provided by the rising daily Bollinger mid-average, currently at 22785 (see chart below).
Of course, there is no guarantee this positive pattern of higher price highs and higher price lows will continue, especially given the on-going trade discussion between the US and its allies, as well as the earnings announcements from Alphabet and Tesla.
However, it can be useful for traders to prepare for any future volatility by assessing potential support and resistance levels that could impact the direction of the US 100 moving forward.
Potential Support Levels:
It is possible the rising Bollinger mid-average, currently at 22785, represents a first support focus for traders, and as such, closing breaks below this level might lead to a more extended phase of price weakness.
Such moves could see a deeper sell-off towards 22533, which is equal to the 38.2% Fibonacci retracement of June 23rd to July 18th 2025 price strength.
Potential Resistance Levels:
With fresh price strength emerging with the US 100 index above the rising Bollinger mid-average, a positive price pattern of higher highs and higher lows, may still be evident. This reflects buyers are currently willing to pay higher prices, each time a setback materialises.
However, to maintain this uptrend pattern in price, the focus could now be on resistance provided by the July high at 23282 (July 21st). Closing breaks above this level might be required to suggest further strength, towards the next potential resistance level at 24084, which is the weekly Bollinger upper band, even 24482, which is equal to the 38.2% Fibonacci extension.
The material provided here has not been prepared in accordance with legal requirements designed to promote the independence of investment research and as such is considered to be a marketing communication. Whilst it is not subject to any prohibition on dealing ahead of the dissemination of investment research, we will not seek to take any advantage before providing it to our clients.
Pepperstone doesn’t represent that the material provided here is accurate, current or complete, and therefore shouldn’t be relied upon as such. The information, whether from a third party or not, isn’t to be considered as a recommendation; or an offer to buy or sell; or the solicitation of an offer to buy or sell any security, financial product or instrument; or to participate in any particular trading strategy. It does not take into account readers’ financial situation or investment objectives. We advise any readers of this content to seek their own advice. Without the approval of Pepperstone, reproduction or redistribution of this information isn’t permitted.
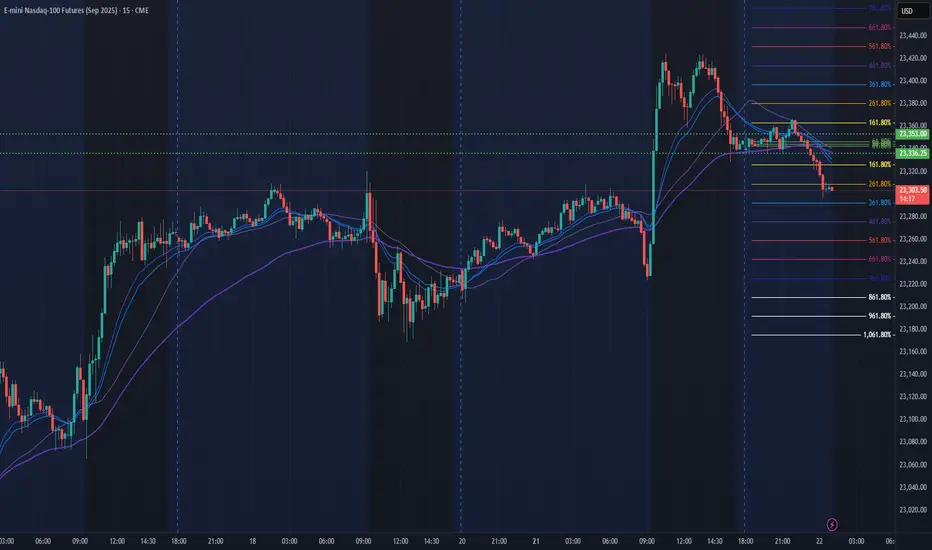
NQ Power Range Report with FIB Ext - 7/22/2025 SessionCME_MINI:NQU2025
- PR High: 23353.00
- PR Low: 23336.00
- NZ Spread: 38.0
Key scheduled economic events:
08:30 | Fed Chair Powell Speaks
Session Open Stats (As of 1:45 AM 7/22)
- Session Open ATR: 260.85
- Volume: 19K
- Open Int: 277K
- Trend Grade: Neutral
- From BA ATH: -0.1% (Rounded)
Key Levels (Rounded - Think of these as ranges)
- Long: 23811
- Mid: 22096
- Short: 20383
Keep in mind this is not speculation or a prediction. Only a report of the Power Range with Fib extensions for target hunting. Do your DD! You determine your risk tolerance. You are fully capable of making your own decisions.
BA: Back Adjusted
BuZ/BeZ: Bull Zone / Bear Zone
NZ: Neutral Zone
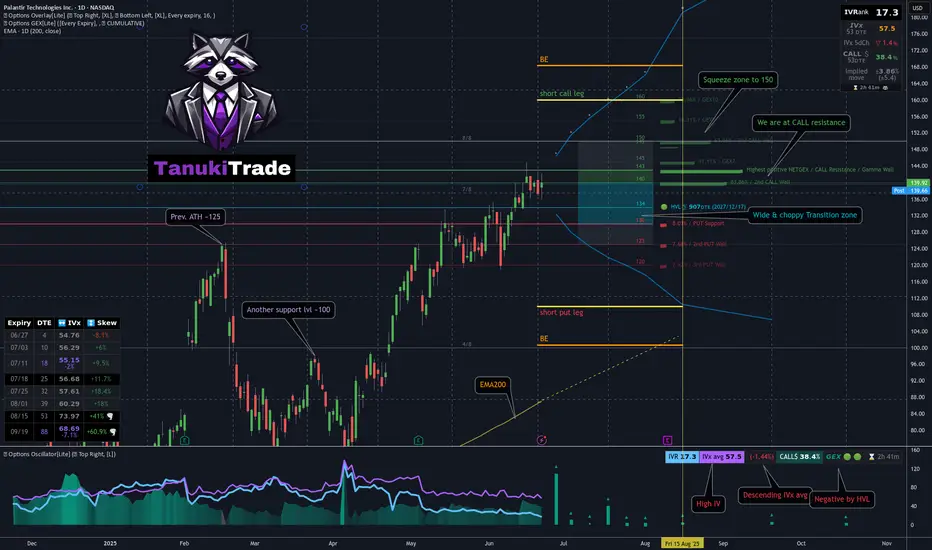
Jade Lizard on PLTR - My 53DTE Summer Theta PlayMany of you — and yes, I see you in my DMs 😄 — are trading PLTR, whether using LEAPS, wheeling, or covered calls.
I took a closer look. And guess what?
📈 After a strong move higher, PLTR was rejected right at the $143 call wall — pretty much all cumulative expiries cluster resistance there
Using the GEX Profile indicator, scanning all expirations:
After a brief dip, the market is repositioning bullish
Squeeze zone extends up to 150
The most distant GEX level is sitting at 160
On the downside, 130 is firm support, with some presence even at 120 — the market isn’t pricing in much risk below that
📉 From a technical standpoint:
We’re near all-time highs
125 (previous ATH) and 100 are key support levels
The OTM delta curve through August is wide, and the call side is paying well — with a current call pricing skew
🔬 IVx is at 57, trending lower + call pricing skew📉 IV Rank isn't particularly high, but the directional IVx matters more here
💡 Summer Theta Play: Jade Lizard on PLTR
Since I’ll be traveling this summer and don’t want to micromanage trades, I looked for something low-touch and high-confidence — and revisited an old favorite: the Jade Lizard.
If you're not familiar with the strategy, I recommend checking out Tastytrade's links and videos on Jade Lizards.
🔹 Why this setup?
Breakeven sits near $100, even with no management
On TastyTrade margin:~$1800 initial margin ~$830 max profit
53 DTE — plenty of time for theta to work
Earnings hit in August — I plan to close before then
Covers all bullish GEX resistance zones
Quickly turns profitable if IV doesn’t spike
Highly adjustable if needed
My conclusion: this strategy covers a much broader range than what the current GEX Profile shows across all expirations — so by my standards, I consider this to be a relatively lower-risk setup compared to most other symbols right now with similar theta strategies.
🔧 How would I adjust if needed?
If price moves up:
I’d roll the short put up to collect additional credit
Hold the call vertical as long as the curve supports it
If price drops:
Transition into a put ratio spread
Either extend or remove the call vertical depending on conditions
🛑 What’s the cut loss plan?
I have about 20% wiggle room on the upside, so I’m not too worried — but if price rips through 160 quickly, I’ll have to consider early closure.
If that happens, the decision depends on time:
If late in the cycle with low DTE:→ Take a small loss & roll out to next month for credit
If early with lots of DTE remaining:→ Consider converting to a butterfly, pushing out the call vertical for a small debit→ Offset this with credit from rolling the put upward
As always — stay sharp, manage your risk, and may the profit be with you.
See you next week!– Greg @ TanukiTrade

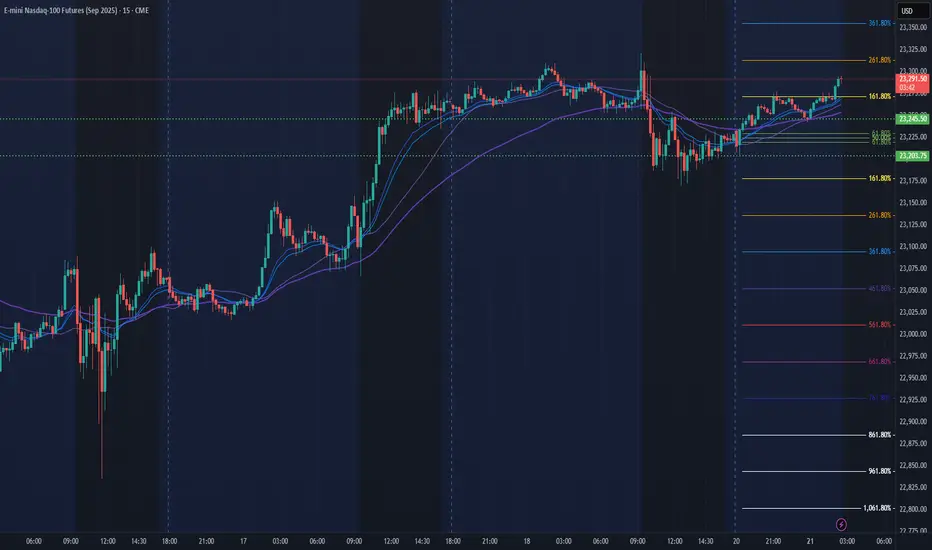
NQ Power Range Report with FIB Ext - 7/21/2025 SessionCME_MINI:NQU2025
- PR High: 23203.75
- PR Low: 23245.50
- NZ Spread: 93.25
No key scheduled economic events
In range to continue pushing ATH
Session Open Stats (As of 1:45 AM 7/21)
- Session Open ATR: 266.36
- Volume: 21K
- Open Int: 274K
- Trend Grade: Neutral
- From BA ATH: -0.1% (Rounded)
Key Levels (Rounded - Think of these as ranges)
- Long: 23811
- Mid: 22096
- Short: 20383
Keep in mind this is not speculation or a prediction. Only a report of the Power Range with Fib extensions for target hunting. Do your DD! You determine your risk tolerance. You are fully capable of making your own decisions.
BA: Back Adjusted
BuZ/BeZ: Bull Zone / Bear Zone
NZ: Neutral Zone
Weekly Volatility ReadGood Evening --🌗 🌕🌓
I hope everyone is having a relaxing weekend with friends and family alike because soon we will be in the thick of the price action again -- and it may get spicy! Let't us dive in as we review what happened last week and we look towards the next to trade range or observe.
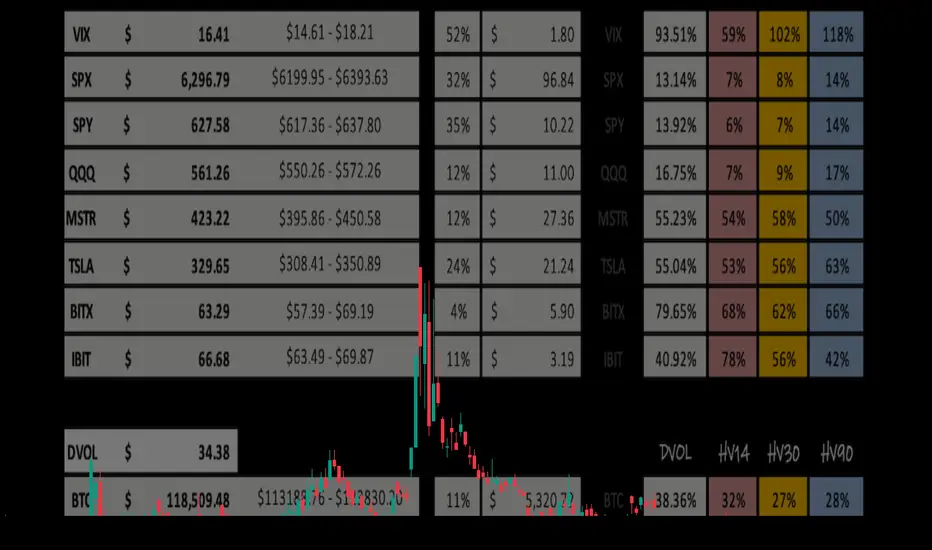
The CBOE:SPX opened the week fairly slow at $6,193.18 and increased throughout the week wicking up to a new ATH of $6,315.61 only to close the week off at $6,267.28 -- This leaves the IM on the week +$83.10. This closest respects the quarterly implied range that was a 'strength of IV' of 129.30%.
Now looking towards this next week we have extremely low HV across the board in the broader markets. CBOE:SPX IV (13.14%) is trending 32% IV percentile on the year -- premium is seemingly cheap. HV10 (6.97%) is coiled within 97.67% of it's sliding yearly lows, showing a need for short-term volatility to consolidate. HV21 (7.78%) is even more coiled to it's yearly low at 98.76% respectively. Both are roughly mid 50% 'strength to IV' as IV predicts twice the potential move next week.
Lastly, HV63 our quarterly trending values is showing a 'strength of IV' at only 108% but, could be supporting the thesis IV is projecting, as we do need a TVC:VIX pop OR time-wise consolidation. 📈📉
I hope everyone has a great week trading ranges and I will see you next weekend!
Cheers! 🍻🍻🍻
Weekly Volatility Snapshot Good Evening --
I hope everyone is having a restful weekend and enjoying your time away from markets. Always appreciate it while you can, and spend that precious time with loved ones. Now, let us review the price action last week as we look towards our expectations for the coming trading sessions.
The CBOE:SPX opened the weekly candle at $6,126.15 and closed $6,252.50 -- this respectively puts the weekly move at +$126.35. This is slightly above what IV was stating entering the week. We are starting to see seasonality set in as the markets top and look for consolidation. The TVC:VIX dropped throughout the week putting a bottom in at $15.70 which shows volatility creeping to it's lowest point year-to-date.
We should all expect a volatility bounce in the near future as the run the broader markets have made out of the steep correction needs to cool off before moving forward. Below is my volatility read for the S&P 500. You will see that HV10 (7.94%) is coiled within 3.30% of its sliding yearly lows. This tells me between the low sentiment in fear and the low volatility in short-term trends, we need to cool off a little.
Now looking towards this week, I see the broader markets consolidating and even selling off in order to reset the overbought 'lagging' indicators and pop the VIX up a little bit. The administration has pushed the trade deal deadline off till AUG 1st providing some relief to the markets but, has also created more uncertainties with tariff letters that went out Friday.
Look for a negative news cycle sparking up Sunday night into Monday, potentially creating momentum downwards. However, I believe we stay in range of what HV10 weighted to IV implies -- $6,207.72 - $6,311.78. This range holds a divergence from IV of 5.29% and and price gap difference of -$17.32. To me, this says that what is short-term trending is 'contractive' to what IV states.
That's all for this week. Stay hedged against your bias always and remember to practice your ABCs -- If you like what you are reading and love volatility range analysis as much as i do -- feel free to drop me a comment and ill get back to you! Till next time, Cheers!

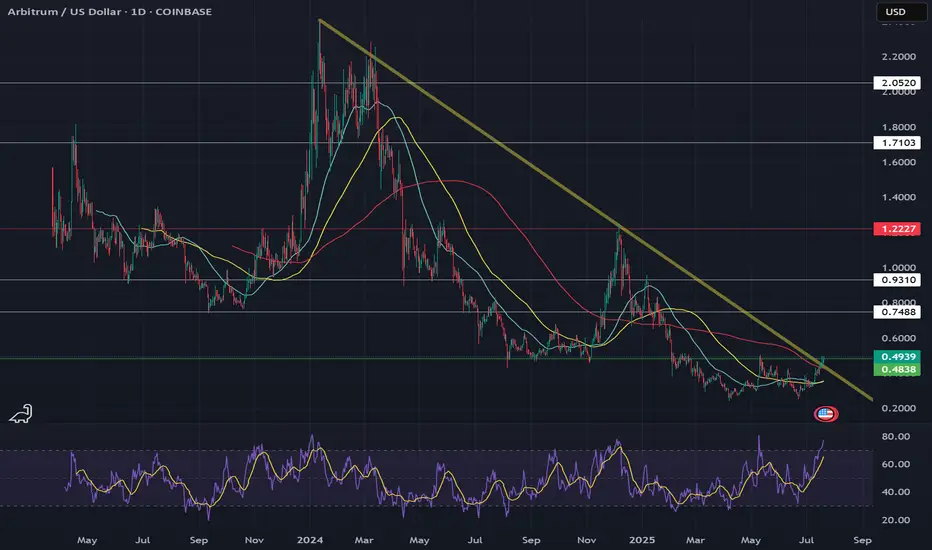
Bullish BreakoutARB/USDT recently showed a breakout above a descending trendline from Jan 24' on the daily timeframe, suggesting bullish momentum. .43 would be a good entry off the 200 MA if we get a back test and if ETH decides to pullback or continue its run to 4000. Arbitrum has officially hits a ATH in stablecoin supply $7,900,000,000. Adoption is in full swing BTC stable I bought a good bit today on robinhood and will buy more up or down. Targets .80, 1, 1.8.
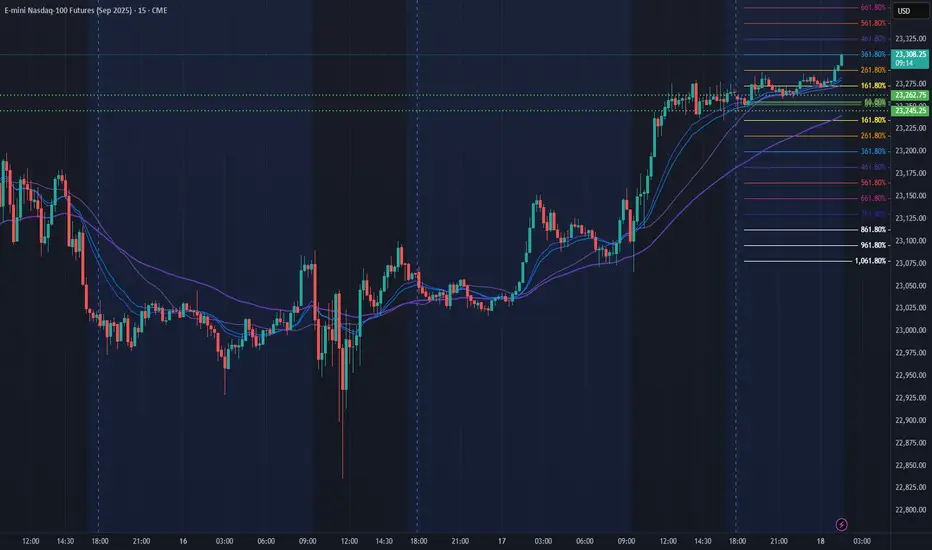
NQ Power Range Report with FIB Ext - 7/18/2025 SessionCME_MINI:NQU2025
- PR High: 23262.75
- PR Low: 23245.25
- NZ Spread: 39.0
No key scheduled economic events
Pushing ATH through overnight hours
Session Open Stats (As of 1:15 AM 7/18)
- Session Open ATR: 272.56
- Volume: 18K
- Open Int: 286K
- Trend Grade: Neutral
- From BA ATH: -0.0% (Rounded)
Key Levels (Rounded - Think of these as ranges)
- Long: 23811
- Mid: 22096
- Short: 20383
Keep in mind this is not speculation or a prediction. Only a report of the Power Range with Fib extensions for target hunting. Do your DD! You determine your risk tolerance. You are fully capable of making your own decisions.
BA: Back Adjusted
BuZ/BeZ: Bull Zone / Bear Zone
NZ: Neutral Zone
Germany 40 – Preparing For A Short Term Range BreakoutTariff worries, including new comments from President Trump stating that he is likely to impose fresh import charges on pharmaceuticals, have continued to dominate the thinking of Germany 40 traders this week. This has lead to some choppy price action for the index, which after opening on Monday at 24140, has bounced between a Tuesday high of 24293 and a Wednesday low of 23923, before settling back into the middle of that range.
Throw into the mix, the start of Q2 earnings season for European corporates and an upcoming ECB interest rate decision in a week's time and you can see how price action could become increasingly volatile moving forward into the end of July.
Earnings season has so far got off to a slow start in Europe and Germany 40 traders may have to wait until SAP, the company carrying the highest market capitalisation ($352 billion) and index weighting (14.5%), reports its results next Tuesday (after the close) for further insight into where prices may move next.
In terms of the ECB rate decision next Thursday (July 24th), market expectations may currently be indicating that another rate cut is unlikely, although it could be a close call. Traders seem to be focusing on recent commentary from policymakers which suggests the balance of power for the time being has shifted to the more hawkish committee members, who have stated that with inflation sitting on the central bank's target of 2% there is no need to cut rates further. Choosing instead to wait for more clarity on the outcome of trade negotiations with the US, which could decide whether a trade war between the world's first and third biggest economies may be something they need to navigate.
Technical Update: Assessing Current Pirce Action
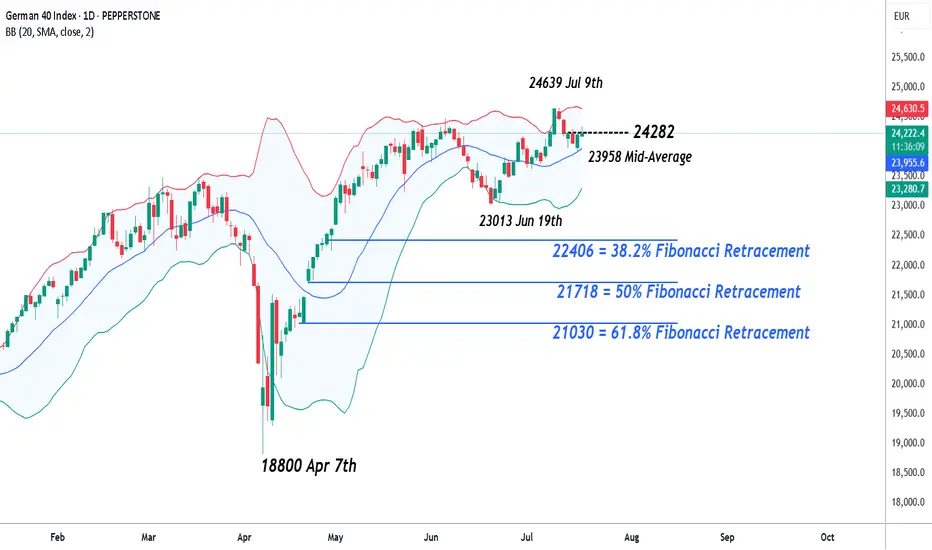
Having posted a new all-time high at 24639 on July 9th the Germany 40 index has entered a corrective period in price. However, while much will depend on future market sentiment and price trends, traders may well be asking, whether current price declines can develop into a more extended phase of weakness, or if the downside move could be limited as buyers return once again.
Time will tell, but in the meantime, technical analysis may help pinpoint potential support and resistance levels which can aid traders in establishing the next possible trends and directional risks.
Potential Support Levels:
Having recently posted a new all-time high at 24639, it might be argued this is still a positive price trend, especially as the Bollinger mid-average is currently rising. The mid-average stands at 23954, so may mark the first support focus for traders over coming sessions.
However, if closing breaks of this 23954 level materialise, it might lead towards a further phase of price weakness towards 23013, the June 19th session low, even 22406, which is the 38.2% Fibonacci retracement of April to July 2025 price strength.
Potential Resistance Levels:
If the 23954 mid-average successfully holds the current price setback, it could prompt further attempts to extend recent strength.
The first resistance might then stand at 24282, which is equal to half of the latest weakness, with successful closing breaks above this level possibly opening scope back to the 24639 all-time high and maybe further, if this in turn gives way.
The material provided here has not been prepared accordance with legal requirements designed to promote the independence of investment research and as such is considered to be a marketing communication. Whilst it is not subject to any prohibition on dealing ahead of the dissemination of investment research, we will not seek to take any advantage before providing it to our clients.
Pepperstone doesn’t represent that the material provided here is accurate, current or complete, and therefore shouldn’t be relied upon as such. The information, whether from a third party or not, isn’t to be considered as a recommendation; or an offer to buy or sell; or the solicitation of an offer to buy or sell any security, financial product or instrument; or to participate in any particular trading strategy. It does not take into account readers’ financial situation or investment objectives. We advise any readers of this content to seek their own advice. Without the approval of Pepperstone, reproduction or redistribution of this information isn’t permitted.
Germany 40 – Preparing For A Short Term Range BreakoutTariff worries, including new comments from President Trump stating that he is likely to impose fresh import charges on pharmaceuticals, have continued to dominate the thinking of Germany 40 traders this week. This has lead to some choppy price action for the index, which after opening on Monday at 24140, has bounced between a Tuesday high of 24293 and a Wednesday low of 23923, before settling back into the middle of that range.
Throw into the mix, the start of Q2 earnings season for European corporates and an upcoming ECB interest rate decision in a week's time and you can see how price action could become increasingly volatile moving forward into the end of July.
Earnings season has so far got off to a slow start in Europe and Germany 40 traders may have to wait until SAP, the company carrying the highest market capitalisation ($352 billion) and index weighting (14.5%), reports its results next Tuesday (after the close) for further insight into where prices may move next.
In terms of the ECB rate decision next Thursday (July 24th), market expectations may currently be indicating that another rate cut is unlikely, although it could be a close call. Traders seem to be focusing on recent commentary from policymakers which suggests the balance of power for the time being has shifted to the more hawkish committee members, who have stated that with inflation sitting on the central bank's target of 2% there is no need to cut rates further. Choosing instead to wait for more clarity on the outcome of trade negotiations with the US, which could decide whether a trade war between the world's first and third biggest economies may be something they need to navigate.
Technical Update: Assessing Current Pirce Action
Having posted a new all-time high at 24639 on July 9th the Germany 40 index has entered a corrective period in price. However, while much will depend on future market sentiment and price trends, traders may well be asking, whether current price declines can develop into a more extended phase of weakness, or if the downside move could be limited as buyers return once again.
Time will tell, but in the meantime, technical analysis may help pinpoint potential support and resistance levels which can aid traders in establishing the next possible trends and directional risks.
Potential Support Levels:
Having recently posted a new all-time high at 24639, it might be argued this is still a positive price trend, especially as the Bollinger mid-average is currently rising. The mid-average stands at 23954, so may mark the first support focus for traders over coming sessions.
However, if closing breaks of this 23954 level materialise, it might lead towards a further phase of price weakness towards 23013, the June 19th session low, even 22406, which is the 38.2% Fibonacci retracement of April to July 2025 price strength.
Potential Resistance Levels:
If the 23954 mid-average successfully holds the current price setback, it could prompt further attempts to extend recent strength.
The first resistance might then stand at 24282, which is equal to half of the latest weakness, with successful closing breaks above this level possibly opening scope back to the 24639 all-time high and maybe further, if this in turn gives way.
The material provided here has not been prepared accordance with legal requirements designed to promote the independence of investment research and as such is considered to be a marketing communication. Whilst it is not subject to any prohibition on dealing ahead of the dissemination of investment research, we will not seek to take any advantage before providing it to our clients.
Pepperstone doesn’t represent that the material provided here is accurate, current or complete, and therefore shouldn’t be relied upon as such. The information, whether from a third party or not, isn’t to be considered as a recommendation; or an offer to buy or sell; or the solicitation of an offer to buy or sell any security, financial product or instrument; or to participate in any particular trading strategy. It does not take into account readers’ financial situation or investment objectives. We advise any readers of this content to seek their own advice. Without the approval of Pepperstone, reproduction or redistribution of this information isn’t permitted.

Germany 40 – Preparing For A Short Term Range BreakoutTariff worries, including new comments from President Trump stating that he is likely to impose fresh import charges on pharmaceuticals, have continued to dominate the thinking of Germany 40 traders this week, leading to some choppy price action for the index, which after opening on Monday at 24084, has bounced between a Tuesday high of 24293 and a Wednesday low of 23925, before settling back into the middle of that range.
Throw into the mix, the start of Q2 earnings season for European corporates and an upcoming ECB interest rate decision in a week's time and you can see how price action could become increasingly volatile moving forward into the end of July.
Earnings season has so far got off to a slow start in Europe and Germany 40 traders may have to wait until SAP, the company carrying the highest market capitalisation ($352 billion) and index weighting (14.5%), reports its results next Tuesday (after the close) for further insight into where prices may move next.
In terms of the ECB rate decision next Thursday (July 24th), market expectations may currently be indicating that another rate cut is unlikely, although it could be a close call. Traders seem to be focusing on recent commentary from policymakers which suggests the balance of power for the time being has shifted to the more hawkish committee members, who have stated that with inflation sitting on the central bank's target of 2% there is no need to cut rates further. Choosing instead to wait for more clarity on the outcome of trade negotiations with the US, which could decide whether a trade war between the world's first and third biggest economies may be something they need to navigate.
Technical Update:
Having posted a new all-time high at 24639 on July 9th the German 40 index has entered a corrective period in price. However, while much will depend on future market sentiment and price trends, traders may well be asking, if current price declines can develop into a more extended phase of weakness, or if downside is just a limited move before buyers return to extend price strength.
Time will tell, but in the meantime, technical analysis may help pinpoint potential support and resistance levels, aiding in establishing next possible trends and directional risks.
Potential Support:
Having recently posted a new all-time high at 24639, it might be argued this is still a positive price trend, especially as the Bollinger mid-average is currently rising. This for Thursday stands at 23954, so may mark the first support focus for traders over coming sessions.
If closing breaks of this 23954 level materialise, it might lead towards a further phase of price weakness towards 23013, the June 19th session low, even 22406, the 38.2% Fibonacci retracement of April to July 2025 price strength.
Potential Resistance:
If the 23954 mid-average successfully holds the current price setback, it could possibly prompt further attempts to extend recent strength.
First resistance might then stand at 24282, equal to half latest weakness, with successful closing breaks possibly then opening scope back to the 24639 all-time high and maybe further, if this in turn gives way.
The material provided here has not been prepared accordance with legal requirements designed to promote the independence of investment research and as such is considered to be a marketing communication. Whilst it is not subject to any prohibition on dealing ahead of the dissemination of investment research, we will not seek to take any advantage before providing it to our clients.
Pepperstone doesn’t represent that the material provided here is accurate, current or complete, and therefore shouldn’t be relied upon as such. The information, whether from a third party or not, isn’t to be considered as a recommendation; or an offer to buy or sell; or the solicitation of an offer to buy or sell any security, financial product or instrument; or to participate in any particular trading strategy. It does not take into account readers’ financial situation or investment objectives. We advise any readers of this content to seek their own advice. Without the approval of Pepperstone, reproduction or redistribution of this information isn’t permitted.

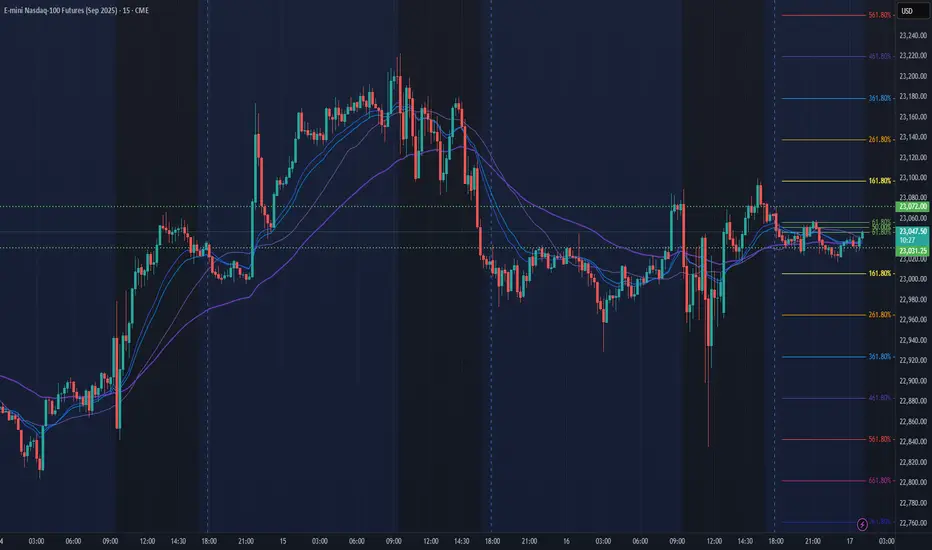
NQ Power Range Report with FIB Ext - 7/17/2025 SessionCME_MINI:NQU2025
- PR High: 23072.00
- PR Low: 23031.25
- NZ Spread: 91.25
Key scheduled economic events:
08:30 | Initial Jobless Claims
- Retail Sales (Core|MoM)
- Philadelphia Fed Manufacturing Index
Session Open Stats (As of 12:35 AM 7/17)
- Session Open ATR: 274.88
- Volume: 18K
- Open Int: 268K
- Trend Grade: Neutral
- From BA ATH: -0.8% (Rounded)
Key Levels (Rounded - Think of these as ranges)
- Long: 23239
- Mid: 21525
- Short: 20383
Keep in mind this is not speculation or a prediction. Only a report of the Power Range with Fib extensions for target hunting. Do your DD! You determine your risk tolerance. You are fully capable of making your own decisions.
BA: Back Adjusted
BuZ/BeZ: Bull Zone / Bear Zone
NZ: Neutral Zone
Germany 40 – Preparing For A Short Term Range BreakoutTariff worries, including new comments from President Trump stating that he is likely to impose fresh import charges on pharmaceuticals, have continued to dominate the thinking of Germany 40 traders this week, leading to some choppy price action for the index, which after opening on Monday at 24084, has bounced between a Tuesday high of 24293 and a Wednesday low of 23925, before settling back into the middle of that range.
Throw into the mix, the start of Q2 earnings season for European corporates and an upcoming ECB interest rate decision in a week's time and you can see how price action could become increasingly volatile moving forward into the end of July.
Earnings season has so far got off to a slow start in Europe and Germany 40 traders may have to wait until SAP, the company carrying the highest market capitalisation ($352 billion) and index weighting (14.5%), reports its results next Tuesday (after the close) for further insight into where prices may move next.
In terms of the ECB rate decision next Thursday (July 24th), market expectations may currently be indicating that another rate cut is unlikely, although it could be a close call. Traders seem to be focusing on recent commentary from policymakers which suggests the balance of power for the time being has shifted to the more hawkish committee members, who have stated that with inflation sitting on the central bank's target of 2% there is no need to cut rates further. Choosing instead to wait for more clarity on the outcome of trade negotiations with the US, which could decide whether a trade war between the world's first and third biggest economies may be something they need to navigate.
Technical Update:
Having posted a new all-time high at 24639 on July 9th the German 40 index has entered a corrective period. However, while much will depend on future unknow market sentiment and price trends, traders may well be asking, if current price weakness can develop into a more extended phase of weakness, or if downside is just a limited move before buyers return to extend price strength.
Time will tell, but in the meantime, technical analysis may help pinpoint potential support and resistance levels, aiding us establish next potential trends and directional risks.
Potential Support:
Having recently posted a new all-time high at 24639, it might be argued this is still a possible positive trend, especially as the Bollinger mid-average is currently rising. This for Thursday stands at 23897, so may mark the first support focus for traders over coming sessions.
If closing breaks of this 23965 level materialise, it might lead towards a further phase of price weakness towards 23013, the June 19th session low, even 22406, the 38.2% Fibonacci retracement of April to July 2025 price strength.
Potential Resistance:
If the 23965 mid-average successfully holds the current price setback, it could possibly prompt further attempts to extend recent strength.
First resistance might then stand at 24282, equal to half latest weakness, with successful closing breaks possibly then opening scope back to the 24639 all-time high and maybe further, if this in turn gives way.
The material provided here has not been prepared accordance with legal requirements designed to promote the independence of investment research and as such is considered to be a marketing communication. Whilst it is not subject to any prohibition on dealing ahead of the dissemination of investment research, we will not seek to take any advantage before providing it to our clients.
Pepperstone doesn’t represent that the material provided here is accurate, current or complete, and therefore shouldn’t be relied upon as such. The information, whether from a third party or not, isn’t to be considered as a recommendation; or an offer to buy or sell; or the solicitation of an offer to buy or sell any security, financial product or instrument; or to participate in any particular trading strategy. It does not take into account readers’ financial situation or investment objectives. We advise any readers of this content to seek their own advice. Without the approval of Pepperstone, reproduction or redistribution of this information isn’t permitted.

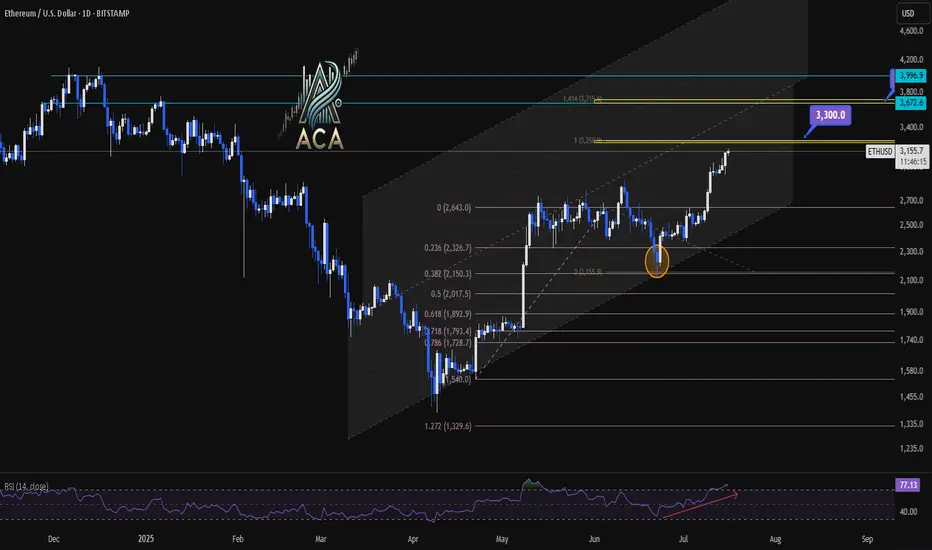
ETHUSDT 1D Chart Analysis | RSI Strength & Fibonacci TargetsETHUSDT 4H Chart Analysis | RSI Strength & Fibonacci Targets in Play
🔍 Let’s break down the latest ETH/USDT setup — bullish momentum is building with confluences pointing toward key upside targets.
⏳ 4-Hour Overview
Ether continues climbing within a well-defined ascending channel, with recent candles holding above mid-level support. Price is pressing higher from a clean bounce at the 0.5 and 0.618 Fibonacci retracement zone ($2,017–$1,899), signaling the correction has likely ended.
📉 Fibonacci Levels & RSI Confirmation
- The strong recovery aligns with rising volume and a bullish structure.
- RSI is pushing into overbought territory (above 73), often a sign of strength during trends—not exhaustion.
- ETH is now positioned for a breakout continuation move if momentum holds.
🎯 Bullish Targets Ahead
- Immediate resistance: $3,300 (1.414 Fib extension + historical supply)
- Next major target: $3,700 (1.618 extension + upper channel confluence)
- Pullback zones: $2,950 (mid-channel) and $2,017 (Fib support base)
📊 Key Highlights:
- Price is respecting the rising channel structure — higher lows, higher highs in play.
- Volume supports the breakout narrative, rising on green candles.
- RSI breakout supports trend continuation, not exhaustion.
- Targets at $3,300 and $3,700 remain actionable on a confirmed breakout.
🚨 Conclusion:
ETH is showing a multi-variable bullish setup with clear continuation potential. A strong move above $3,300 could quickly send price toward $3,700. Pullbacks to $2,950–$2,017 could offer high-risk/reward re-entry zones. Momentum favors bulls — stay alert.