Weekly Volatility SnapshotGood Morning -- ☀️☀️☀️
What an amazing last full week of June that was as we pulled out of corrective territory and onto new ATHs with the SP:SPX body of its weekly candle moving +3.41% -- bottom to top. The weekly move open-to-close was +$98.40 as that is how I gauge my volatility metrics. This in comparison is closest in value to IV entering the week as it was stating an implied move of +/-$102.08, which was a volatility read of 16.34% -- As you see in reflection of the weekly chart below and within daily candle structure, price action moved upwards all week surpassing quarterly marks. This in turn is raising short-term volatility and lowering monthly averages as we rotate higher.
Here is the weekly price action of the TVC:VIX from a 5m perspective. This is showing the EOW trend break upwards drilling the indices back down -- A healthy pullback after being seemingly over-extended. This happened during the news cycle release of the U.S. and Canada reciprocal tariff disagreement. Hopefully this settles over the weekend and we rotate higher into the 4th of July week.
Now looking towards this holiday week -- We have the SP:SPX IV (13.29%) after melting during the ATHs move previously -3.09% -- This places IV on the sliding yearly spectrum at the 39% down range showing increasing discount in yearly value. Remember, If you form option positions IV affects VEGA 1% at a time and the algos bid down IV in contracting markets as they rotate higher. HV10 (12.46%) has hinged down and still is contractive per IV prediction but, increasing in comparison with a ' strength of IV ' now showing 94% entering this week.
As the TVC:VIX has closed at $16.32 -- I believe that there is still a little room to extend potentially upwards to the HV10 weekly range of $6253.59. Currently, the SP:SPX YTD return is +4.96% with weekly momentum pointing up and room for volatility to still decrease. If this mark is reached it would put the YTD return at +6.52%. Very feasible and realistic being halfway through the year and going into the 4th of July 🇺🇸🇺🇸🇺🇸🇺🇸 Watch as we climb the wall of worries around us. This would in turn decrease short-term volatility more maybe even to a bottoming point and IV would melt during the rotation upwards with the VIX slowly grinding down.
Come back next week as we review what happened within the implied ranges posted and overlook the volatility potentially bottoming and looking towards a VIX spike in the near future.
Remember to know your ABCs and stay hedged against your bias! CHEERS!
Volatility

Nat Gas; Dip then RipA slight breather as expected for NG prices after such a strong reversal, from the storage report lows on 6/27/2025. Support for NG based on volume looks to be in the $3.55 to $3.65 range, before continuing a move up to $4+. NYMEX:NG1!

Pre-Earnings Breakout in Financials?Financials could be attempting a breakout, two weeks before the sector kicks off earnings season.
The first pattern on today’s chart of the SPDR Select Sector Financial ETF is the price level around $52. XLF stalled at that zone in February after peaking about 1 percent below it in November. February 28’s final price of $52.18 could be especially important because it represented the highest weekly close.
The fund broke above it on Monday and remaining here could represent a potentially more significant breakout.
Second is the narrow price range between mid-May and late June. (Notice the tightening Bollinger Band Width.) Could that period of price compression open the door to price expansion?
Third, the 8-day exponential moving average (EMA) is above the 21-day EMA. MACD is also rising. Those signals may reflect short-term bullishness.
Next, the steadily rising 200-day simple moving average may reflect long-term bullishness.
Finally, the calendar may be a factor because Wells Fargo reports earnings on Monday, July 14. Citi, JPMorgan Chase, Bank of America and others follow later in the week.
Standardized Performances for the ETF mentioned above:
SPDR Select Sector Financial ETF (XLF)
1-year: +27.39%
5-years: +126.32%
10-year: +164.49%
(As of June 30, 2025)
Exchange Traded Funds ("ETFs") are subject to management fees and other expenses. Before making investment decisions, investors should carefully read information found in the prospectus or summary prospectus, if available, including investment objectives, risks, charges, and expenses. Click here to find the prospectus.
TradeStation has, for decades, advanced the trading industry, providing access to stocks, options and futures. If you're born to trade, we could be for you. See our Overview for more.
Past performance, whether actual or indicated by historical tests of strategies, is no guarantee of future performance or success. There is a possibility that you may sustain a loss equal to or greater than your entire investment regardless of which asset class you trade (equities, options or futures); therefore, you should not invest or risk money that you cannot afford to lose. Online trading is not suitable for all investors. View the document titled Characteristics and Risks of Standardized Options at www.TradeStation.com . Before trading any asset class, customers must read the relevant risk disclosure statements on www.TradeStation.com . System access and trade placement and execution may be delayed or fail due to market volatility and volume, quote delays, system and software errors, Internet traffic, outages and other factors.
Securities and futures trading is offered to self-directed customers by TradeStation Securities, Inc., a broker-dealer registered with the Securities and Exchange Commission and a futures commission merchant licensed with the Commodity Futures Trading Commission). TradeStation Securities is a member of the Financial Industry Regulatory Authority, the National Futures Association, and a number of exchanges.
TradeStation Securities, Inc. and TradeStation Technologies, Inc. are each wholly owned subsidiaries of TradeStation Group, Inc., both operating, and providing products and services, under the TradeStation brand and trademark. When applying for, or purchasing, accounts, subscriptions, products and services, it is important that you know which company you will be dealing with. Visit www.TradeStation.com for further important information explaining what this means.

NQ Power Range Report with FIB Ext - 7/2/2025 SessionCME_MINI:NQU2025
- PR High: 22723.00
- PR Low: 22683.00
- NZ Spread: 89.5
Key scheduled economic events:
08:15 | ADP Nonfarm Employment Change
10:30 | Crude Oil Inventories
Session Open Stats (As of 12:25 AM 7/2)
- Session Open ATR: 328.85
- Volume: 20K
- Open Int: 265K
- Trend Grade: Neutral
- From BA ATH: -0.8% (Rounded)
Key Levels (Rounded - Think of these as ranges)
- Long: 23239
- Mid: 21525
- Short: 20383
Keep in mind this is not speculation or a prediction. Only a report of the Power Range with Fib extensions for target hunting. Do your DD! You determine your risk tolerance. You are fully capable of making your own decisions.
BA: Back Adjusted
BuZ/BeZ: Bull Zone / Bear Zone
NZ: Neutral Zone

NQ Power Range Report with FIB Ext - 7/1/2025 SessionCME_MINI:NQU2025
- PR High: 22886.75
- PR Low: 22852.50
- NZ Spread: 76.75
Key scheduled economic events:
09:30 | Fed Chair Powell Speaks
09:45 | S&P Global Manufacturing PMI
10:00 | ISM Manufacturing PMI
- ISM Manufacturing Services
- JOLTs Job Openings
Holding in ATH range
Session Open Stats (As of 12:45 AM 7/1)
- Session Open ATR: 329.32
- Volume: 21K
- Open Int: 269K
- Trend Grade: Neutral
- From BA ATH: -0.1% (Rounded)
Key Levels (Rounded - Think of these as ranges)
- Long: 23239
- Mid: 21525
- Short: 20383
Keep in mind this is not speculation or a prediction. Only a report of the Power Range with Fib extensions for target hunting. Do your DD! You determine your risk tolerance. You are fully capable of making your own decisions.
BA: Back Adjusted
BuZ/BeZ: Bull Zone / Bear Zone
NZ: Neutral Zone

NQ Power Range Report with FIB Ext - 6/30/2025 SessionCME_MINI:NQU2025
- PR High: 22842.50
- PR Low: 22751.50
- NZ Spread: 202.75
Key scheduled economic events:
09:45 | Chicago PMI
Weekend volatility taking auction into new ATHs
Session Open Stats (As of 12:45 AM 6/30)
- Session Open ATR: 345.85
- Volume: 33K
- Open Int: 261K
- Trend Grade: Neutral
- From BA ATH: +0.1% (Rounded)
Key Levels (Rounded - Think of these as ranges)
- Long: 23239
- Mid: 21525
- Short: 20383
Keep in mind this is not speculation or a prediction. Only a report of the Power Range with Fib extensions for target hunting. Do your DD! You determine your risk tolerance. You are fully capable of making your own decisions.
BA: Back Adjusted
BuZ/BeZ: Bull Zone / Bear Zone
NZ: Neutral Zone

Trading the Impulse Rally Retracement — Price and Time Symmetry The Stop Loss Triangle is back!
This time with BITSTAMP:BTCUSD coming off its recent impulse rally. For those of you that aren’t familiar with my strategy — let me start from the beginning…
This concept involves positioning against the opposing decline in price and time as a precursor to our theoretical projection. If the underlying enters our predetermined faded cross-section, the stop loss is triggered to prevent sideways consolidation and the erosion of contract premiums or leverage decay.
This inherently ‘sclene’ triangle is constructed by drawing a straight trend line through the bottoming reversal candle and the furthest projection in price and time symmetry (78.6%) of the retracement. Once connected, draw a vertically positioned straight line from the highest or lowest point in the previously identified retracement to the bottom reversal candle area once again. To create a ‘right triangle’, now turn 90 degrees towards the final point, which is determined by the nearest projection in price and time symmetry (38.2%). This allows time after the imposed price and time date, yet not enough for premium or leverage decay to become significant.
In its entirety, this forms the stop loss triangle.
I encourage my followers to identify and explore the system on their own. As always, feel free to ask me anything related to it. We’ll follow along and you’ll be amazed at the precision of Fibonacci symmetry.
CHEERS

$IREN Weekly Bb expansion + SMA bullish alignmentNASDAQ:IREN Weekly bollingers have only looked this sharply expansionary a couple times in history.
Weekly SMA total bullish alignment has likewise also happened a couple times in its history.
But this time the bullish cross confluence will happen from much higher levels with a much stronger fundamental position from an execution risk and near term catalyst standpoint.

Weekly Volatility SnapshotGood Morning --
I hope everyone had a good week of trading ranges -- although short, we saw some VOLATILITY .
Here we will step back with the year-to-date TVC:VIX in the background as we look towards a fresh week trading within the broader market ranges.
Let us begin --
Last week the S&P500 -- with the SP:SPX gapped up opening into strength of a short week at $6,007.46 and wicking up to $6,050.83 only to sell off during U.S. wartime engagement threats within the news cycle, closing the weeks range at $5,984.57. This provided a move of $96.96 and is most comparative to what IV (16.18%) stated entering last week -- that was predicting a range of +/- $101.24.
Now, looking towards this week -- IV (16.34%) is nearly unchanged as HV10 (9.75%) is showing a 'strength of IV' lowering at only 60% currently. IV within the yearly spectrum sits with an IVp of 74% -- fairly expensive as this can show the majority of money is spending up to protect downside uncertainties.
Understandable of course.
Our long-term trending volatility of HV63 (30.25%) is showing a 'strength of IV' at 185% which is correlating to an implied move of +/- $188.98 for the week. This is an advantage if reached of $86.90 over stated IV. A massive premium capture potential.
With the MACRO news cycle pointing EXTREMELY NEGATIVE, I will be watching for volatility expansion. I believe futures will open up gapping into quarterly marks -- this is just my humble opinion of course.
I see the opposite of last week happening, where we gap down and run up into the week. I don't hold a swing position, just an observation that psychologically retail will flip bearish on wartime news with a massive gap down, only to get trapped as broader markets expand upwards into the week.
That's all for now. Everyone have a good week trading ranges, and I will see you Saturday to review! As always, know you ABCs and stay hedged for whatever your bias may be!
CHEERS

Sharing the advanced Bollinger Bands strategyHere are the Bollinger Band trading tips: *
📌 If you break above the upper band and then drop back down through it, confirm a short signal!
📌 If you drop below the lower band and then move back up through it, confirm a long signal!
📌 If you continue to drop below the middle band, add to your short position; if you break above the middle band, add to your long position!
Pretty straightforward, right? This means you won’t be waiting for the middle band to signal before acting; you’ll be ahead of the game, capturing market turning points!
Let’s break it down with some examples:
1. When Bitcoin breaks above the upper Bollinger Band, it looks strong, but quickly drops back below:
➡️ That’s a “bull trap”—time to go short!
2. If Bitcoin crashes below the lower band and then pops back up:
➡️ Bears are running out of steam—time to go long and grab that rebound!
3. If the price keeps moving above the middle band:
➡️ Add to your long or short positions to ride the trend without being greedy or hesitant.
Why is this method powerful?
It combines “edge recognition + trend confirmation” for double protection:
1. Edge Recognition—spot the turning point and act early.
2. Trend Confirmation—wait for the middle band breakout and then confidently add positions!
You won’t be reacting after the fact; you’ll be ahead of the curve, increasing your positions in the trend’s middle and locking in profits at the end. This is the rhythm of professional traders and the core logic of systematic profits!
Who is this method for?
- You want precise entry and exit points.
- You’re tired of “chasing highs and cutting losses.”
- You want a clear, executable trading system.
- You want to go from “I see the chart but don’t act” to “I see the signal and take action.”
Follow for more. Make sure to like this if you found it useful.

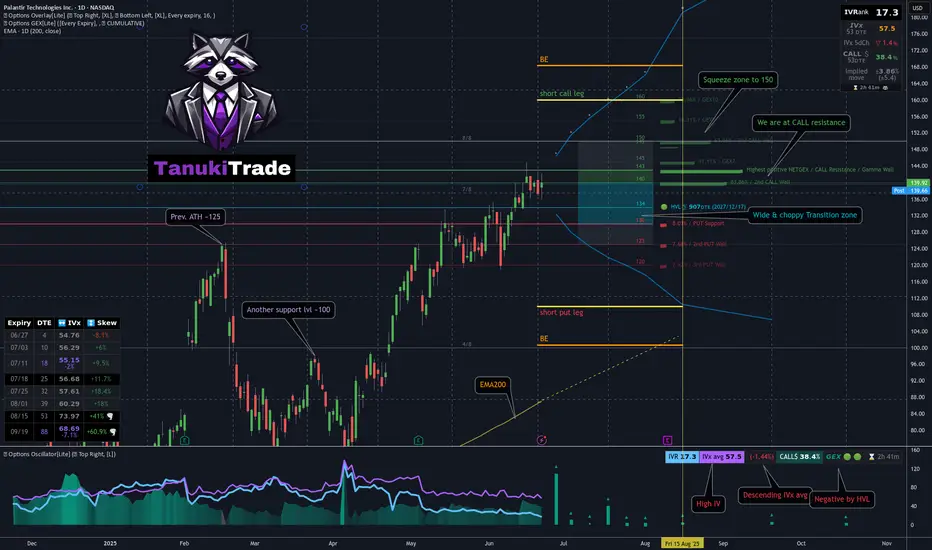
Jade Lizard on PLTR - My 53DTE Summer Theta PlayMany of you — and yes, I see you in my DMs 😄 — are trading PLTR, whether using LEAPS, wheeling, or covered calls.
I took a closer look. And guess what?
📈 After a strong move higher, PLTR was rejected right at the $143 call wall — pretty much all cumulative expiries cluster resistance there
Using the GEX Profile indicator, scanning all expirations:
After a brief dip, the market is repositioning bullish
Squeeze zone extends up to 150
The most distant GEX level is sitting at 160
On the downside, 130 is firm support, with some presence even at 120 — the market isn’t pricing in much risk below that
📉 From a technical standpoint:
We’re near all-time highs
125 (previous ATH) and 100 are key support levels
The OTM delta curve through August is wide, and the call side is paying well — with a current call pricing skew
🔬 IVx is at 57, trending lower + call pricing skew📉 IV Rank isn't particularly high, but the directional IVx matters more here
💡 Summer Theta Play: Jade Lizard on PLTR
Since I’ll be traveling this summer and don’t want to micromanage trades, I looked for something low-touch and high-confidence — and revisited an old favorite: the Jade Lizard.
If you're not familiar with the strategy, I recommend checking out Tastytrade's links and videos on Jade Lizards.
🔹 Why this setup?
Breakeven sits near $100, even with no management
On TastyTrade margin:~$1800 initial margin ~$830 max profit
53 DTE — plenty of time for theta to work
Earnings hit in August — I plan to close before then
Covers all bullish GEX resistance zones
Quickly turns profitable if IV doesn’t spike
Highly adjustable if needed
My conclusion: this strategy covers a much broader range than what the current GEX Profile shows across all expirations — so by my standards, I consider this to be a relatively lower-risk setup compared to most other symbols right now with similar theta strategies.
🔧 How would I adjust if needed?
If price moves up:
I’d roll the short put up to collect additional credit
Hold the call vertical as long as the curve supports it
If price drops:
Transition into a put ratio spread
Either extend or remove the call vertical depending on conditions
🛑 What’s the cut loss plan?
I have about 20% wiggle room on the upside, so I’m not too worried — but if price rips through 160 quickly, I’ll have to consider early closure.
If that happens, the decision depends on time:
If late in the cycle with low DTE:→ Take a small loss & roll out to next month for credit
If early with lots of DTE remaining:→ Consider converting to a butterfly, pushing out the call vertical for a small debit→ Offset this with credit from rolling the put upward
As always — stay sharp, manage your risk, and may the profit be with you.
See you next week!– Greg @ TanukiTrade
NQ Power Range Report with FIB Ext - 6/27/2025 SessionCME_MINI:NQU2025
- PR High: 22713.50
- PR Low: 22669.25
- NZ Spread: 98.75
Key scheduled economic events:
08:30 | Core PCE Price Index (YoY|MoM)
Session Open Stats (As of 12:35 AM 6/27)
- Session Open ATR: 348.99
- Volume: 21K
- Open Int: 260K
- Trend Grade: Neutral
- From BA ATH: -1.7% (Rounded)
Key Levels (Rounded - Think of these as ranges)
- Long: 23239
- Mid: 21525
- Short: 20383
Keep in mind this is not speculation or a prediction. Only a report of the Power Range with Fib extensions for target hunting. Do your DD! You determine your risk tolerance. You are fully capable of making your own decisions.
BA: Back Adjusted
BuZ/BeZ: Bull Zone / Bear Zone
NZ: Neutral Zone
Keep in mind this is not speculation or a prediction. Only a report of the Power Range with Fib extensions for target hunting. Do your DD! You determine your risk tolerance. You are fully capable of making your own decisions.
BA: Back Adjusted
BuZ/BeZ: Bull Zone / Bear Zone
NZ: Neutral Zone

Possible Long ???It has broke the triangle pattern and trying to move higher, possibility to reach new higher highs.

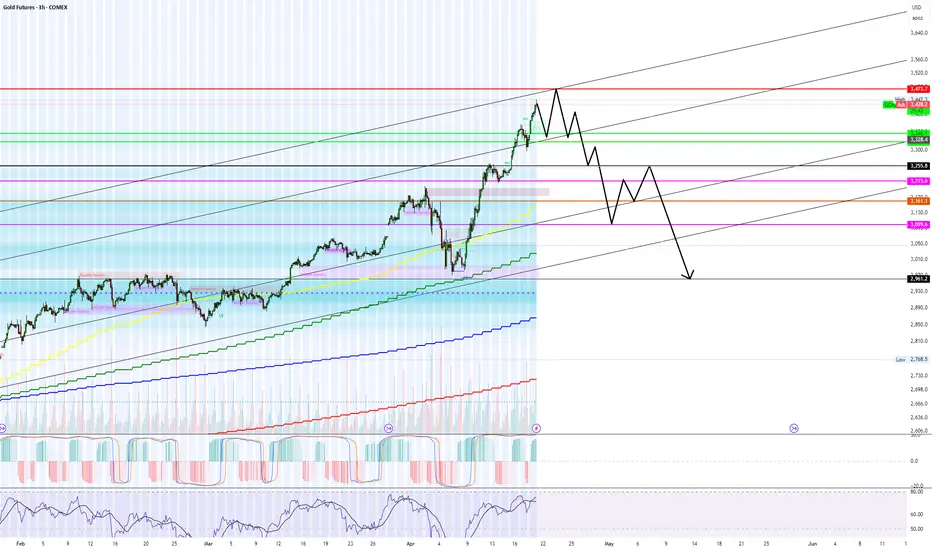
Agree to disagree... Gold is topping right now.My price path seen above is a complete guess but it stems from long term trend lines and more importantly order flow from last week.
On Thursday there was a #1 trade on AMEX:PHYS for $200+ Million at the green levels in my chart above (Equivalent levels). PRICE WILL 100% go to my green lines by end of this week 04/25.
We are over shooting the dark pool sale but a lot, however, this is always to trap retail and create fomo/peak fear.
In the correction/recession cycles, gold ALWAYS TOPS LAST before the crash...
NQ Power Range Report with FIB Ext - 6/26/2025 SessionCME_MINI:NQU2025
- PR High: 22488.25
- PR Low: 22450.25
- NZ Spread: 85.0
Key scheduled economic events:
08:30 | Initial Jobless Claims
GDP
Durable Goods Orders
Session Open Stats (As of 12:25 AM 6/26)
- Session Open ATR: 358.17
- Volume: 20K
- Open Int: 252K
- Trend Grade: Neutral
- From BA ATH: -1.7% (Rounded)
Key Levels (Rounded - Think of these as ranges)
- Long: 22667
- Mid: 21525
- Short: 20383
Keep in mind this is not speculation or a prediction. Only a report of the Power Range with Fib extensions for target hunting. Do your DD! You determine your risk tolerance. You are fully capable of making your own decisions.
BA: Back Adjusted
BuZ/BeZ: Bull Zone / Bear Zone
NZ: Neutral Zone

NQ Power Range Report with FIB Ext - 6/25/2025 SessionCME_MINI:NQU2025
- PR High: 22412.00
- PR Low: 22384.50
- NZ Spread: 61.5
Key scheduled economic events:
10:00 | Fed Chair Powell Testifies
- New Home Sales
10:30 | Crude Oil Inventories
Session Open Stats (As of 12:35 AM 6/25)
- Session Open ATR: 372.52
- Volume: 18K
- Open Int: 253K
- Trend Grade: Neutral
- From BA ATH: -1.9% (Rounded)
Key Levels (Rounded - Think of these as ranges)
- Long: 22667
- Mid: 21525
- Short: 20383
Keep in mind this is not speculation or a prediction. Only a report of the Power Range with Fib extensions for target hunting. Do your DD! You determine your risk tolerance. You are fully capable of making your own decisions.
BA: Back Adjusted
BuZ/BeZ: Bull Zone / Bear Zone
NZ: Neutral Zone

NQ Power Range Report with FIB Ext - 6/24/2025 SessionCME_MINI:NQU2025
- PR High: 22217.00
- PR Low: 22065.75
- NZ Spread: 337.75
Key scheduled economic events:
10:00 | CB Consumer Confidence
- Fed Chair Powell Testifies
Session Open Stats (As of 12:35 AM 6/24)
- Session Open ATR: 384.68
- Volume: 45K
- Open Int: 240K
- Trend Grade: Neutral
- From BA ATH: -2.8% (Rounded)
Key Levels (Rounded - Think of these as ranges)
- Long: 22096
- Mid: 20383
- Short: 19246
Keep in mind this is not speculation or a prediction. Only a report of the Power Range with Fib extensions for target hunting. Do your DD! You determine your risk tolerance. You are fully capable of making your own decisions.
BA: Back Adjusted
BuZ/BeZ: Bull Zone / Bear Zone
NZ: Neutral Zone

US 100 – Potential For Further Geo-Political Volatility AheadEarly trading this Monday morning has been dominated by President Trump's surprise weekend decision to launch airstrikes on three nuclear sites in Iran, which may increase the potential for a wider conflict in the Middle East.
After closing at 21,652 on Friday, this news led the US 100 to a gap open lower to 21,375 in early Asian trading, however, this drop didn't last long and the index has since recovered to trade back up to 21600 again at the time of writing (0800 BST).
Looking forward, the focus for traders may continue to be on Iran's next move. So far they have confined their retaliation to missile attacks on Israel, but they did issue a statement saying they reserve all options to defend themselves.
Fresh attacks on US bases in the region, or deciding to close the Strait of Hormuz, a vital shipping supply route for Oil and Gas from the region, may undermine risk sentiment which could lead to renewed selling of the US 100, while any options suggesting a potential quicker resolution to this conflict may be seized upon by traders to push the index back up to higher levels seen in the middle of last week.
There are scheduled events released across the week that may also be relevant, these include the testimony of Federal Reserve (Fed) Chairman Jerome Powell to congress at 1500 BST on Tuesday and Wednesday, as well as the next US PCE Index update at 1330 BST on Friday, which is the Fed's preferred inflation gauge.
Technical Update: Assessing Support and Resistance Levels
Escalation of hostilities in the middle east over the weekend may leave traders uncertain as to the direction of the next price activity for the US 100 moving forward.
However, technical analysis can help to outline potential support and resistance levels, which if broken to the up or downside, might offer clues on where the index may move.
Potential Support Levels:
Looking at the chart of the US 100 index below, it could be argued that Monday’s lower opening level has already tested what traders may be viewing as support at 21373. This level is equal to half the May 23rd to June 11th phase of price strength.
Having seen an initial recovery following tests of this 21373 level, it may now have been strengthened as a support focus. This means closing breaks below 21373, while not a guarantee of further price declines, may suggest tests of the next support at 20666, which is the May 23rd price low, even 20360, the 38% Fibonacci retracement level, could be possible.
Potential Resistance Levels:
In terms of resistance levels to monitor this week, as the chart shows, Friday’s activity did see a sell-off from its 21905 session high. This confirms sellers have been active at this level previously and may prove to be again.
As such, traders may now be watching the defence of this 21905 level on a closing basis, as breaks above this resistance may now be required to see attempts to push to higher levels which may include a challenge of resistance at 22074, the June 11th session upside extreme, possibly then 2226, the February 18th high.
The material provided here has not been prepared
accordance with legal requirements designed to promote the independence of investment research and as such is considered to be a marketing communication. Whilst it is not subject to any prohibition on dealing ahead of the dissemination of investment research, we will not seek to take any advantage before providing it to our clients.
Pepperstone doesn’t represent that the material provided here is accurate, current or complete, and therefore shouldn’t be relied upon as such. The information, whether from a third party or not, isn’t to be considered as a recommendation; or an offer to buy or sell; or the solicitation of an offer to buy or sell any security, financial product or instrument; or to participate in any particular trading strategy. It does not take into account readers’ financial situation or investment objectives. We advise any readers of this content to seek their own advice. Without the approval of Pepperstone, reproduction or redistribution of this information isn’t permitted.

Bank of America: Potential BreakoutBank of America squeezed into a range, and now it may be breaking out.
The first pattern on today’s chart is $44.84, the high on March 4 as the megabank gapped lower.
It spent more than a month pushing against that level while making higher lows. The resulting ascending triangle is a potentially bullish continuation pattern.
Second, BAC closed above the resistance on Friday and is now potentially entering the gap from March 4. Is a breakout underway?
Third, Bollinger Bandwidth has narrowed. That may create potential for prices to expand following a period of compression.
Next, the 8-day exponential moving average (EMA) has remained above the 21-day EMA. Prices have also held above their 200-day simple moving average. Those signals may reflect bullishness in the short and long terms.
Finally, BAC is an active underlier in the options market. Its 122,000 average daily contracts in the last month rank 23rd in the S&P 500, according to TradeStation data. That could help traders take positions with calls and puts.
Check out TradingView's The Leap competition sponsored by TradeStation.
TradeStation has, for decades, advanced the trading industry, providing access to stocks, options and futures. If you're born to trade, we could be for you. See our Overview for more.
Past performance, whether actual or indicated by historical tests of strategies, is no guarantee of future performance or success. There is a possibility that you may sustain a loss equal to or greater than your entire investment regardless of which asset class you trade (equities, options or futures); therefore, you should not invest or risk money that you cannot afford to lose. Online trading is not suitable for all investors. View the document titled Characteristics and Risks of Standardized Options at www.TradeStation.com . Before trading any asset class, customers must read the relevant risk disclosure statements on www.TradeStation.com . System access and trade placement and execution may be delayed or fail due to market volatility and volume, quote delays, system and software errors, Internet traffic, outages and other factors.
Securities and futures trading is offered to self-directed customers by TradeStation Securities, Inc., a broker-dealer registered with the Securities and Exchange Commission and a futures commission merchant licensed with the Commodity Futures Trading Commission). TradeStation Securities is a member of the Financial Industry Regulatory Authority, the National Futures Association, and a number of exchanges.
Options trading is not suitable for all investors. Your TradeStation Securities’ account application to trade options will be considered and approved or disapproved based on all relevant factors, including your trading experience. See www.TradeStation.com . Visit www.TradeStation.com for full details on the costs and fees associated with options.
Margin trading involves risks, and it is important that you fully understand those risks before trading on margin. The Margin Disclosure Statement outlines many of those risks, including that you can lose more funds than you deposit in your margin account; your brokerage firm can force the sale of securities in your account; your brokerage firm can sell your securities without contacting you; and you are not entitled to an extension of time on a margin call. Review the Margin Disclosure Statement at www.TradeStation.com .
TradeStation Securities, Inc. and TradeStation Technologies, Inc. are each wholly owned subsidiaries of TradeStation Group, Inc., both operating, and providing products and services, under the TradeStation brand and trademark. When applying for, or purchasing, accounts, subscriptions, products and services, it is important that you know which company you will be dealing with. Visit www.TradeStation.com for further important information explaining what this means.

NQ Power Range Report with FIB Ext - 6/23/2025 SessionCME_MINI:NQU2025
- PR High: 21787.00
- PR Low: 21566.75
- NZ Spread: 491.75
Key scheduled economic events:
09:45 | S&P Global Manufacturing PMI
- S&P Global Services PMI
10:00 | Existing Home Sales
Open weekend gap down ~0.33%
Session Open Stats (As of 12:45 AM 6/23)
- Session Open ATR: 382.81
- Volume: 38K
- Open Int: 234K
- Trend Grade: Neutral
- From BA ATH: -4.8% (Rounded)
Key Levels (Rounded - Think of these as ranges)
- Long: 22096
- Mid: 20383
- Short: 19246
Keep in mind this is not speculation or a prediction. Only a report of the Power Range with Fib extensions for target hunting. Do your DD! You determine your risk tolerance. You are fully capable of making your own decisions.
BA: Back Adjusted
BuZ/BeZ: Bull Zone / Bear Zone
NZ: Neutral Zone

Weekly Volatility Snapshot Good Evening -- Here we are again looking down the barrel of another week tracking the volatility within the broader markets!
Let us begin --
Last week, the TVC:VIX was trending down as the S&P500 rotated upwards making it within 1.43% of highs, before selling off on war conflict news to end the week -- spiking the VIX again. We are now 114 days into the correction with uncertainty still being the only thing that is defined.
However, it does seem that buyers are stepping in during these times of selling off. But, without lifting the uncertainty of trade deals and deadlines or negative news cycles, we could just be locking in a lower high and within another bear market phase.
As we trend into the 2nd half of June, the SP:SPX has an IV (16.18%) entering the week trending 72% to it's yearly range suggesting slightly expensive premium. This is up from 52% IVp last week. Now in comparison to what is happening, HV10 (9.94%) is showing a lower volatility range than stated IV by -6.24%.
This can be important when considering a premium disadvantage with a consolidating VIX under already expensive premium. The 'strength of IV' here is 61% -- and in turn my weighted implied ranges for the week are $5,914.78 - $6,039.16.
If there happens to be a volatility spike this week due to anything out of the blue, we will find our range expanded to long-term trending means of quarterly values, that being HV63 (30.39%). This would create a 'strength of IV' of 188% and a massive spike in the VIX -- respectfully these weighted implied ranges would be $5,786.82 - $6,161.12.
As always, I hope you enjoy the weekly write up and have a great week of trading ranges! Know you ABCs and REMEMBER stay hedged people.
Till next week, CHEERS.

Nvidia - Weekly Volatility SnapshotGood Afternoon! Let's talk NASDAQ:NVDA
Last week we saw HV10 (24.96%) increase above HV21 (23.67%) after starting what could be a regression towards HV63 (39.13%). IV (37.37%) entering this week reflects within 6% of it's sliding yearly lows and resonating around quarterly means. This could be showing a fair prediction to the regression potential and a volatility spike.
Here, the RSI has room but is elevated and hinged down with the MACD crossed red -- lagging indicators showing trend reversal. If bi-weekly values can find regression to quarterly; the implied range I would be watching is $135.47 - $148.47 with IV increasing affecting premium positively. If the grind up continues slowly, expect IV to melt and be watching for contracting HV10 ranges between $137.82 - $146.12 -- Keep an eye on the news, it will ever affect the broader markets and any underlying within.
Follow along through the week as we track our volatility prediction -- I will pull the charts back in at the end of the week to review!
CHEERS!

[06/16] Weekly GEX Roadmap - Diagonal Spreads or Put Hedges?📊 Weekly GEX Map (SPX)
This week’s GEX profile looks nearly identical to last week:
Positive bias above 6020 up to 6100
But a sticky chop zone remains from 5975 to 6020
Below 5950? That’s where things get interesting…
⚠️ What Happens If 5950 Fails?
In that case - welcome to negative gamma territory:
Delta becomes unstable → fast, erratic moves
Gamma loses influence → hedging effectiveness drops
Dealer hedging lags → market makers chase, not lead
Vega + theta distort readings → charm decay accelerates
Result:
GEX zones lose clarity.
Pinning breaks down.
Reactions become nonlinear and emotional.
If we drop below 5950, we might see acceleration instead of stabilization — despite the positive GEX profile.
💡 Trade Idea of the Week – With Caution
If not for Wednesday's macro risk (Fed rate decision), I'd suggest a bullish diagonal spread toward 6100–6150:
Limited downside
Defined risk
Covers the full squeeze zone
But with FOMC looming, I'd only hold this trade until Thursday and close once the debit doubles or earlier.
🧨 Macro + Geo Risks
Fed is priced for “no move” → any surprise = volatility spike
Rising tensions with Iran → oil and futures could react violently
Recommendation : Avoid OIL this week, especially futures and naked strategies
🛡️ Prefer Downside Protection?
If you expect weakness on SPX weekly:
Consider a put debit spread with the short leg at 5950, where the second strongest Put Support sits.
This type of structure can offer up to 6:1 reward-to-risk, making it one of the most efficient bearish hedges for this week.
If you enjoyed the above breakdown, feel free to check out my previous weekly analyses or explore my tools as well.
Until next time – Trade what you see, not what you hope,
– Greg @ TanukiTrade
