[06/16] Weekly GEX Roadmap - Diagonal Spreads or Put Hedges?📊 Weekly GEX Map (SPX)
This week’s GEX profile looks nearly identical to last week:
Positive bias above 6020 up to 6100
But a sticky chop zone remains from 5975 to 6020
Below 5950? That’s where things get interesting…
⚠️ What Happens If 5950 Fails?
In that case - welcome to negative gamma territory:
Delta becomes unstable → fast, erratic moves
Gamma loses influence → hedging effectiveness drops
Dealer hedging lags → market makers chase, not lead
Vega + theta distort readings → charm decay accelerates
Result:
GEX zones lose clarity.
Pinning breaks down.
Reactions become nonlinear and emotional.
If we drop below 5950, we might see acceleration instead of stabilization — despite the positive GEX profile.
💡 Trade Idea of the Week – With Caution
If not for Wednesday's macro risk (Fed rate decision), I'd suggest a bullish diagonal spread toward 6100–6150:
Limited downside
Defined risk
Covers the full squeeze zone
But with FOMC looming, I'd only hold this trade until Thursday and close once the debit doubles or earlier.
🧨 Macro + Geo Risks
Fed is priced for “no move” → any surprise = volatility spike
Rising tensions with Iran → oil and futures could react violently
Recommendation : Avoid OIL this week, especially futures and naked strategies
🛡️ Prefer Downside Protection?
If you expect weakness on SPX weekly:
Consider a put debit spread with the short leg at 5950, where the second strongest Put Support sits.
This type of structure can offer up to 6:1 reward-to-risk, making it one of the most efficient bearish hedges for this week.
If you enjoyed the above breakdown, feel free to check out my previous weekly analyses or explore my tools as well.
Until next time – Trade what you see, not what you hope,
– Greg @ TanukiTrade
Volatility

NQ Power Range Report with FIB Ext - 6/20/2025 SessionCME_MINI:NQU2025
- PR High: 21930.25
- PR Low: 21745.75
- NZ Spread: 412.0
Key scheduled economic events:
08:30 | Philadelphia Fed Manufacturing Index
Session Open Stats (As of 1:05 AM 6/20)
- Session Open ATR: 377.21
- Volume: 155K
- Open Int: 230K
- Trend Grade: Neutral
- From BA ATH: -4.2% (Rounded)
Key Levels (Rounded - Think of these as ranges)
- Long: 22096
- Mid: 20383
- Short: 19246
Keep in mind this is not speculation or a prediction. Only a report of the Power Range with Fib extensions for target hunting. Do your DD! You determine your risk tolerance. You are fully capable of making your own decisions.
BA: Back Adjusted
BuZ/BeZ: Bull Zone / Bear Zone
NZ: Neutral Zone

German 40 Index – Sentiment Facing a Sterm TestSince hitting its most recent all time high of 24469 on June 5th the Germany 40 index has experienced some downside pressure as traders have moved to lock in profits on a very strong start to the year. This move has the potential to turn June into the worst monthly performance of 2025 so far, although there is still another 8 trading days to go.
This short-term shift in sentiment has been related to a combination of factors. The new all time high of 24469 hit on June 5th coincided with the latest ECB interest rate cut. However, at that meeting Madame Lagarde indicated in the press conference that more data on the path of inflation, trade tariffs with the US and Eurozone growth would be required before the ECB would consider cutting interest rates again.
This was followed by comments and headlines which suggested that progress on a trade deal between the US and EU was slow and would potentially continue past the original July 9th pause deadline set by President Trump.
Then in the last week sentiment has been rocked further by the spike in Oil prices driven by an escalating conflict between Israel and Iran that has seen them trade missile attacks for 7 straight days, alongside a growing concern that the US may also be seriously considering entering a direct conflict with Iran after Bloomberg reported yesterday that senior US officials are preparing for a possible strike in the coming days.
At the time of writing (0700 BST) this leaves the Germany 40 trading at 1 month lows around 23142 and suggests a consideration of the technical outlook, including potential support and resistance levels could be useful.
Technical Update: Watching 23235 Last Correction Low
Having posted a new all-time high on June 5th at 24469, a more extended price correction has developed in the Germany 40 index. Interestingly, as the chart below shows, this phase of weakness has seen closing breaks under what some might have anticipated would be support, marked by the Bollinger mid-average (currently 23862).
In previous reports, we have suggested that traders may use the Bollinger mid-average as an indicator of the possible direction of the current price trend. If the mid-average is rising with prices above it, the trend may be classed as an uptrend, while if the mid-average is falling with price activity below it, a downtrend might be in place.
As the chart shows, following the latest breaks below the mid-average, this has now turned lower, and traders might now be focusing on the possibilities for an extended phase of price weakness.
Let's consider the possible support or resistance levels that could be worthwhile for traders to focus on.
Potential Support Levels:
With Thursday’s initial price activity so far seeing further selling pressure, as the chart below shows, it might be suggested the next relevant support is already currently being tested with moves below 23235. This level is equal to the last correction low posted on May 23rd at 23235.
Traders might now be watching how this 23235 low support is defended on a closing basis over coming sessions, as confirmed breaks lower, while no guarantee of deeper price declines, might skew risks towards tests of the next potential support at 22303, which is equal to the 38.2% retracement of April 7th to June 5th strength.
Potential Resistance Levels:
Since the June 5th all-time high, an extended decline in price has already been seen, so a reactive recovery might be a possibility. However, having recently seen the mid-average turn lower, closing breaks back above its current 23862 level might now be required to trigger a phase of price recovery.
While much will depend on future price trends and market sentiment, if successful upside breaks above the 23862 mid-average are seen, it might lead to tests of 24469 which is the June 5th all-time high.
The material provided here has not been prepared accordance with legal requirements designed to promote the independence of investment research and as such is considered to be a marketing communication. Whilst it is not subject to any prohibition on dealing ahead of the dissemination of investment research, we will not seek to take any advantage before providing it to our clients.
Pepperstone doesn’t represent that the material provided here is accurate, current or complete, and therefore shouldn’t be relied upon as such. The information, whether from a third party or not, isn’t to be considered as a recommendation; or an offer to buy or sell; or the solicitation of an offer to buy or sell any security, financial product or instrument; or to participate in any particular trading strategy. It does not take into account readers’ financial situation or investment objectives. We advise any readers of this content to seek their own advice. Without the approval of Pepperstone, reproduction or redistribution of this information isn’t permitted.

Wyke of Gold ZoneHey guys as we can see we have a super breakout from the sideways phase and now with the retest we go Liq hunting :D

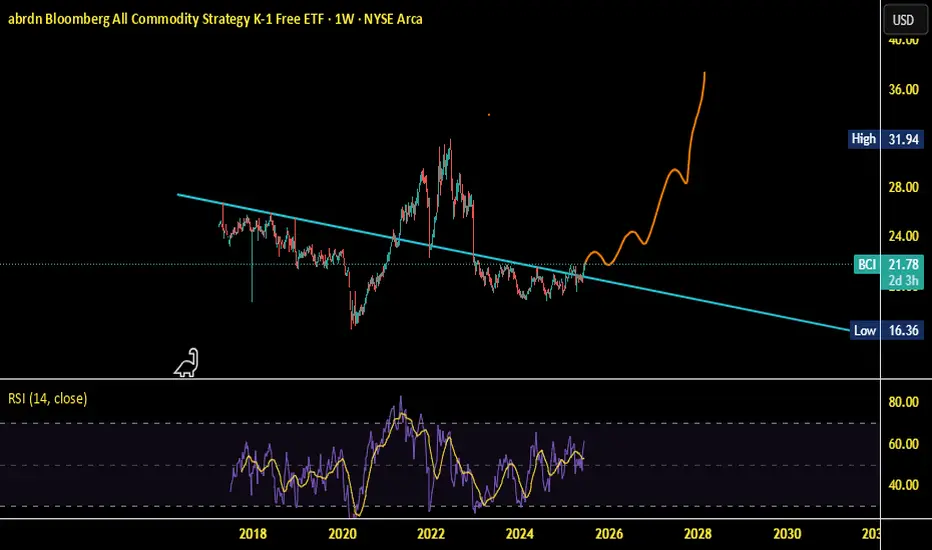
BCI Commodities Bull CycleThere is a strong supply line that is being broken by the chart, above this line there appears to be high volatility, which is also matching up with tensions in the Middle East in regards to Crude prices. Perhaps the move is equities to commodities soon.
Best Free Volatility Indicator on TradingView for Gold Forex
This free technical indicator will help you easily measure the market volatility on Forex, Gold or any other market.
It will show you when the market is quiet , when it's active and when it's dangerous .
We will go through the settings of this indicator, and you will learn how to set it up on TradingView.
Historical Volatility Indicator
This technical indicator is called Historical Volatility.
It is absolutely free and available on TradingView, MetaTrader 4/5 and other popular trading terminals.
TradingView Setup
Let me show you how to find it on TradingView and add it to your price chart.
Open a technical price chart on TradingView and open the "Indicators" menu (you will find it at the top of the screen).
Search "Historical Volatility" and click on it.
It will automatically appear on your chart.
"Length" parameter will define how many candles the indicator will take for measuring the average volatility. (I recommend keeping the default number, but if you need longer/shorter-term volatility, you can play with that)
Timeframe drop-down list defines what time frame the indicator takes for measuring the volatility. (I recommend choosing a daily timeframe)
And keep the checkboxes unchanged .
How to Use the Indicator
Now, let me show you how to use it properly.
Wider the indicator and analyse its movement at least for the last 4 months.
Find the volatility range - its low levels will be based on the lower boundary of the range, high levels will be based on its upper boundary.
This is an example of such a range on USDCAD pair.
When the volatility stays within the range, it is your safe time to trade.
When volatility approaches its lows, it may indicate that the market might be slow .
Highs of the range imply that the market is very active
In-between will mean a healthy market.
The Extremes
The violation of a volatility range to the downside is the signal that the market is very slow . This would be the recommended period to not trade because of high chance of occurrence of fakeouts.
An upward breakout of a voliatlity range is the signal of the extreme volatility . It will signify that the market is unstable , and it will be better to let it calm down before placing any trade.
Volatility Analysis
That is how a complete volatility analysis should look.
At the moment, volatility reached extreme levels on CADJPY pair.
The best strategy will be to wait till it returns within the range.
Remember This
With the current geopolitical uncertainty and trade wars, market volatility reaches the extreme levels.
Such a volatility is very dangerous , especially for newbie traders.
Historical volatility technical indicator will help you to easily spot the best period for trading and the moment when it is better to stay away.
❤️Please, support my work with like, thank you!❤️
I am part of Trade Nation's Influencer program and receive a monthly fee for using their TradingView charts in my analysis.

Trading the VIX – Part 2Trading the VIX – Part 2: VIX ETPs and Strategic Applications
In Part 1 of this series, we explored the structure of VIX Futures, focusing on the roll-down effect in a contango VIX futures curve—common in calm market conditions.
In Part 2, we turn our attention to VIX-related Exchange-Traded Products (ETPs)—specifically, the popular and liquid:
• VXX – unleveraged long VIX ETP
• UVXY – leveraged long VIX ETP
• SVXY – inverse VIX ETP
Each of these products is based on a specific VIX futures strategy, the “S&P500 VIX Short Term Futures Index” , which is maintained by S&P, Dow Jones (the “SPDJ-Index”). The Fact Sheet and Methodology can be obtained from the S&P Global website.
What is the SPDJ Index that these ETPs track?
The SPDJ-Index is a strategy index that maintains a rolling long position in the first- and second-month VIX futures to maintain a constant 30-day weighted average maturity.
Key Features of the SPDJ Index:
• Starts with 100% exposure to VX1 (the front-month future) when it’s 30 days from expiration.
• Gradually it rolls from VX1 to VX2 (next-month future) each day to maintain a 30-day average expiration.
• At all times, the index is long either one or both VX1 and VX2, with exposure shifting daily from VX1 to VX2.
• This roll mechanism causes value erosion in contango (normal markets) and gains in backwardation (during volatility spikes).
• Since contango is the dominant market state, the index loses value over time—with occasional short-lived gains during sharp volatility increases.
Importantly, the SPDJ Index does not represent the VIX or any other volatility level, it simply reflects the value of this futures-based rolling strategy.
________________________________________
Breakdown of the ETPs: VXX, UVXY, and SVXY
VXX – Long SPDJ Index (1x)
• Tracks the SPDJ Index directly
• Suffers from the roll-down drag in contango environments.
• Useful only for short-term exposure during expected volatility spikes.
• Timing for long positions is critical
UVXY – Leveraged Long (Currently +1.5x)
• Replicates a strategy that maintains a constant leverage of 1.5 to the SPDJ Index.
• Formerly +2x leverage; reduced in April 2024.
• Highly sensitive to VIX moves; underperforms long term due to both roll-down drag and leverage decay (see below). Timing for long positions is even more important than for the VXX.
SVXY – Inverse (-0.5x)
• Replicates a strategy that maintains a constant exposure of -0.5 to the SPDJ Index.
• Benefits from falling VIX levels as well as from contango in the front part of the VIX futures curve.
• Formerly -1x before the Feb 2018 volatility spike triggered massive losses (XIV, a competing ETP, collapsed at that time).
• Performs well in calm conditions but is vulnerable to sharp volatility spikes.
Leveraged & Inverse ETPs – Important Notes affecting the UVXY and SVXY (without going into details):
• Daily resetting for the replicating strategies to maintain constant exposure factors (different from 1x) are pro-cyclical and can cause compounding errors, specifically in turbulent markets (e.g. Feb 2018).
• The real volatility of the VIX futures itself acts as a drag on returns, independent of the index’s direction.
• Risk management is essential—especially with inverse products like SVXY.
All three of these ETPs track a VIX futures strategy, they are not levered or unlevered versions of the original VIX index. Each of these ETPs benefits from liquid option markets, enhancing the toolkit for volatility trading.
Trading Strategies Using VIX ETPs
Here are several practical approaches to trading these products:
VXX and UVXY
• Best used for short-term trades aiming to capture volatility spikes.
• Options strategies such as zero-cost collars, vertical and calendar spreads can help mitigate the challenge of precise timing.
• Avoid long-term holds due to erosion from roll-down and leverage decay (see historical performance!).
SVXY – The Carry Trade Proxy
• Ideal for profiting from prolonged calm periods and the contango structure.
• Acts like a carry trade, offering a positive drift—but must be paired with robust stop-loss rules or exit strategy to guard against sharp spikes in volatility.
Switching Strategies
• Tactically rotate in/out of SVXY based on short-term volatility indicators.
• One common signal: VIX9D crossing above or below VIX, i.e. long SVXY if VIX9D crosses under VIX, staying long while VIX9D < VIX, closing long SVXY position when VIX9D crosses over VIX. Some traders also use crossovers with VIX3M or the individual expirations of the VIX futures curve to manage entries.
• Switching between SVXY and VXX based on crossover triggers through the VIX futures curve is often advertised, but very hard to get working in practice due to the importance of timing the VXX entry and exit – signals from the VIX curve may not signal VXX entries and exits timely enough.
Term Structure-Based Combinations
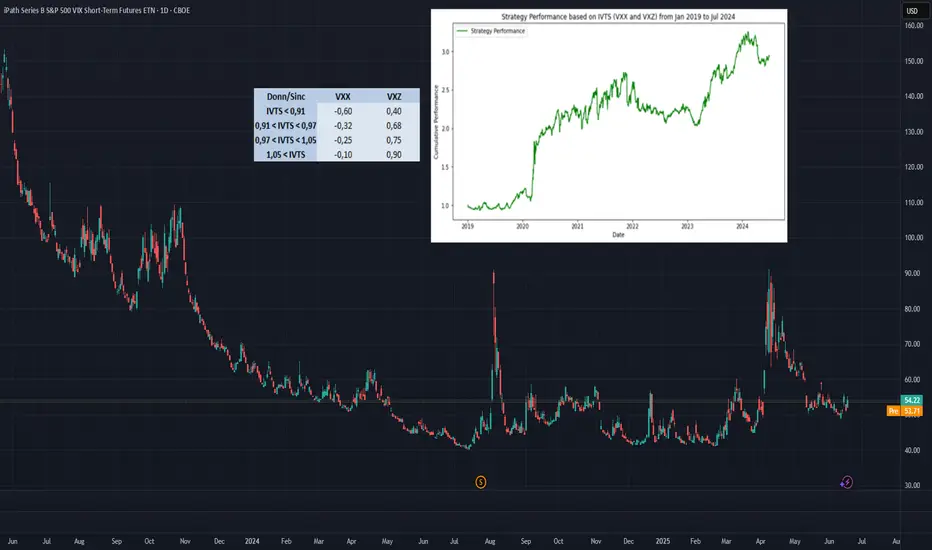
• Combine short VXX with long VXZ (an ETP tracking longer-dated VIX futures, balancing the 4th to 7th VIX contracts to achieve a constant expiration of 60days).
• Weighting is determined by the Implied Volatility Term Structure (IVTS), calculated as VIX / VIX3M. This approach adjusts positions based on the shape of the VIX futures curve, indicated by the IVTS. For instance, when the VIX futures curve shifts from contango (where near-term futures are cheaper than longer-term ones) to backwardation (where near-term futures are more expensive), it involves reducing short positions in VXX and increasing long positions in VXZ.
• This approach mimics the spirit of a calendar spread strategy in VIX futures and reflects the “S&P 500 Dynamic VIX Futures Index” , with weightings backed by research from Donninger (2011) and Sinclair (2013) - see performance chart and weighting-matrix enclosed in the introductory chart).
________________________________________
VIX Curves as Market Indicators
Beyond trading, VIX instruments and their term structure are widely used as market sentiment gauges. For instance:
Signs of Market Calm:
• VIX9D < VIX
• VIX < VIX3M
• VIX < VX1
• VX1 < VX2
These relationships imply that short-term volatility is lower than longer-term expectations, indicating near-term calmness in markets, occasionally leading to market complacency.
Traders and institutions use these signals to:
• Adjust positioning in broad market indices
• Determine hedging requirements
• Evaluate suitability of selling naked options
________________________________________
Final Thoughts
VIX ETPs offer a powerful toolkit for traders seeking to profit from or hedge against volatility. But they come with structural decay, leverage dynamics, and curve risk. Timing, strategy, and risk control are key.
NQ Power Range Report with FIB Ext - 6/18/2025 SessionCME_MINI:NQU2025
- PR High: 21940.50
- PR Low: 21863.00
- NZ Spread: 173.50
Key scheduled economic events:
08:30 | Initial Jobless Claims
10:30 | Crude Oil Inventories
14:00 | FOMC Economic Projections
- FOMC Statement
- Fed Interest Rate Decision
14:30 | FOMC Press Conference
AMP margins increase to 25% for expected FOMC volatility spike
Session Open Stats (As of 12:45 AM 6/18)
- Session Open ATR: 375.35
- Volume: 31K
- Open Int: 213K
- Trend Grade: Neutral
- From BA ATH: -3.8% (Rounded)
Key Levels (Rounded - Think of these as ranges)
- Long: 22096
- Mid: 20383
- Short: 19246
Keep in mind this is not speculation or a prediction. Only a report of the Power Range with Fib extensions for target hunting. Do your DD! You determine your risk tolerance. You are fully capable of making your own decisions.
BA: Back Adjusted
BuZ/BeZ: Bull Zone / Bear Zone
NZ: Neutral Zone

BITx - Weekly Volatility Snapshot Good Morning -- Happy Father's day to any dad's out there!
Let's took a weekly look at CBOE:BITX -- our 2x leveraged BITSTAMP:BTCUSD fund.
Last week, we saw a beautiful gap up to the upper HV63 implied ranges were profit was taken and accelerated selling begin. Our bi-weekly trending values have increased due to the increasing volatility. The weekly candle ended with some body to it, but was mostly flat due to the gap closing with a big wick up.
Our IV (85.47%) entering the week is trending within 4% of the sliding yearly lows and seemingly increasing as it tracks near-term trending markets -- HV10 (70.04%) has increased from the movement last week +7.35% and is now +22.17% off sliding yearly lows. As the spring is uncoiling, and bi-weekly regresses towards quarterly means our premium capture erodes and our range expands. I love trading volatility and ranges.
The 'strength of IV' here for HV10 is 82% -- so you have to account when positioning that the trending near-term volatility IS INCREASING but IS WEAKER than what is predicted. The 'strength of IV' here for HV63 is 101% -- showing that what is predicted is fairly valued to me on a regression scale.
Please -- Pull my chart onto your layout and use my implied ranges and data, follow along through the week on your own screen as we track and measure the volatility -- let's get this conversation started!
CHEERS

Cisco Is Pushing a Generational HighCisco Systems has climbed as AI investment helps power growth, and some traders may think the move will continue.
The first pattern on today’s chart is the February 13 peak of $66.50. It was the highest level since September 2000, when the dotcom bubble was deflating. The networking giant come within $0.14 of that level on June 9 and remains in close proximity. Is a breakout coming?
(If CSCO were to clear this year’s peak, investors may next eye $82, its previous all-time high from March 2000.)
Next consider the May 15 closing price of $64.26 following strong quarterly results. The stock probed below the level last week and bounced. That may suggest old resistance has become new support.
Third, the 8-day exponential moving average (EMA) has stayed above the 21-day EMA. Such a sequence may reflect a short-term uptrend.
Finally, Bollinger Band Width has dropped as price moves narrow. Could that tightening price action open the door to price expansion?
Check out TradingView's The Leap competition sponsored by TradeStation.
TradeStation has, for decades, advanced the trading industry, providing access to stocks, options and futures. If you're born to trade, we could be for you. See our Overview for more.
Past performance, whether actual or indicated by historical tests of strategies, is no guarantee of future performance or success. There is a possibility that you may sustain a loss equal to or greater than your entire investment regardless of which asset class you trade (equities, options or futures); therefore, you should not invest or risk money that you cannot afford to lose. Online trading is not suitable for all investors. View the document titled Characteristics and Risks of Standardized Options at www.TradeStation.com . Before trading any asset class, customers must read the relevant risk disclosure statements on www.TradeStation.com . System access and trade placement and execution may be delayed or fail due to market volatility and volume, quote delays, system and software errors, Internet traffic, outages and other factors.
Securities and futures trading is offered to self-directed customers by TradeStation Securities, Inc., a broker-dealer registered with the Securities and Exchange Commission and a futures commission merchant licensed with the Commodity Futures Trading Commission). TradeStation Securities is a member of the Financial Industry Regulatory Authority, the National Futures Association, and a number of exchanges.
TradeStation Securities, Inc. and TradeStation Technologies, Inc. are each wholly owned subsidiaries of TradeStation Group, Inc., both operating, and providing products and services, under the TradeStation brand and trademark. When applying for, or purchasing, accounts, subscriptions, products and services, it is important that you know which company you will be dealing with. Visit www.TradeStation.com for further important information explaining what this means.


NQ Power Range Report with FIB Ext - 6/17/2025 SessionCME_MINI:NQU2025
- PR High: 22177.25
- PR Low: 22065.25
- NZ Spread: 250.25
Key scheduled economic events:
08:30 | Retail Sales (Core|MoM)
Contract rollover week
Session Open Stats (As of 12:45 AM 6/17)
- Session Open ATR: 385.81
- Volume: 47K
- Open Int: 178K
- Trend Grade: Neutral
- From BA ATH: -3.5% (Rounded)
Key Levels (Rounded - Think of these as ranges)
- Long: 22096
- Mid: 20383
- Short: 19246
Keep in mind this is not speculation or a prediction. Only a report of the Power Range with Fib extensions for target hunting. Do your DD! You determine your risk tolerance. You are fully capable of making your own decisions.
BA: Back Adjusted
BuZ/BeZ: Bull Zone / Bear Zone
NZ: Neutral Zone

Oil (WTI) – Geo-Political Concerns Drive SentimentA quickly escalating conflict in the Middle East between Israel and Iran has seen Oil (WTI) volatility increase dramatically as the focus for traders has shifted overnight from worries about an on-going lack of demand due to a slowing global economy over to major supply concerns moving forward from this oil rich region.
This shift has seen Oil trade from lows of 60.17 on May 30th, to an early Monday high of 76.31, as weekend attacks by Israel on Iran's energy infrastructure introduced more uncertainty at the start of this new trading week regarding Israel's future strategy in this conflict. Prices have since settled down and moved back towards 72.80 (0830 BST) at time of writing but looking forward traders may need to balance the potential for further escalation/duration of this conflict against extra Oil production/supply from OPEC+ and the US.
Also important for Oil prices across the week could be the outcome of the Federal Reserve (Fed) Interest Rate Decision (Wed 1900 BST) and Press Conference (Wed 1930 BST). No change to interest rates is expected, but the updates from Fed policymakers to their inflation and interest rate expectations for the rest of 2025 could have a major impact on risk sentiment, the dollar and anticipated Oil demand.
Technical Update: Utilising Bollinger Bands
A rise in tensions in the Middle East last week prompted a sharp acceleration higher in the price of Oil. This saw price volatility increase, reflected by the widening upper and lower Bollinger bands and prices trading to levels last seen in late January 2025, as the chart below shows.
Traders will now likely be wondering if this type of price strength can continue, or if prices can enter a correction phase, even possibly a more extended period of price weakness.
Much will clearly depend on future market sentiment and price trends, and on any easing or escalation in geo-political tensions. However, with this in mind let's consider what may be the relevant support and resistance levels .
Potential Resistance Levels:
As the chart shows below, interestingly, last weeks price strength stalled against 75.99, which is equal to the February 3rd session high and with a setback in price developing from it so far today, this might be viewed by some as a potential first resistance.
As such, while not a guarantee of further price strength, closing breaks above 75.99 may be a sign of continued upside momentum towards 81.01, which is the January 15th price high and a potential next resistance focus for traders.
Potential Support Levels:
After such a strong advance in price, it might be harder to establish support levels, although, Fibonacci retracement levels on the recent May 30th to June 16th upside move in price, might prove useful. These retracement levels are highlighted on the chart below.
The 38.2% Fibonacci retracement of the price strength stands at 70.12 and this might prove to be a possible first support focus, if price weakness is seen over coming days. Closing breaks below 70.12, if seen, may then lead to declines towards 66.32, the deeper 61.8% Fibonacci retracement level.
The material provided here has not been prepared
accordance with legal requirements designed to promote the independence of investment research and as such is considered to be a marketing communication. Whilst it is not subject to any prohibition on dealing ahead of the dissemination of investment research, we will not seek to take any advantage before providing it to our clients.
Pepperstone doesn’t represent that the material provided here is accurate, current or complete, and therefore shouldn’t be relied upon as such. The information, whether from a third party or not, isn’t to be considered as a recommendation; or an offer to buy or sell; or the solicitation of an offer to buy or sell any security, financial product or instrument; or to participate in any particular trading strategy. It does not take into account readers’ financial situation or investment objectives. We advise any readers of this content to seek their own advice. Without the approval of Pepperstone, reproduction or redistribution of this information isn’t permitted.

NQ Power Range Report with FIB Ext - 6/16/2025 SessionCME_MINI:NQU2025
- PR High: 21903.75
- PR Low: 21726.00
- NZ Spread: 396.75
No key scheduled economic events
Contract rollover week
Session Open Stats (As of 12:15 AM 6/16)
- Session Open ATR: 382.14
- Volume: 18K
- Open Int: 62K
- Trend Grade: Neutral
- From BA ATH: -4.1% (Rounded)
Key Levels (Rounded - Think of these as ranges)
- Long: 22096
- Mid: 20383
- Short: 19246
Keep in mind this is not speculation or a prediction. Only a report of the Power Range with Fib extensions for target hunting. Do your DD! You determine your risk tolerance. You are fully capable of making your own decisions.
BA: Back Adjusted
BuZ/BeZ: Bull Zone / Bear Zone
NZ: Neutral Zone

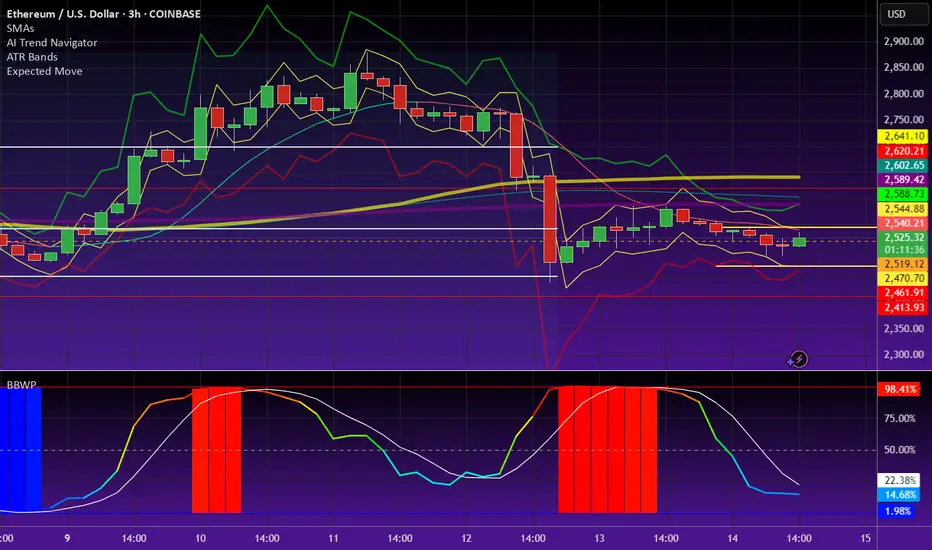
Ethereum Liquidity Pool RangeOn the ETH/USDC liquidity pool on the Base network, Ethereum’s volatility is beginning to stabilize, creating a favorable range for liquidity provision, as indicated by the horizontal red lines. There may be an opportunity to tighten this range further in the coming hours, but additional data is needed to confirm. For now, the concentrated range is being set slightly wider, given that we’re still relatively close to the significant volatility spike from earlier in the week.
QQQ - Weekly Volatility PotentialGood Morning --
Last week we reviewed the potential of the S&P 500, this week let us take a look at the potential perspective of NASDAQ:QQQ .
IV (17.97%) entering the week is trending 31% IVp on the year and has been gradually lowering as price action grinds higher and out of corrective territory -- This is +2.61% more volatile than near-term trending values of HV10 (15.36%) and only -0.57% under HV21 (18.54%), our monthly trending values.
Looking towards next week, I expect the CBOE:VIX to continually soften IV values as the broader markets push towards all-time highs this week. NASDAQ:QQQ historical values are coiling to where we will soon need a volatility spike, but not just yet -- my weekly price target here is simple (HV10 upper implied range) $539.44 with wicking potential above to monthly trends (HV21 upper implied ranges) at $541.42.
Only time will tell, we can't control the markets but we sure can manage our own risk within them. Remember to always be hedged and come back to join me next weekend as we review the charts for what happened VS our expectation!
CHEERS

BITx - Weekly Volatility PotentialGood Morning!
Here is my weekly perspective for CBOE:BITX --
From when we reviewed last weekend, IV (84.60%) has lowered -2.39% and is entering the week with a 2% IVp. We have been in this pattern of rotating IV and Bi-Weekly volatility trends back and forth as HV10 (62.69%) entering the week has increased +2.47% from it's respective level entering last week. The prediction of what is to happen is contracting as what is actually happening in the short-term is trending up.
Bi-Weekly and Monthly volatility values after being 100% coiled and both putting in new yearly lows a month ago are starting to unwind as they create distance from those exact lows.
Could long-term trending means be on the horizon with quarterly values? Bi-weekly will eventually find it's way back there, question is when. Our best advantage, is to continue to track the data and ebb and flow with the markets and macro news.
Looking towards this next week, Our HV10 (62.69%) trending values are still contracting under our monthly HV21 (68.45%) trends, but IV (84.60%) although lowering, is reflecting expansion.
There is a premium capture past stated IV if we can find means regression back to HV63 (99.07%), as what is happening will expand past what is predicted to happen. As of now this value is 14.97% and equates to a premium capture $8.24 or $88.24 per lot or contract.
Again, when IV contracts chasing HV10, but it expands to HV63, we look to collect the premium value difference with the move.
Only time will tell, I think we will see another volume push into this week -- Remember to always be hedged and come back to join me next weekend as we review the charts for what happened VS our expectation!
CHEERS

Weekly Volatility SnapshotVolatility, as measured by standard deviation, quantifies market elasticity and provides a level of probability and precision to trade within, that humbles us all.
Last week, the TVC:VIX opened steadily dropping as markets rose into Thursday, (June 5th) where the broader markets drilled within the public drama of Elon Musk and President Trump. Talk about DRAMA -- Lay of the JUICE GUYs. On top of that -- Although there was progress, trade deals are still looming and uncertainty lingers. That day the volatility index closed spiking to $18.46, where it was to start the week -- only to once again have the dip bought right up and the index drops again to close the week at $16.44.
We have now finished our first week of June with markets volatility still contracting as they grind higher. I expect the TVC:VIX to continue lowering softly as markets rotate to new highs this week. When this happens expect IV to lower within the move -- Unless we can see a news catalyst with any progress on trade deals, good or bad, we will see the same movement as last week with individual stocks being rotated.
As we talked about last weekend, we saw NASDAQ:MSFT make a HUGE move! Entering this week HV10 (14.55%) has expanded above HV21 (13.97%) and IV (16.77%) has lowered to it's lowest value in the past year with IVp reaching 0%. Yet still above bi-weekly values.
Looking towards next week, the SP:SPX with IV (13.56%) is still lowering as markets push higher while matching HV10 (13.11%) trending values. These bi-weekly values are of 97% strength of current IV. I believe we will see the target of $6082.71 with even a stretch to HV21 (15.69%) weighted to IV ranges showing potential of $6100.00 this week.
As for our precious BTC funds, NASDAQ:IBIT and CBOE:BITX for 2x leverage, look for my upcoming weekly post on the current state of low IV and the potential expansion overhead to quarterly values. I do currently have open trades and providing transparency within my weekly analysis.
See you back here next week! Same time same place.

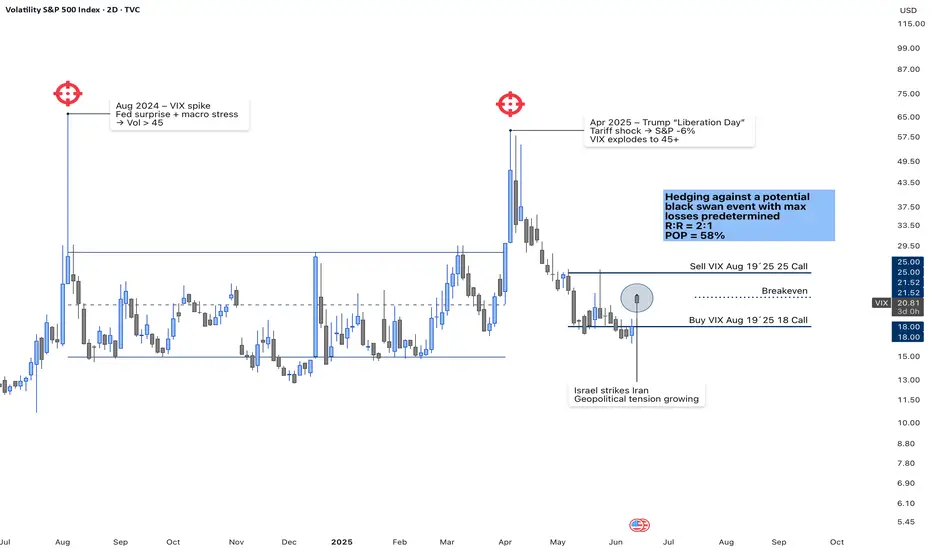
VIX Call Spread – Hedging Against Black Swan Risk (Aug ’25)📌 VIX Vertical Call Spread – Aug 19, 2025 (18/25)
Executed on June 13, 2025
Volatility has compressed near multi-month lows, but the chart shows two major spikes above 45 in less than a year — triggered by macro shocks (Fed surprises, Trump’s “Liberation Day” tariffs, geopolitical escalations like Israel–Iran).
I’m positioning with a long call spread on the VIX (Buy 18C / Sell 25C, exp. Aug 19), structured to hedge against a black swan while maintaining capital discipline.
• Risk/Reward: 2:1
• Probability of Profit (POP): ~58%
• Breakeven: ~21
• Defined risk / Defined reward
• No directional delta risk
I’m not forecasting volatility — I’m accepting that extreme events can (and do) happen. This spread pays off only if volatility spikes again above 21–22 in the next 60 days, which aligns with historical context.
🔒 No need to predict the trigger. Just manage exposure and define your risk upfront.
📈 Follow for more volatility and options setups based on structure + context.
Let’s stay ahead, not reactive.
[$BA] Boeing's black friday?NYSE:BA
Quick-Take
Unfortunately, an accident occured with a Boeing Dreamliner 787 in India.
This triggered a 'small crash' in the stock as well, due to Boeing's (ongoing) raising concerns for quality and safety.
However, we should see it as chance for a potential swing-trade of 7 days.
⭕ Risks
The analysis of the plane crash will take a couple of days and there are even rumors about an 'external factor' being the reason for the plane to fall from the sky.
Eitherway: Volatility is a two-edged sword that we should utilize to our advantage.
🟢 Pros
The Iran/Israel conflict is escalating, that led to a spike for a Defense companies such as $ NYSE:LMT XETR:RHM . But NYSE:BA takes also part of the military-industrial complex that should profit of the bad times in geopolitics.
📏 Position
We position ourselves bullish via options:
-> buy Call-Options (long-call or bull-call-spreads)
-> sell Put-Options (short-put (cc) or bull-put-spreads)
What do you guys think?

[$BA] Boeing's black friday?NYSE:BA
Quick-Take
Unfortunately, an accident occured with a Boeing Dreamliner 787 in India.
This triggered a 'small crash' in the stock as well, due to Boeing's (ongoing) raising concerns for quality and safety.
However, we should see it as chance for a potential swing-trade of 7 days.
⭕ Risks
The analysis of the plane crash will take a couple of days and there are even rumors about an 'external factor' being the reason for the plane to fall from the sky.
Eitherway: Volatility is a two-edged sword that we should utilize to our advantage.
🟢 Pros
The Iran/Israel conflict is escalating, that led to a spike for a Defense companies such as NYSE:LMT XETR:RHM . But also NYSE:BA is part of the military-industrial complex that should profit of the bad times in geopolitics.
📏 Position
We position ourselves bullish via options:
-> buy Call-Options (long-call or bull-call-spreads)
-> sell Put-Options (short-put (cc) or bull-put-spreads)
What do you guys think?

GBPUSD – Rejection From New Price High Questions UptrendThe escalation in geo-political risks overnight in the Middle East, marked by Israel's attack on Iranian nuclear sites which was followed by Iran's retaliatory drone strikes against Israel, have seen a rush to safe haven assets, which this time included buying dollars (a rarity of late!).
This has seen GBPUSD fall quickly from a fresh 2025 high hit early this morning at 1.3633, back down to lower levels around 1.3540 (at time of writing) and questions whether the highs for GBPUSD may now be in place in the short term, with traders possibly reluctant to add to fresh longs into the weekend, and ahead of next week's Bank of England (BoE) rate meeting on Thursday (June 19th).
Looking forward into the Friday close, traders may now be on headline watch, especially considering Iran's vow to respond to Israel's initial attack with harsh blows against both Israel and the US. Any attack by Iran against US targets, while potentially unlikely, could be viewed as a level up and President Trump has stated that the US are on high alert just in case.
On the data front, the US Preliminary Michigan Consumer Sentiment for June is released at 1500 BST today. This will provide the next update on US consumer inflation expectations as well as sentiment, which although important are possibly unlikely to shift the focus of traders from progress reports regarding geo-political developments in the Middle East.
Technical Update: Rejection From New Price High Questions Uptrend
Of late, it has been a positive phase of sentiment that has been evident for GBPUSD, as a price pattern of higher highs and higher lows has formed, as the chart below shows.
This has resulted in a new recovery price high being posted this morning at 1.3633, which represents the highest trade in GBPUSD since late February 2022. However, so far this new upside extreme in price has held and seen price weakness emerge.
This may now see some traders questioning the ability of GBPUSD to maintain its current upside momentum, even suggest the potential of a more extended phase of weakness.
What support and resistance levels might be worth watching to maybe help determine the next direction of price movement?
Potential Support Levels:
Having held price weakness seen earlier this week, the rising Bollinger mid-average may continue to be a support focus. This currently stands at 1.3504, and closing breaks below this level, if seen, might result in a more extended phase of weakness.
Such downside breaks in price, while not a guarantee of further price declines, could see focus then shift to potential support at 1.3444, which is equal to the 38.2% Fibonacci retracement level, and if this in turn gives way on a closing basis, towards 1.3385, the deeper 50% retracement level.
Potential Resistance Levels:
As the chart below shows, sellers have been found this morning at the 1.3633 level and may be again. This could prove to be the first resistance point to monitor if fresh attempts at price strength are seen over coming sessions.
Successful closing breaks above 1.3633 as a result, could point to an extension of the current uptrend pattern, with the next resistance level then potentially being 1.3749, which is the January 2022 high.
The material provided here has not been prepared
accordance with legal requirements designed to promote the independence of investment research and as such is considered to be a marketing communication. Whilst it is not subject to any prohibition on dealing ahead of the dissemination of investment research, we will not seek to take any advantage before providing it to our clients.
Pepperstone doesn’t represent that the material provided here is accurate, current or complete, and therefore shouldn’t be relied upon as such. The information, whether from a third party or not, isn’t to be considered as a recommendation; or an offer to buy or sell; or the solicitation of an offer to buy or sell any security, financial product or instrument; or to participate in any particular trading strategy. It does not take into account readers’ financial situation or investment objectives. We advise any readers of this content to seek their own advice. Without the approval of Pepperstone, reproduction or redistribution of this information isn’t permitted.

[06/09] [GEX] Weekly SPX OutlookLast week’s outlook played out quite well — as anticipated, SPX hit the 6000 level, closing exactly there on Friday. This was the realistic target we highlighted in last week's idea.
🔭 SPX: The Bigger Outlook
It's difficult to say whether the rising SPX trend will continue. We're still in the "90-day agreement period" set by the administration, and so far, the market has shown resilience, avoiding deeper pullbacks like the one we saw in April.
With VIX hovering around 17–18, we’ve reached a zone where further SPX upside would require volatility. For the index to continue rising meaningfully, it needs to reverse the current bearish macro environment, and that can only happen with strong buying momentum — not a slow grind.
The parallel downward channel drawn a few weeks ago is still technically valid. Even a short 100-point squeeze would fit within this structure before a larger move down unfolds.
GEX levels give us useful clues heading into Friday. We're currently in a net positive GEX zone across all expirations, giving bulls a structural advantage, just like last week.
As of Monday’s premarket, SPX spot is at 6009.The Gamma Flip zone is between 5975–5990, with a High Volume Level (HVL) at 5985.
🔍 Let’s zoom in with our GEX levels — this gives us a deeper view than our GEX Profile indicator for TradingView alone.
🐂 🟢 If SPX moves higher, the following are logical profit-taking zones:
6050 (Delta ≈ 33)
6075 (Delta ≈ 25)
6100 (Delta ≈ 17)
🎯 Targeting above 6100 currently feels irrational — for instance, the next major gamma squeeze zone is at 6150, but that corresponds to a delta 6 level (≈94% chance the price closes below it), so I won’t aim that high yet.
🐻🔴 In a bearish scenario:
5975 and 5950 are the first nearby support zones (Deltas 30 and 38).
If momentum picks up, 5900 becomes reachable quickly, even if it's technically a 17-delta distance — because that’s deep in the negative GEX zone.
📅 Don’t forget: On Wednesday premarket, we’ll get Core Inflation Rate data — a key macro risk that could shake things up, regardless of TSLA drama fading.
📌 SPX Weekly Trading Plan Conclusion
Whatever your bias, keep cheap downside hedges in place. We've been rising for a long time, and even if SPX breaks out of the descending channel temporarily, resistance and the gamma landscape may pull price back swiftly.
